 Journal of Environmental Protection, 2011, 2, 778-795 doi:10.4236/jep.2011.26090 Published Online August 2011 (http://www.SciRP.org/journal/jep) Copyright © 2011 SciRes. JEP Effect of Asian Dust Storms on the Ambient SO2 Concentration over North-East India: A Case Study Timmy Francis Physical Research Laboratory, Ahmedabad, India. Email: timmyf@prl.res.in Received May 3rd, 2011; revised June 12th, 2011; accepted July 21st, 2011. ABSTRACT Ambient SO2 concen tration at a high rain fall site, Shillong (25.67˚N, 91.91˚E, 1064 m ASL), located in North-East In- dia, was measured during March 2009 and January 2010 with the aim to understand the effect of long range transport of pollutants from North-East Asia on the ambient SO2 levels at this relatively clean site. The concentrations recorded during the former sampling period were very high (Max: 262.3 ppb)—which decayed down gradually towards the end the sampling period—whereas those during the latter sampling period were well within the acceptable limits (Max: 29.7 ppb). This elevated SO2 concentrations during March 2009 is p roposed to have association with a major cold air outbreak and an associated cyclone preceding one of the dust storm events reported in China, and a resultant sudden change in wind trajectory leading to the long range transport of pollutants to the sampling site. The argument is for- mulated on the basis of the back trajectory analysis performed using HYSPLIT for the month of March 2009—the plots clearly showed a drastic change in wind trajectories between 8th and 15th of March 2009 wherein the winds traveled over some of the highly polluted regions such as the Perm region of Russia—and on the results from model runs per- formed using the global 3-D model of tropospheric chemistry, GEOS-Chem (v8-03-01)—it clearly showed the tropo- spheric SO2 over Perm region in Russia peaking during Nov, Dec, Jan, Feb and Mar every year, possibly due to central heating. The observation of long range transport of SO2 from the highly industrialized areas of Perm in Russia to North-East India during dust storm events has importan t implications to the present und erstanding on its relative con- tribution to the Asian pollutant outflow to the Pacific during spring as the GEOS-Chem model run s also showed regions in and around Russia with relatively high concentrations of atmospheric NOx, Peroxyacetyl Nitrate, Lumped Per- oxypropionyl Nitrate, HNO3, HNO4, C3H8, C2H6, SO4, NH4, Inorganic Sulphur Nitrates and Lumped Alkyl Nitrate. Keywords: SO2, GEOS-Chem, HYSPLIT, Cold Air Outbreaks, Asian Dust Storms, Asian Pollutant Outflow 1. Introduction Asian region is fast evolving as one of the major energy consuming regions in the world for a rapidly growing population and emerging economy [1], projected mega cities in Asia as one of the large emission sources of SO 2. As per IPCC 2007, there has been a regional shift in the emissions of SO2 from US and Europe to South-East Asia, with implication to shift in atmospheric radiative forcing patterns for these regions [2-4]. In this scenario, monitoring ambient SO2 concentration coupled with wind trajectory analysis in the North-East region of India —characterized by high rain fall—has special significance to assessing the role of long range transport from North- East Asia in controlling the pollutant characteristics over this region. With this objective ambient SO2 concentra- tions were measured during March 2009 and January 2010 at a high rainfall site in North-East India, Shillong (25.67˚N, 91.91˚E, 1064 m Above Sea Level (ASL)). 2. Materials and Methods 2.1. Site Description: Shillong (25.67˚N, 91.91˚E, 1064 m ASL) The sampling site (25.67˚N, 91.91˚E, 1064 m ASL) is located about 18 km away from the Shillong city, located on the Shillong Plateau which is an outlier of the plateau of peninsular India and is composed primarily of ancient rocks. The high est point is Sh illo ng peak , at 19 61 m ASL located 5 km south of the city of Shillong. It is on 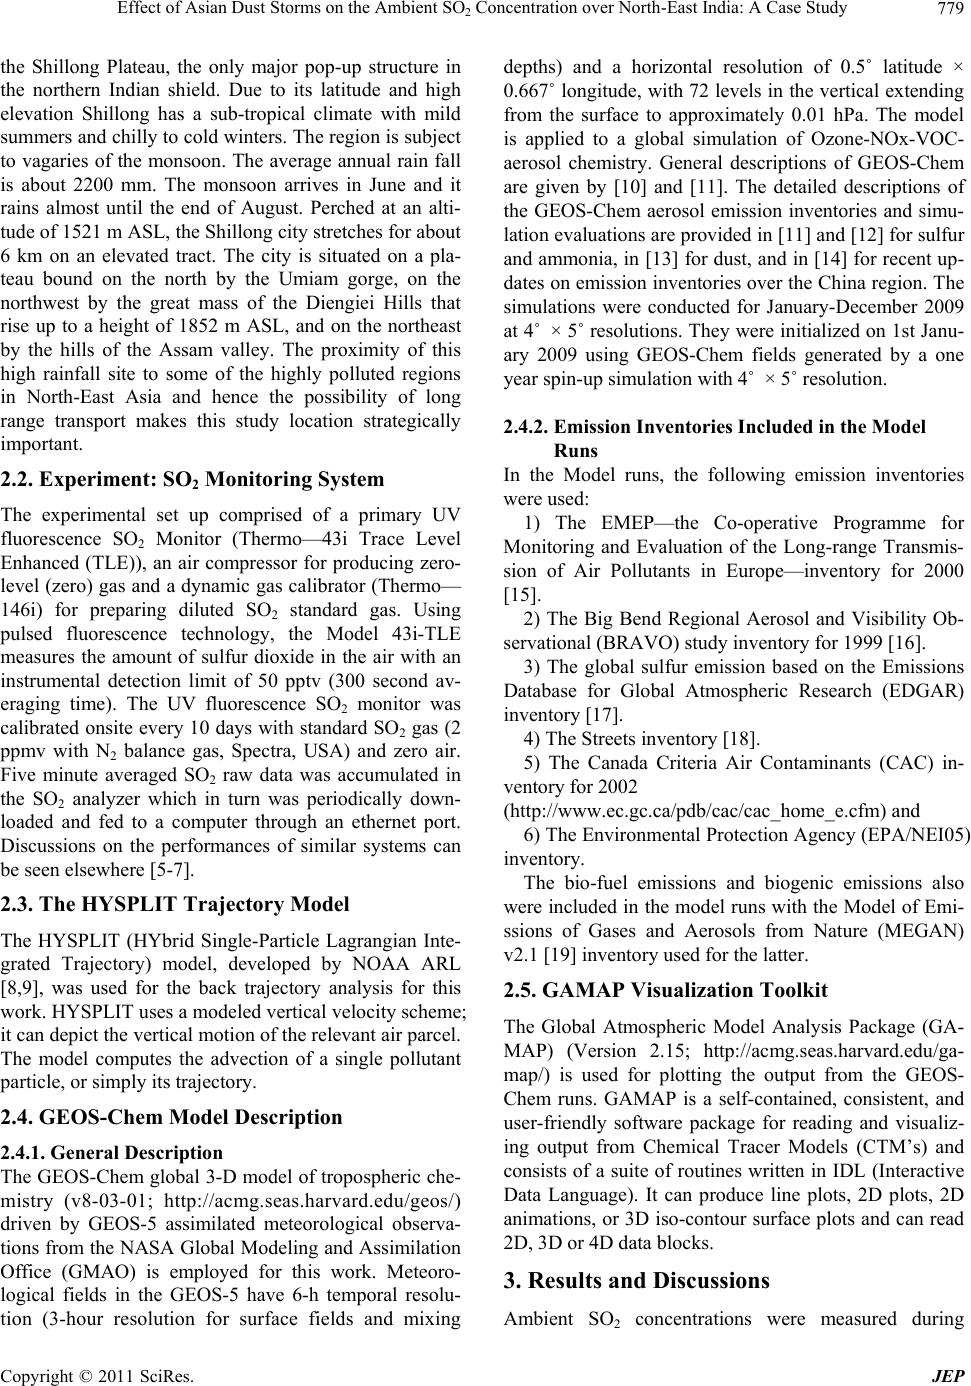 Effect of Asian Dust Storms on the Ambient SO Concentration over North-East India: A Case Study779 2 the Shillong Plateau, the only major pop-up structure in the northern Indian shield. Due to its latitude and high elevation Shillong has a sub-tropical climate with mild summers and chilly to cold winters. The region is sub ject to vagaries of the monsoon. The average annual rain fall is about 2200 mm. The monsoon arrives in June and it rains almost until the end of August. Perched at an alti- tude of 1521 m ASL, the Sh illong city stretch es for about 6 km on an elevated tract. The city is situated on a pla- teau bound on the north by the Umiam gorge, on the northwest by the great mass of the Diengiei Hills that rise up to a height of 1852 m ASL, and on the northeast by the hills of the Assam valley. The proximity of this high rainfall site to some of the highly polluted regions in North-East Asia and hence the possibility of long range transport makes this study location strategically important. 2.2. Experiment: SO2 Monitoring System The experimental set up comprised of a primary UV fluorescence SO2 Monitor (Thermo—43i Trace Level Enhanced (TLE)), an air compressor for producing zero- level (zero) gas and a dynamic gas calibrator (Thermo— 146i) for preparing diluted SO2 standard gas. Using pulsed fluorescence technology, the Model 43i-TLE measures the amount of sulfur dioxide in the air with an instrumental detection limit of 50 pptv (300 second av- eraging time). The UV fluorescence SO2 monitor was calibrated onsite every 10 days with standard SO2 gas (2 ppmv with N2 balance gas, Spectra, USA) and zero air. Five minute averaged SO2 raw data was accumulated in the SO2 analyzer which in turn was periodically down- loaded and fed to a computer through an ethernet port. Discussions on the performances of similar systems can be seen elsewhere [5-7]. 2.3. The HYSPLIT Trajectory Model The HYSPLIT (HYbrid Single-Particle Lagrangian Inte- grated Trajectory) model, developed by NOAA ARL [8,9], was used for the back trajectory analysis for this work. HYSPLIT uses a modeled vertical velocity scheme; it can depict the vertical motion of the relevant air parcel. The model computes the advection of a single pollutant particle, or simply its trajectory. 2.4. GEOS-Chem Model Description 2.4.1. Gener al Description The GEOS-Chem global 3-D model of tropospheric che- mistry (v8-03-01; h ttp://acmg.seas.harvard.ed u/geos/) driven by GEOS-5 assimilated meteorological observa- tions from the NASA Global Modeling and Assimilation Office (GMAO) is employed for this work. Meteoro- logical fields in the GEOS-5 have 6-h temporal resolu- tion (3-hour resolution for surface fields and mixing depths) and a horizontal resolution of 0.5˚ latitude × 0.667˚ longitude, with 72 levels in the vertical extending from the surface to approximately 0.01 hPa. The model is applied to a global simulation of Ozone-NOx-VOC- aerosol chemistry. General descriptions of GEOS-Chem are given by [10] and [11]. The detailed descriptions of the GEOS-Chem aerosol emission inventories and simu- lation evaluations are provided in [11] and [12] for sulfur and ammonia, in [13] for dust, and in [14] for recent up- dates on emission inventories over the China region. The simulations were conducted for January-December 2009 at 4˚ × 5˚ resolutions. Th ey were initialized on 1st Janu - ary 2009 using GEOS-Chem fields generated by a one year spin-up simulation with 4˚ × 5˚ resolution. 2.4.2. Emission Inventories Included in the Model Runs In the Model runs, the following emission inventories were used: 1) The EMEP—the Co-operative Programme for Monitoring and Evaluation of the Long-range Transmis- sion of Air Pollutants in Europe—inventory for 2000 [15]. 2) The Big Bend Regional Aerosol and Visibility Ob- servational (BRAVO) study inventory for 1999 [16]. 3) The global sulfur emission based on the Emissions Database for Global Atmospheric Research (EDGAR) inventory [17]. 4) The Streets inventory [18]. 5) The Canada Criteria Air Contaminants (CAC) in- ventory for 2 0 02 (http://www.ec.gc.ca/pdb/cac/cac_home_e.cfm) and 6) The Environmental Protection Agency (EPA/NEI05) inventory. The bio-fuel emissions and biogenic emissions also were included in the model runs with the Mod el of Emi- ssions of Gases and Aerosols from Nature (MEGAN) v2.1 [19] inventory used for the latter. 2.5. GAMAP Visualization Toolkit The Global Atmospheric Model Analysis Package (GA- MAP) (Version 2.15; http://acmg.seas.harvard.edu/ga- map/) is used for plotting the output from the GEOS- Chem runs. GAMAP is a self-contained, consistent, and user-friendly software package for reading and visualiz- ing output from Chemical Tracer Models (CTM’s) and consists of a suite of routines written in IDL (Interactive Data Language). It can produce line plots, 2D plots, 2D animations, or 3D iso-contour surface plots and can read 2D, 3D or 4D dat a bl ocks. 3. Results and Discussions Ambient SO2 concentrations were measured during Copyright © 2011 SciRes. JEP 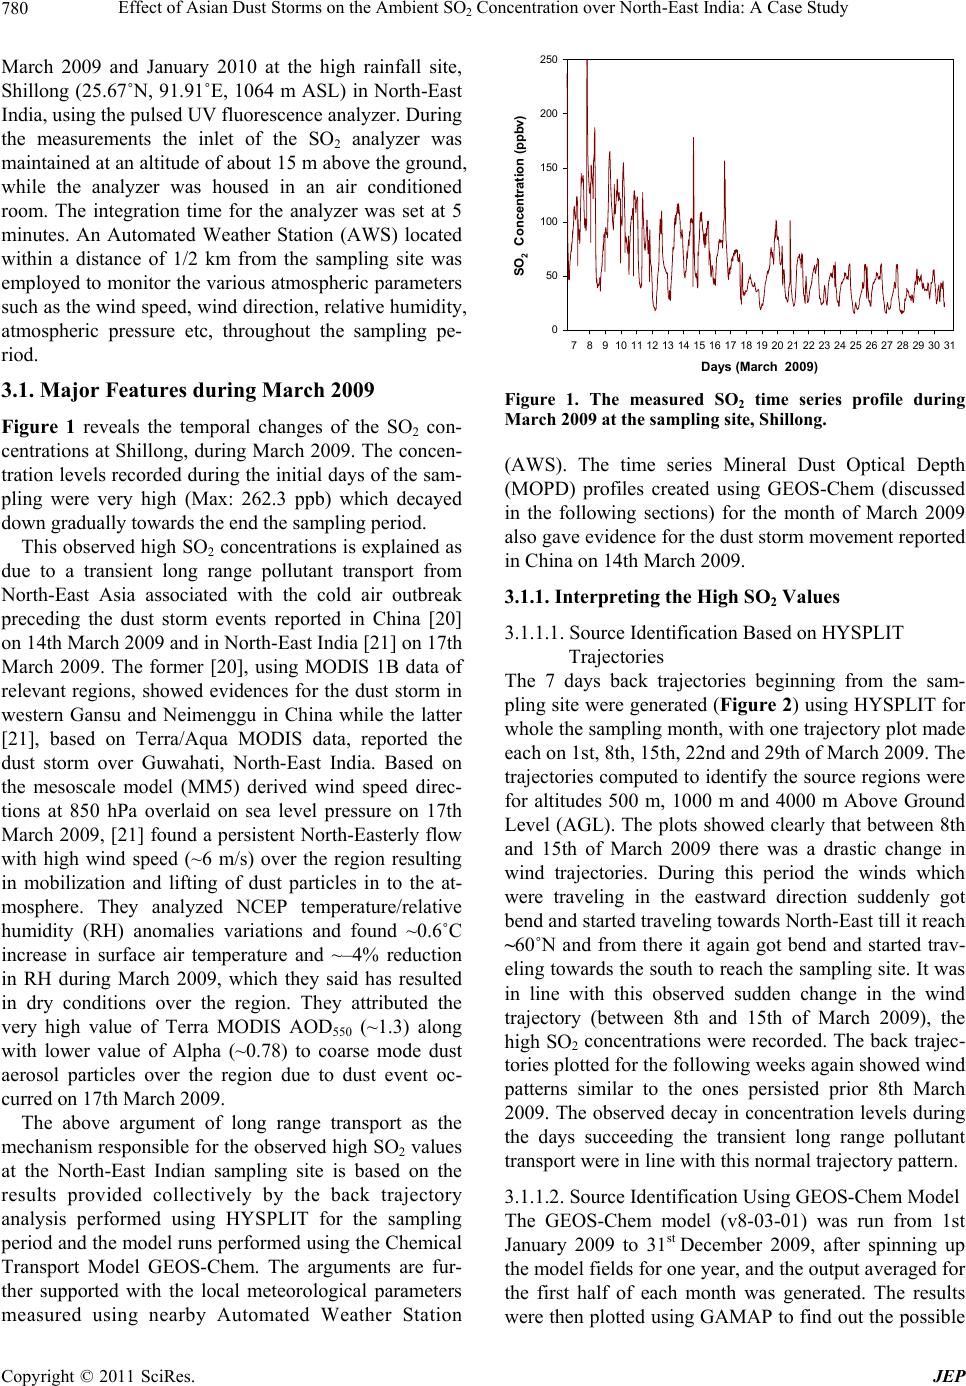 Effect of Asian Dust Storms on the Ambient SO Concentration over North-East India: A Case Study 780 2 March 2009 and January 2010 at the high rainfall site, Shillong (25.67˚N, 91.91˚E, 1064 m ASL) in North-East India, using the pulsed UV fluorescence analyzer. During the measurements the inlet of the SO2 analyzer was maintained at an altitude of about 15 m above the ground, while the analyzer was housed in an air conditioned room. The integration time for the analyzer was set at 5 minutes. An Automated Weather Station (AWS) located within a distance of 1/2 km from the sampling site was employed to monitor the various atmospheric parameters such as th e wind speed , wind direction , relative hu midity, atmospheric pressure etc, throughout the sampling pe- riod. 3.1. Major Features during March 2009 Figure 1 reveals the temporal changes of the SO2 con- centrations at Shillong, during March 2009 . The concen- tration levels recorded during the initial days of the sam- pling were very high (Max: 262.3 ppb) which decayed down gradually towards the end the sampling period. This observed high SO2 concentrations is explained as due to a transient long range pollutant transport from North-East Asia associated with the cold air outbreak preceding the dust storm events reported in China [20] on 14th March 200 9 and in Nor th- East India [21] on 17 th March 2009. The former [20], using MODIS 1B data of relevant regions, showed evidences for the dust storm in western Gansu and Neimenggu in China while the latter [21], based on Terra/Aqua MODIS data, reported the dust storm over Guwahati, North-East India. Based on the mesoscale model (MM5) derived wind speed direc- tions at 850 hPa overlaid on sea level pressure on 17th March 2009, [21] found a persistent Nor th-Easterly flow with high wind speed (~6 m/s) over the region resulting in mobilization and lifting of dust particles in to the at- mosphere. They analyzed NCEP temperature/relative humidity (RH) anomalies variations and found ~0.6˚C increase in surface air temperature and ~–4% reduction in RH during March 2009, which they said has resulted in dry conditions over the region. They attributed the very high value of Terra MODIS AOD550 (~1.3) along with lower value of Alpha (~0.78) to coarse mode dust aerosol particles over the region due to dust event oc- curred on 17th March 2009. The above argument of long range transport as the mechanism responsible for the observed high SO2 values at the North-East Indian sampling site is based on the results provided collectively by the back trajectory analysis performed using HYSPLIT for the sampling period and the model runs performed using the Chemical Transport Model GEOS-Chem. The arguments are fur- ther supported with the local meteorological parameters measured using nearby Automated Weather Station Days (March 2009) 789 10111213141516171819202122232425262728293031 SO 2 Concentration (ppbv) 0 50 100 150 200 250 Figure 1. The measured SO2 time series profile during March 2009 at the sampling site, Shillong. (AWS). The time series Mineral Dust Optical Depth (MOPD) profiles created using GEOS-Chem (discussed in the following sections) for the month of March 2009 also gave evidence for the dust storm movement reported in China on 14th March 2009. 3.1.1. Interpreting the High SO2 Values 3.1.1.1. Sou rce Identification B ased on HYS P LIT Trajectories The 7 days back trajectories beginning from the sam- pling site were generated (Figure 2) using HYSPLIT for whole the sampling month, with one trajectory plot made each on 1st, 8th, 15th , 2 2nd and 29th of March 2009. The trajectories computed to identify the source regions were for altitudes 500 m, 1000 m and 4000 m Above Ground Level (AGL). The plots showed clearly that between 8th and 15th of March 2009 there was a drastic change in wind trajectories. During this period the winds which were traveling in the eastward direction suddenly got bend and started traveling towards North-East till it reach ~60˚N and from there it again got bend and started trav- eling towards the south to reach the sampling site. It was in line with this observed sudden change in the wind trajectory (between 8th and 15th of March 2009), the high SO2 concentrations were recorded. The back trajec- tories plotted for th e fo llo wing week s ag ain show ed wind patterns similar to the ones persisted prior 8th March 2009. The observed decay in concentration levels during the days succeeding the transient long range pollutant transport were in line with this normal trajectory pattern. 3.1.1.2. S o urce Identification Using GEOS-Chem Model The GEOS-Chem model (v8-03-01) was run from 1st January 2009 to 31st December 2009, after spinning up the model fields for one year, and the output averaged for the first half of each month was generated. The results were then plotted using GAMAP to find out the possible Copyright © 2011 SciRes. JEP  Effect of Asian Dust Storms on the Ambient SO2 Concentration over North-East India: A Case Study Copyright © 2011 SciRes. JEP 781  Effect of Asian Dust Storms on the Ambient SO Concentration over North-East India: A Case Study 782 2 Figure 2. The 7-day back trajectories originating at the sampling site plotted using HYSPLIT for March 2009. SO2 source regions along the back trajectories obtained between 8th and 15th of March 2009. The plots clearly showed that many of the regions over which the winds traveled during this period are characterized by high concentrations of SO2. Out of these the Perm region in Russia has the highest SO2 concentration in the GEOS- Chem generated plots. 3.1.1.2. 1. The Perm City , Rus si a Perm, projected in this paper as the source region for the high SO2 containing air parcel detected at the sampling site, is a city in the eastern part of Russia, near the Urals Mountains. It is a major center of heavy industries, che- mical industries (varnishes, paints, fertilizers, sulfuric acid, etc.), petrochemical and oil refining industries, de- fense production, timber and wood processing industries, food industry and so on. This regional area has substan- tial deposits of natural resources (oil, gas, potassium, magnesium salt, precious and jobbing stones, gold and chromium ores and so on.) which is the base for both the extractive industries and related economic sectors of the region. The region of Perm has one of the richest mineral resource bases in Russia and has many mines. The Perm region is known for its long frosty, snowy Ural winters. However, the region’s severe continental climate causes abrupt seasonal changes, from a cold winter followed by a mild, usually warm spring and then by a hot summer. The cold winter necessitates central heating especially during the months November, De- cember, January, February, and March. The general pre- cipitation trend over Perm region shows lowest precipi- tation events during the months February and March followed by slightly high er precipitation events in April. 3.1.1.3. Anomalies Detected in Local Meteorology The Automated Weather Station (AWS)—located within 500m from the sampling location—provided meteoro- logical parameters such as wind speed & wind direction (Figure 3), relative humidity (Figure 4) and atmospheric pressure (Figure 5) throughout the month of March 2009 except for a small non-operational period from 20 - 23rd March 2009. Statistically the wind direction mostly re- mained South-East with second directional preference for South-West. The wind speed showed a transient in- crease between 9th and 13th of March 2009 with the maximum speed recorded of 3.2 m/s. The relative hu- midity (RH) remained more or less on the higher side throughout th e sampling period with a small dip reco rd ed between 10th and 12th followed by two spikes each on 13th and 14th. The highest RH value observed for the month was on 17th with the peak relative humidity value recorded of 99%. The Atmospheric pressure also kept Copyright © 2011 SciRes. JEP 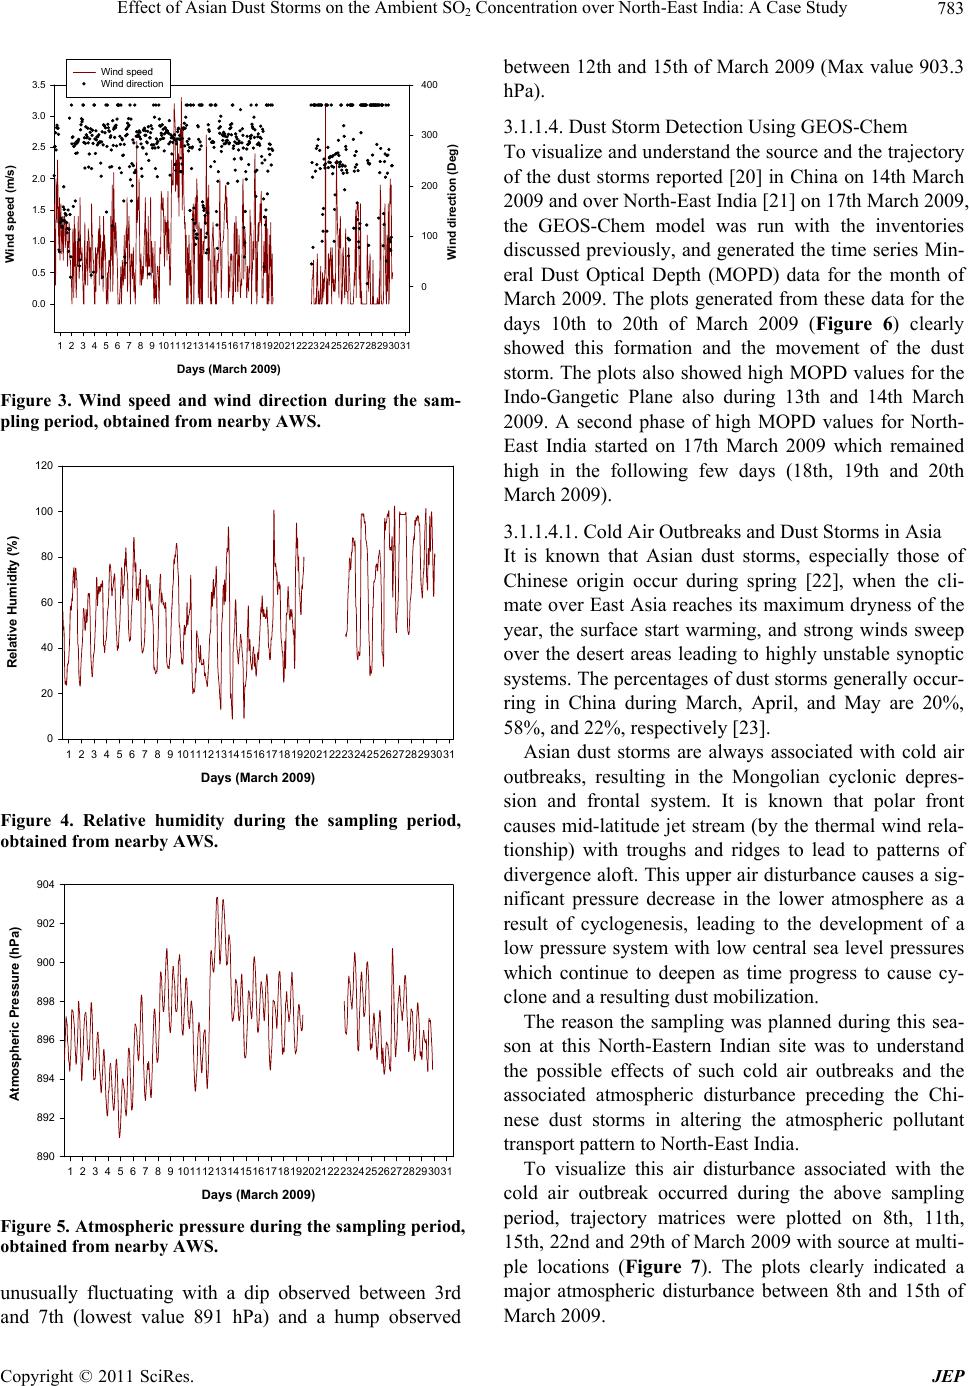 Effect of Asian Dust Storms on the Ambient SO Concentration over North-East India: A Case Study783 2 Days (March 2009) 12345678910111213141516171819202122232425262728293031 Wind speed (m/s) 0.0 0.5 1.0 1.5 2.0 2.5 3.0 3.5 Wind direction (Deg) 0 100 200 300 400 Wind s peed Wind direction Figure 3. Wind speed and wind direction during the sam- pling period, obtained from nearby AWS. Days (March 2009) 1 23 45 67 8910111213141516171819202122232425262728293031 Relative Humidity (%) 0 20 40 60 80 100 120 Figure 4. Relative humidity during the sampling period, obtained from nearby AWS. Days (March 2009) 1 23 45 67 8910111213141516171819202122232425262728293031 Atmospheric Pressure (hPa) 890 892 894 896 898 900 902 904 Figure 5. Atmospheric pressure during the sampling period, obtained from nearby AWS. unusually fluctuating with a dip observed between 3rd and 7th (lowest value 891 hPa) and a hump observed between 12 th and 15th of Marc h 2009 (Max value 903.3 hPa). 3.1.1.4. Dust Storm Detection Using GEOS-Chem To visualize and understand the source and the trajectory of the dust storms reported [20] in China on 14th March 2009 and over North-East India [ 21] on 17 th March 2009, the GEOS-Chem model was run with the inventories discussed previously, and generated the time series Min- eral Dust Optical Depth (MOPD) data for the month of March 2009. The plots generated from these data for the days 10th to 20th of March 2009 (Figure 6) clearly showed this formation and the movement of the dust storm. The plots also showed high MOPD values for the Indo-Gangetic Plane also during 13th and 14th March 2009. A second phase of high MOPD values for North- East India started on 17th March 2009 which remained high in the following few days (18th, 19th and 20th March 2009). 3.1.1.4.1. Cold Air Outbreaks and Dust Storms in Asia It is known that Asian dust storms, especially those of Chinese origin occur during spring [22], when the cli- mate over East Asia reaches its maximum dryness of the year, the surface start warming, and strong winds sweep over the desert areas leading to highly unstable synoptic systems. The percentages of dust storms generally occur- ring in China during March, April, and May are 20%, 58%, and 22%, respectively [23]. Asian dust storms are always associated with cold air outbreaks, resulting in the Mongolian cyclonic depres- sion and frontal system. It is known that polar front causes mid-latitude jet stream (by the thermal wind rela- tionship) with troughs and ridges to lead to patterns of divergence aloft. This upper air disturbance causes a sig- nificant pressure decrease in the lower atmosphere as a result of cyclogenesis, leading to the development of a low pressure system with low central sea level pressures which continue to deepen as time progress to cause cy- clone and a resulting dust mobilization. The reason the sampling was planned during this sea- son at this North-Eastern Indian site was to understand the possible effects of such cold air outbreaks and the associated atmospheric disturbance preceding the Chi- nese dust storms in altering the atmospheric pollutant transport pattern to North-East India. To visualize this air disturbance associated with the cold air outbreak occurred during the above sampling period, trajectory matrices were plotted on 8th, 11th, 15th, 22nd and 29th of March 2009 with so urce at multi- ple locations (Figure 7). The plots clearly indicated a major atmospheric disturbance between 8th and 15th of March 2009. Copyright © 2011 SciRes. JEP 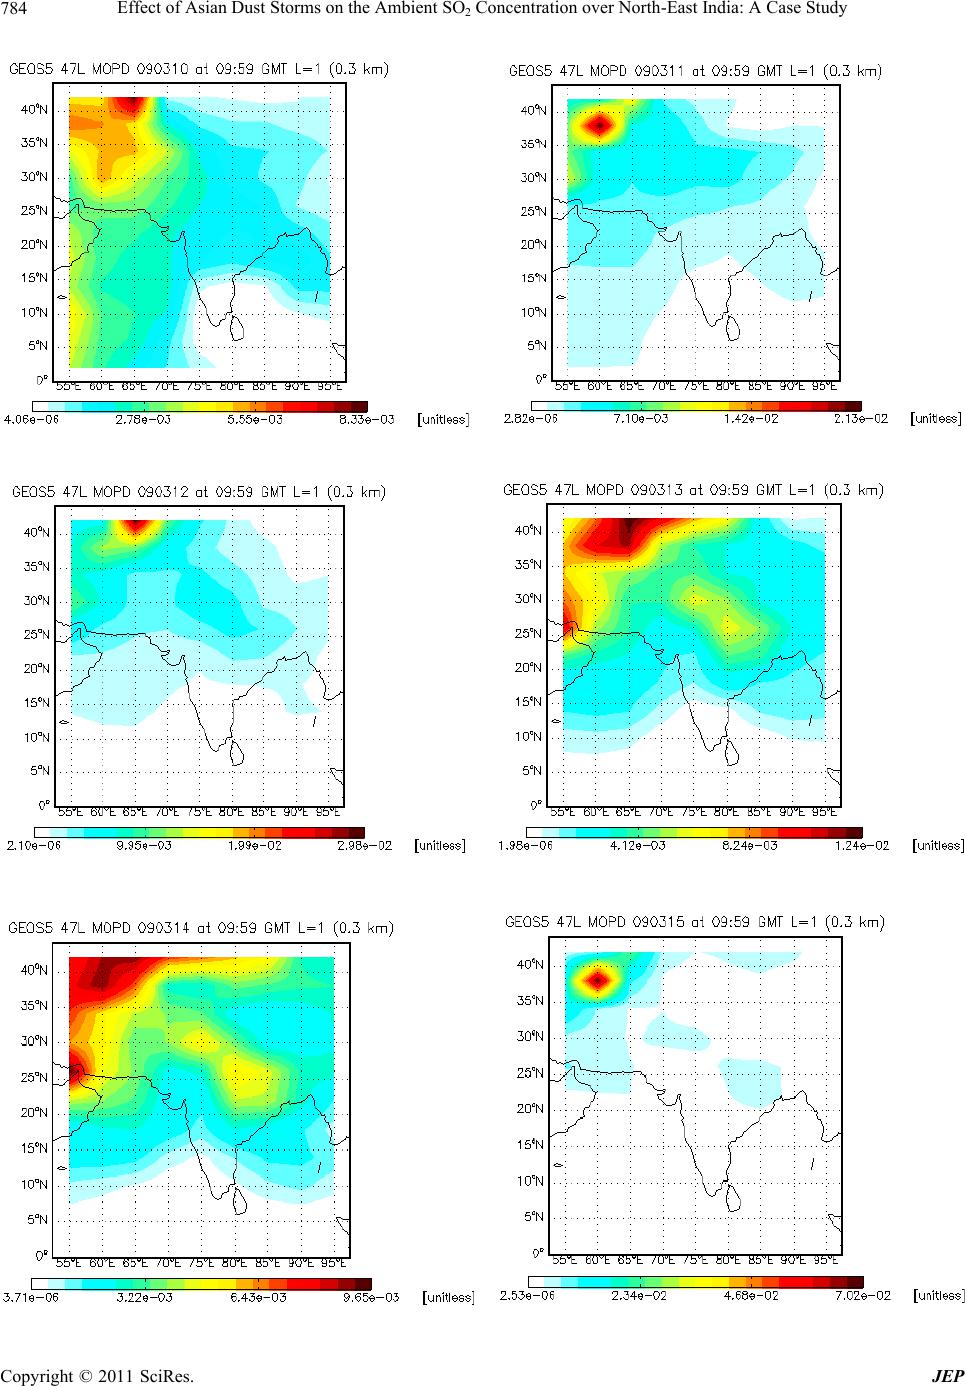 Effect of Asian Dust Storms on the Ambient SO2 Concentration over North-East India: A Case Study Copyright © 2011 SciRes. JEP 784 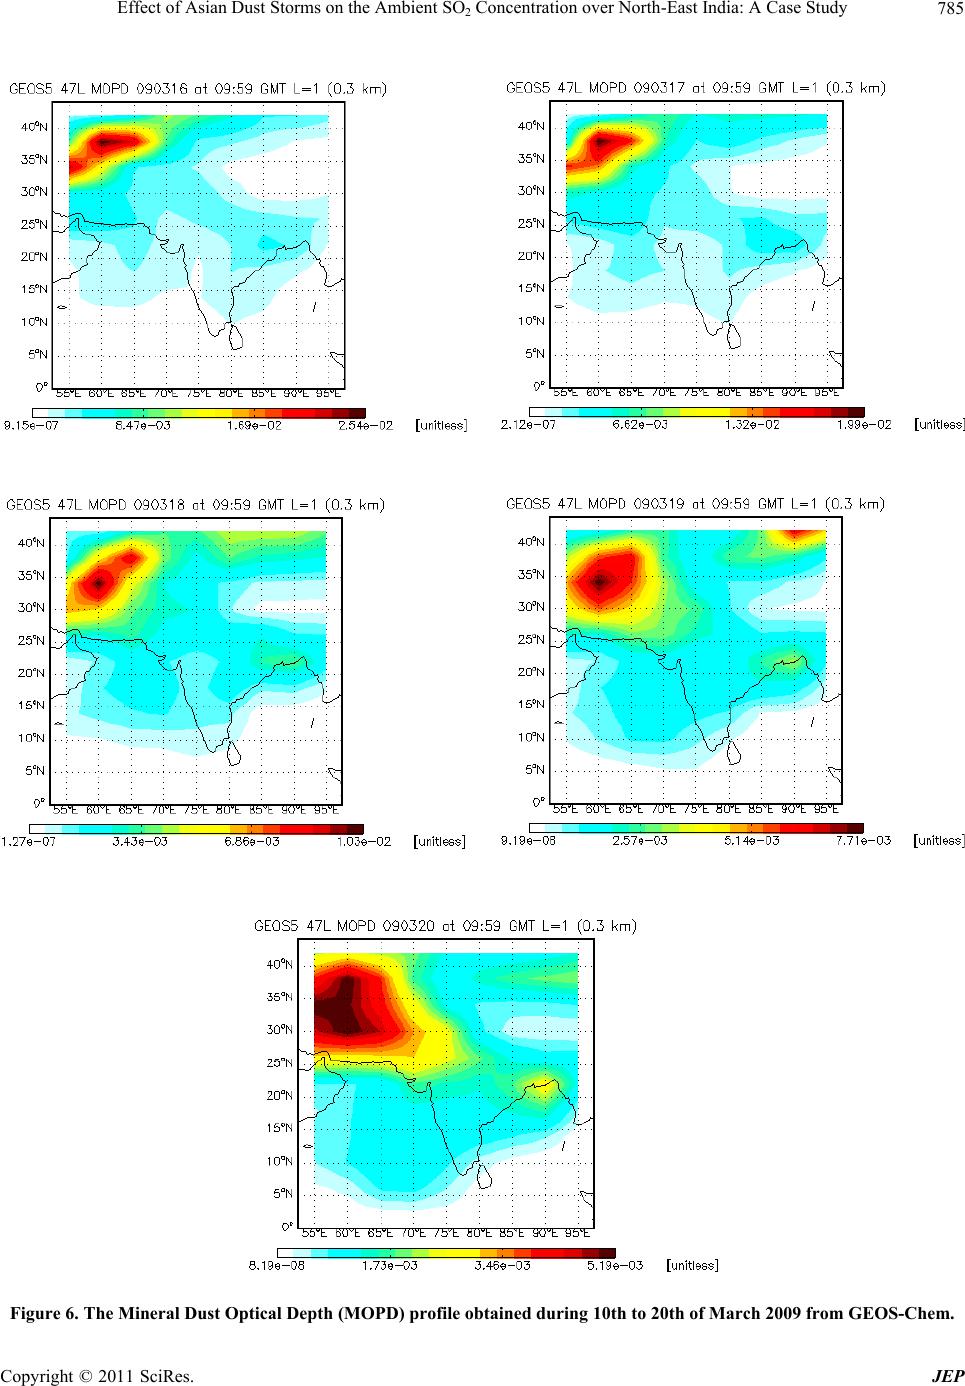 Effect of Asian Dust Storms on the Ambient SO Concentration over North-East India: A Case Study785 2 Figure 6. The Mineral Dust Optical Depth (MOPD) profile obtained during 10th to 20th of March 2009 from GEOS-Chem. Copyright © 2011 SciRes. JEP 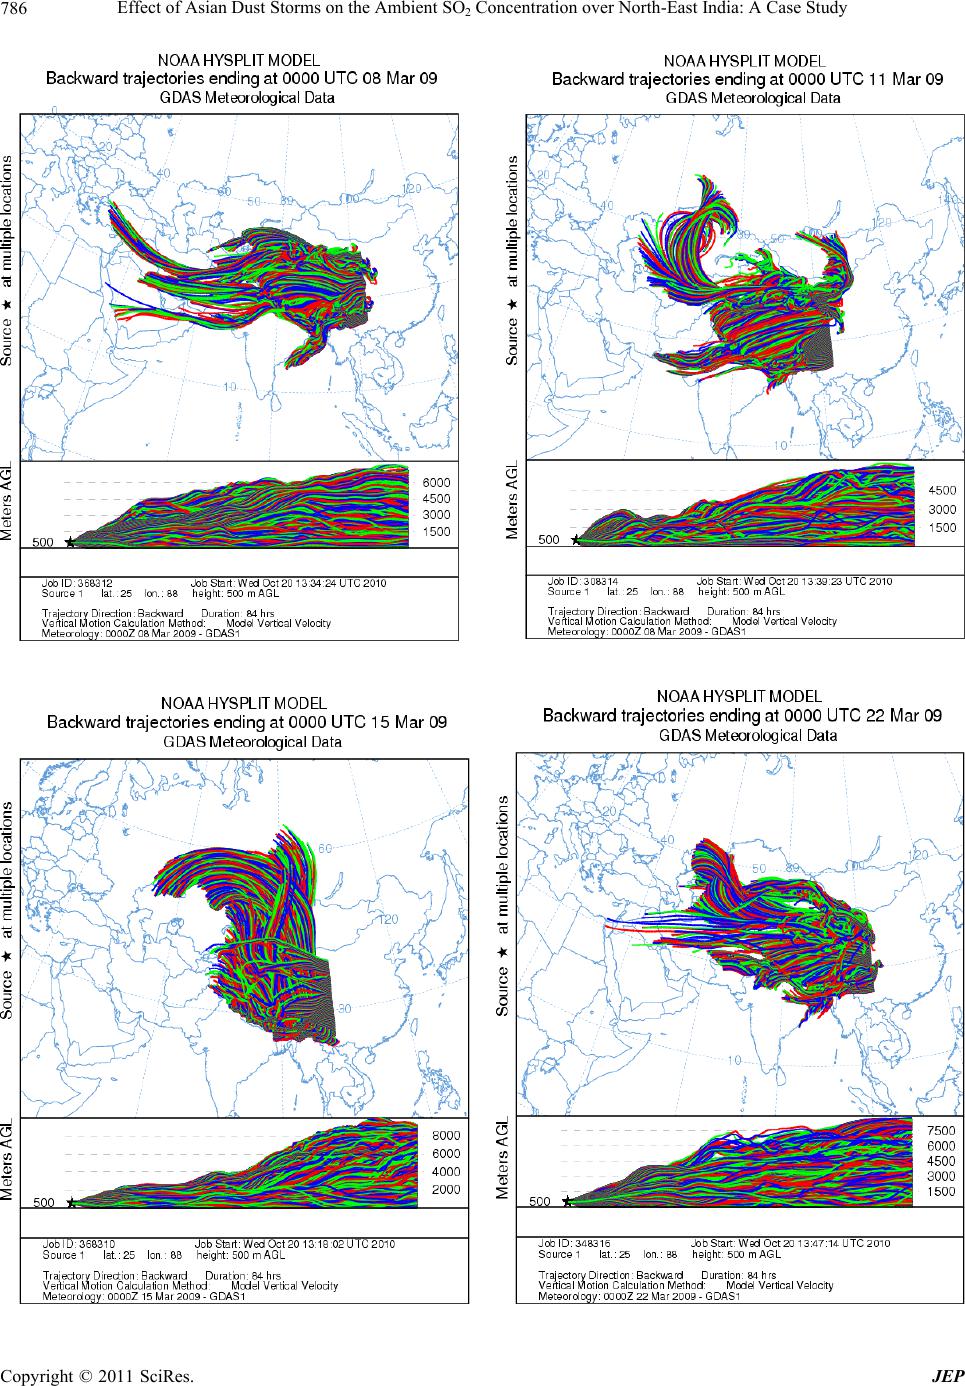 Effect of Asian Dust Storms on the Ambient SO Concentration over North-East India: A Case Study 786 2 Copyright © 2011 SciRes. JEP 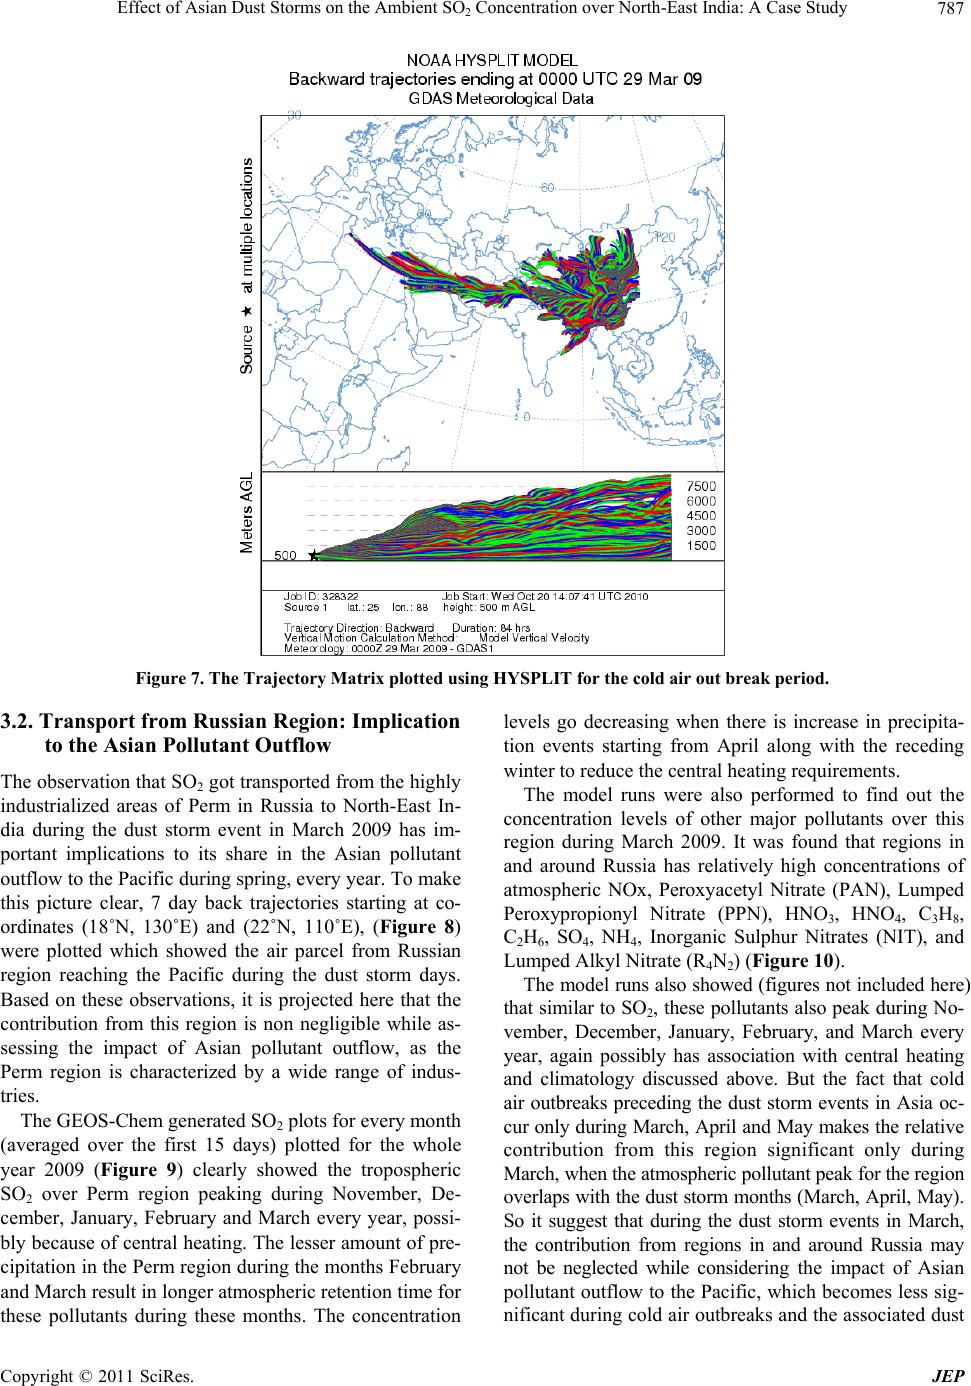 Effect of Asian Dust Storms on the Ambient SO2 Concentration over North-East India: A Case Study Copyright © 2011 SciRes. JEP 787 Figure 7. The Trajectory Matrix plotted using HYSPLIT for the cold air out break period. 3.2. Transport from Russian Region: Implication to the Asian Pollutant Outflow The observation that SO2 got transported from the highly industrialized areas of Perm in Russia to North-East In- dia during the dust storm event in March 2009 has im- portant implications to its share in the Asian pollutant outflow to the Pacific during spring, every year. To make this picture clear, 7 day back trajectories starting at co- ordinates (18˚N, 130˚E) and (22˚N, 110˚E), (Figure 8) were plotted which showed the air parcel from Russian region reaching the Pacific during the dust storm days. Based on these observations, it is projected here that the contribution from this region is non negligible while as- sessing the impact of Asian pollutant outflow, as the Perm region is characterized by a wide range of indus- tries. The GEOS-Chem generated SO2 plots for every month (averaged over the first 15 days) plotted for the whole year 2009 (Figure 9) clearly showed the tropospheric SO2 over Perm region peaking during November, De- cember, January, February and March every year, possi- bly because of central heating. The lesser amount of pre- cipitation in the Perm region during the months February and March result in longer atmospheric retention time for these pollutants during these months. The concentration levels go decreasing when there is increase in precipita- tion events starting from April along with the receding winter to reduce the central heating requirements. The model runs were also performed to find out the concentration levels of other major pollutants over this region during March 2009. It was found that regions in and around Russia has relatively high concentrations of atmospheric NOx, Peroxyacetyl Nitrate (PAN), Lumped Peroxypropionyl Nitrate (PPN), HNO3, HNO4, C3H8, C2H6, SO4, NH4, Inorganic Sulphur Nitrates (NIT), and Lumped Alkyl Nitrate (R4N2) (Figure 10). The model runs also showed (figures not included here) that similar to SO 2, these pollutants also peak during No- vember, December, January, February, and March every year, again possibly has association with central heating and climatology discussed above. But the fact that cold air outbreaks preceding the dust storm events in Asia oc- cur only during March, April and May makes th e relative contribution from this region significant only during March, when the atmospheric pollutant peak for the region overlaps with the dust storm months (March, April, May). So it suggest that during the dust storm events in March, the contribution from regions in and around Russia may not be neglected while considering the impact of Asian pollutant outflow to the Pacific, which becomes less sig- nificant during cold air outbreaks and the associated dust 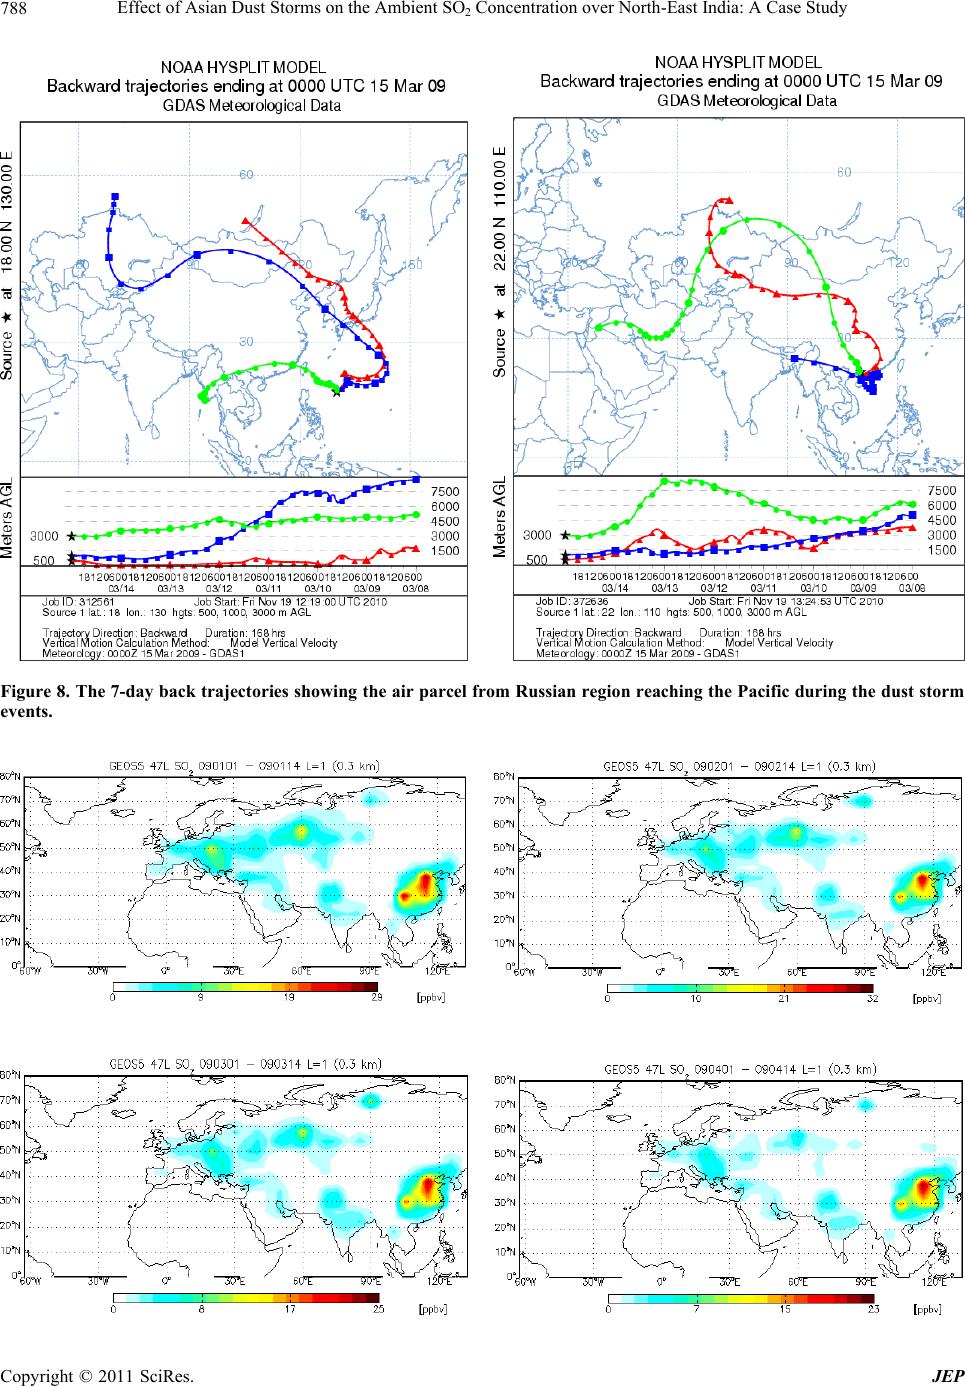 Effect of Asian Dust Storms on the Ambient SO Concentration over North-East India: A Case Study 788 2 Figure 8. The 7-day back trajectories showing the air parcel from Russian region reaching the Pacific during the dust storm events. Copyright © 2011 SciRes. JEP 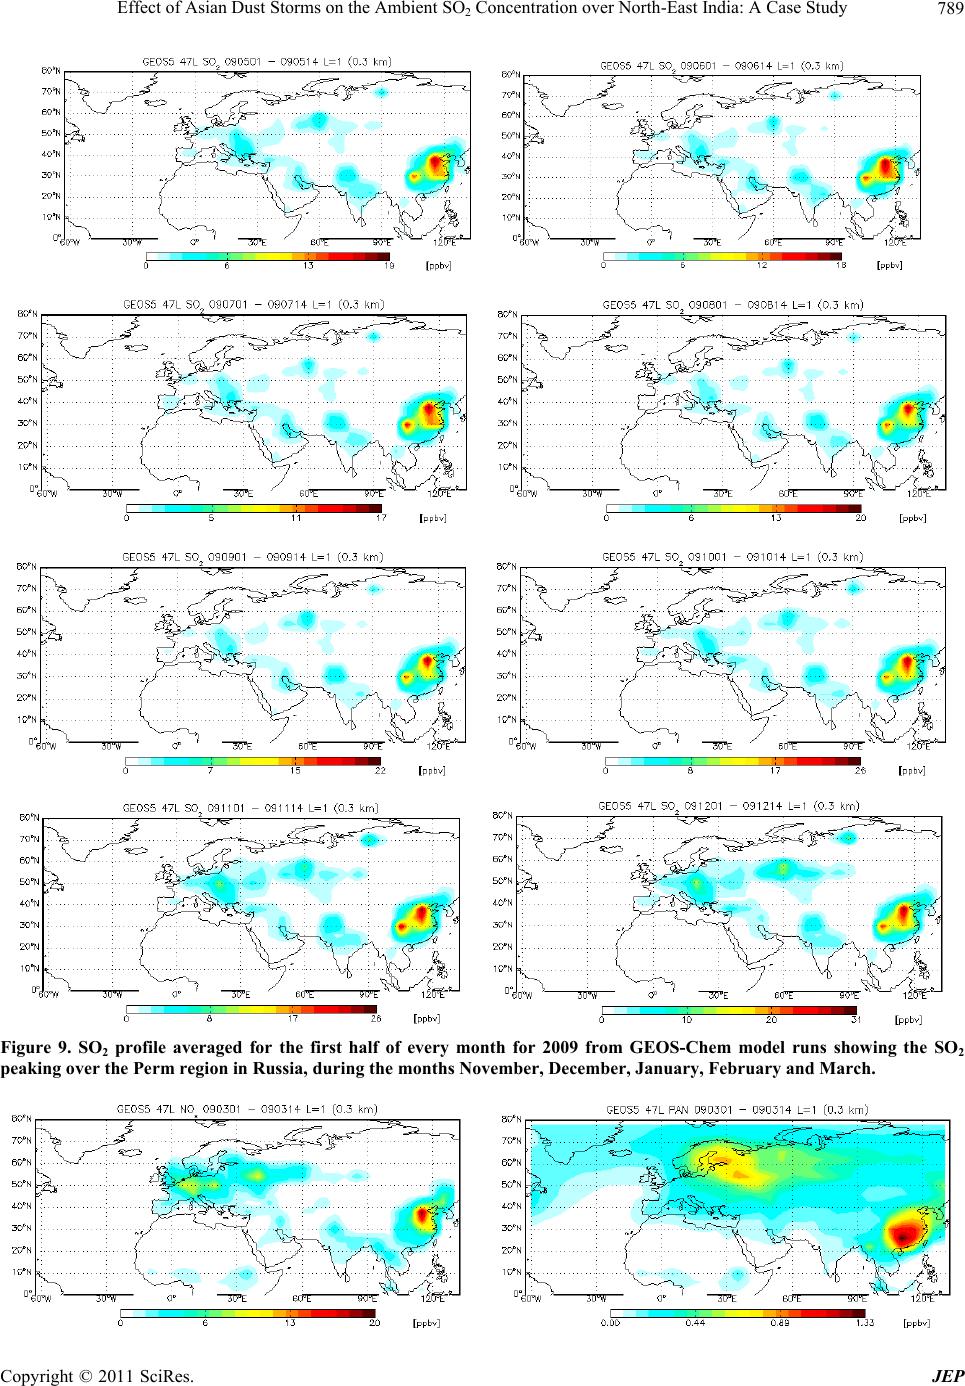 Effect of Asian Dust Storms on the Ambient SO Concentration over North-East India: A Case Study789 2 Figure 9. SO2 profile averaged for the first half of every month for 2009 from GEOS-Chem model runs showing the SO2 peaking over the Perm region in Russia, during the months November, December, January, February and March. Copyright © 2011 SciRes. JEP 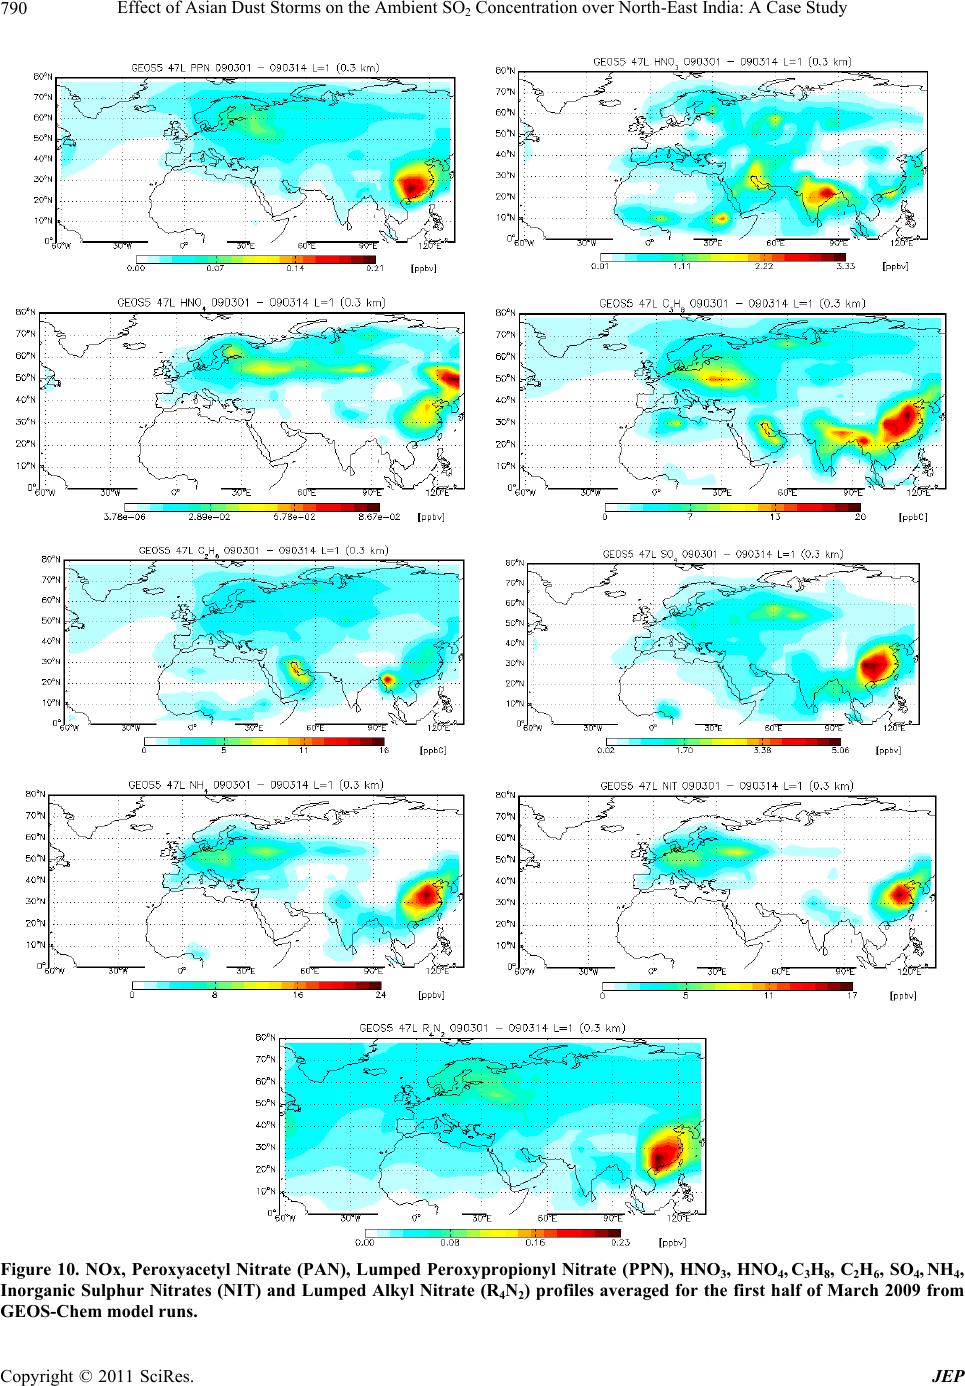 Effect of Asian Dust Storms on the Ambient SO Concentration over North-East India: A Case Study 790 2 Figure 10. NOx, Peroxyacetyl Nitrate (PAN), Lumped Peroxypropionyl Nitrate (PPN), HNO3, HNO4, C3H8, C2H6, SO4, NH4, Inorganic Sulphur Nitrates (NIT) and Lumped Alkyl Nitrate (R4N2) profiles averaged for the first half of March 2009 from GEOS-Chem model runs. Copyright © 2011 SciRes. JEP 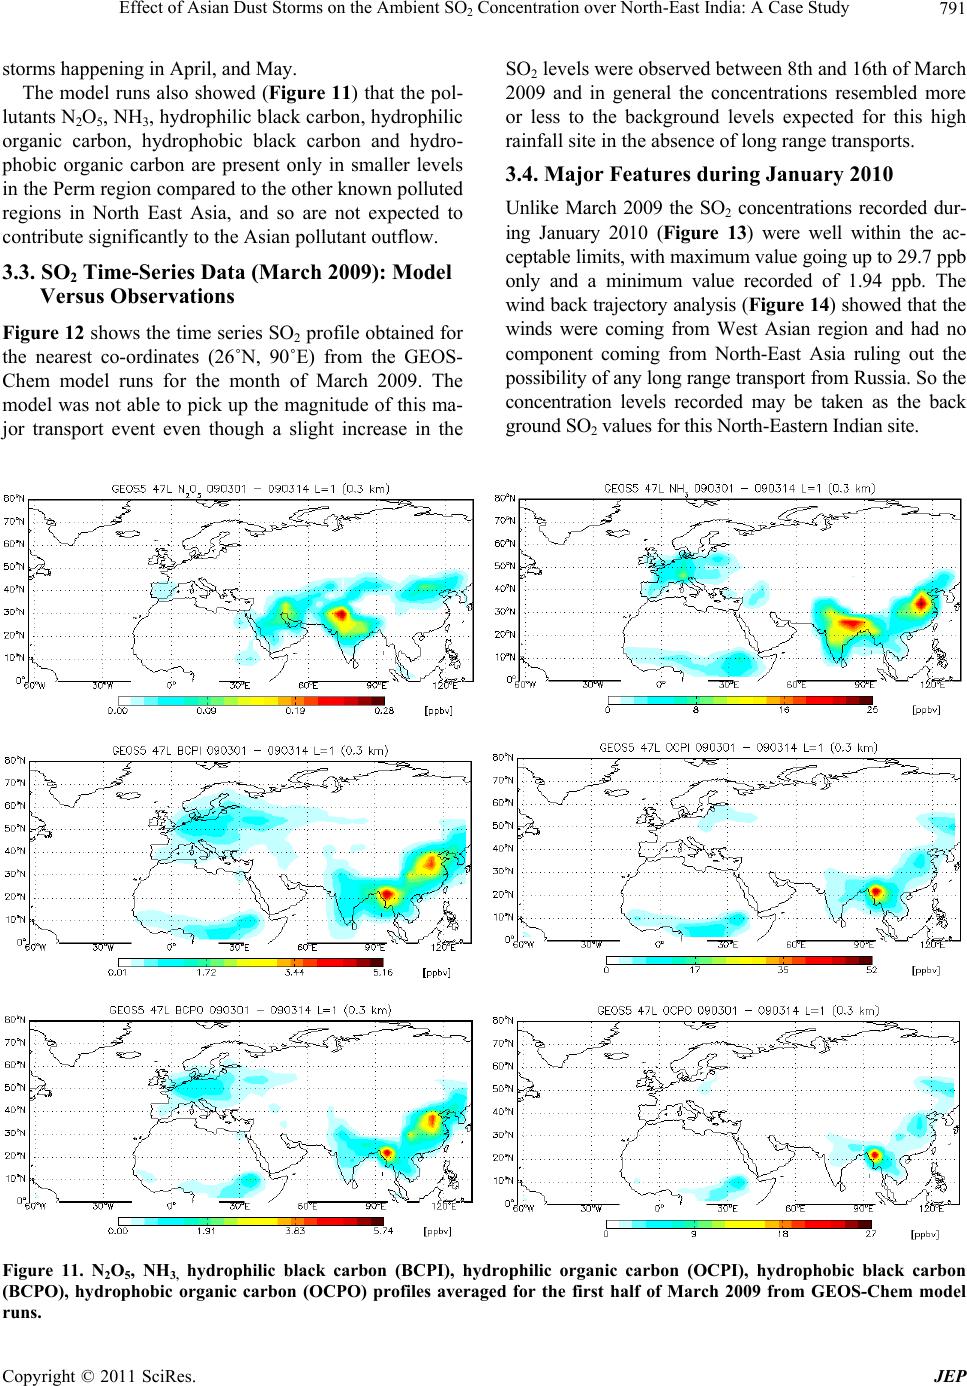 Effect of Asian Dust Storms on the Ambient SO2 Concentration over North-East India: A Case Study Copyright © 2011 SciRes. JEP 791 SO2 levels were observed between 8th and 16th of March 2009 and in general the concentrations resembled more or less to the background levels expected for this high rainfall site in the absence of long range transports. storms happenin g in April, and May. The model runs also showed (Figure 11) that the pol- lutants N2O5, NH3, hydrophilic black carbon, hydrophilic organic carbon, hydrophobic black carbon and hydro- phobic organic carbon are present only in smaller levels in the Perm region compared to the other known polluted regions in North East Asia, and so are not expected to contribute significantly to the Asian pollutant outflow. 3.4. Major Features during January 2010 Unlike March 2009 the SO2 concentrations recorded dur- ing January 2010 (Figure 13) were well within the ac- ceptable limits, with maximum value going up to 29.7 ppb only and a minimum value recorded of 1.94 ppb. The wind back trajectory analysis ( Figure 14) showed that the winds were coming from West Asian region and had no component coming from North-East Asia ruling out the possibility of any long range transport from Russia. So the concentration levels recorded may be taken as the back ground SO2 values for thi s North-Eastern Indi an site. 3.3. SO2 Time-Series Data (March 2009): Model Versus Observations Figure 12 shows the time series SO2 profile obtained for the nearest co-ordinates (26˚N, 90˚E) from the GEOS- Chem model runs for the month of March 2009. The model was not able to pick up the magnitude of this ma- jor transport event even though a slight increase in the Figure 11. N2O5, NH3, hydrophilic black carbon (BCPI), hydrophilic organic carbon (OCPI), hydrophobic black carbon (BCPO), hydrophobic organic carbon (OCPO) profiles averaged for the first half of March 2009 from GEOS-Chem model runs. 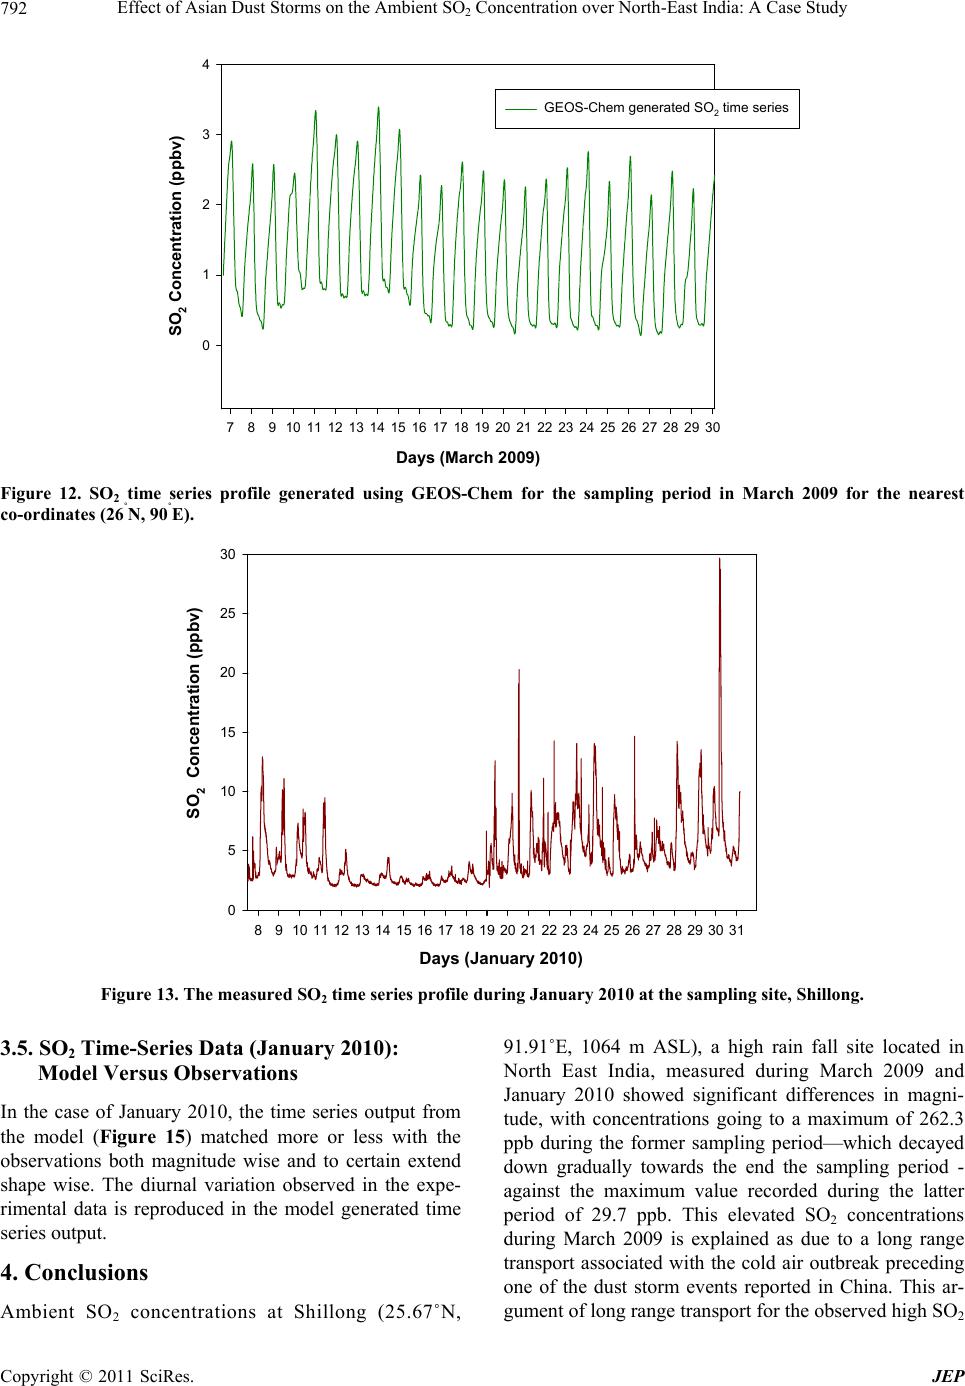 Effect of Asian Dust Storms on the Ambient SO Concentration over North-East India: A Case Study 792 2 Days (March 2009) 78910 11 12 13 1415 16 17 1819 20 2122 23 24 2526 27 2829 30 SO 2 Concentration (ppbv) 0 1 2 3 4 GEOS-Chem generated SO 2 time series Figure 12. SO2 time series profile generated using GEOS-Chem for the sampling period in March 2009 for the nearest co-ordinates (26˚N, 90˚E). Days (January 2010 ) 891011 12 13 14 15 16 17 18 19 20 21 22 23 24 25 26 27 28 29 30 31 SO 2 Concentration (ppbv) 0 5 10 15 20 25 30 Figure 13. The measure d SO2 time series profile during January 2010 at the sampling site, Shillong. 3.5. SO2 Time-Series Data (January 2010): Model Versus Observations In the case of January 2010, the time series output from the model (Figure 15) matched more or less with the observations both magnitude wise and to certain extend shape wise. The diurnal variation observed in the expe- rimental data is reproduced in the model generated time series output . 4. Conclusions Ambient SO2 concentrations at Shillong (25.67˚N, 91.91˚E, 1064 m ASL), a high rain fall site located in North East India, measured during March 2009 and January 2010 showed significant differences in magni- tude, with concentrations going to a maximum of 262.3 ppb during the former sampling period—which decayed down gradually towards the end the sampling period - against the maximum value recorded during the latter period of 29.7 ppb. This elevated SO2 concentrations during March 2009 is explained as due to a long range transport associated with the cold air outbreak preceding one of the dust storm events reported in China. This ar- ument of long range transport for the observed high SO2 g Copyright © 2011 SciRes. JEP 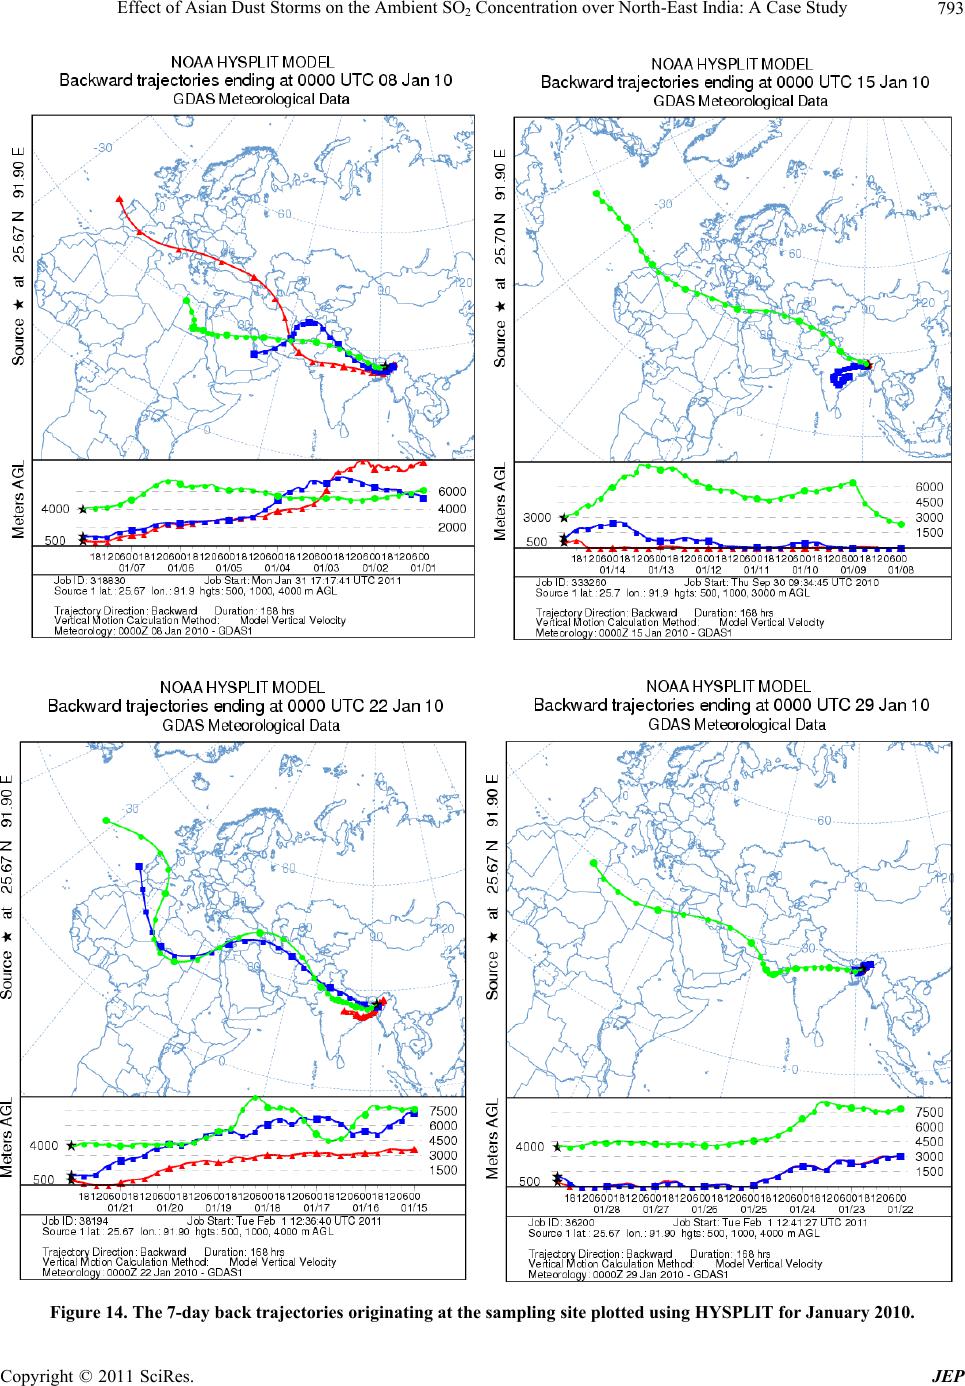 Effect of Asian Dust Storms on the Ambient SO Concentration over North-East India: A Case Study793 2 Figure 14. The 7-day back trajectories originating at the sampling site plotted using HYSPLIT for January 2010. Copyright © 2011 SciRes. JEP 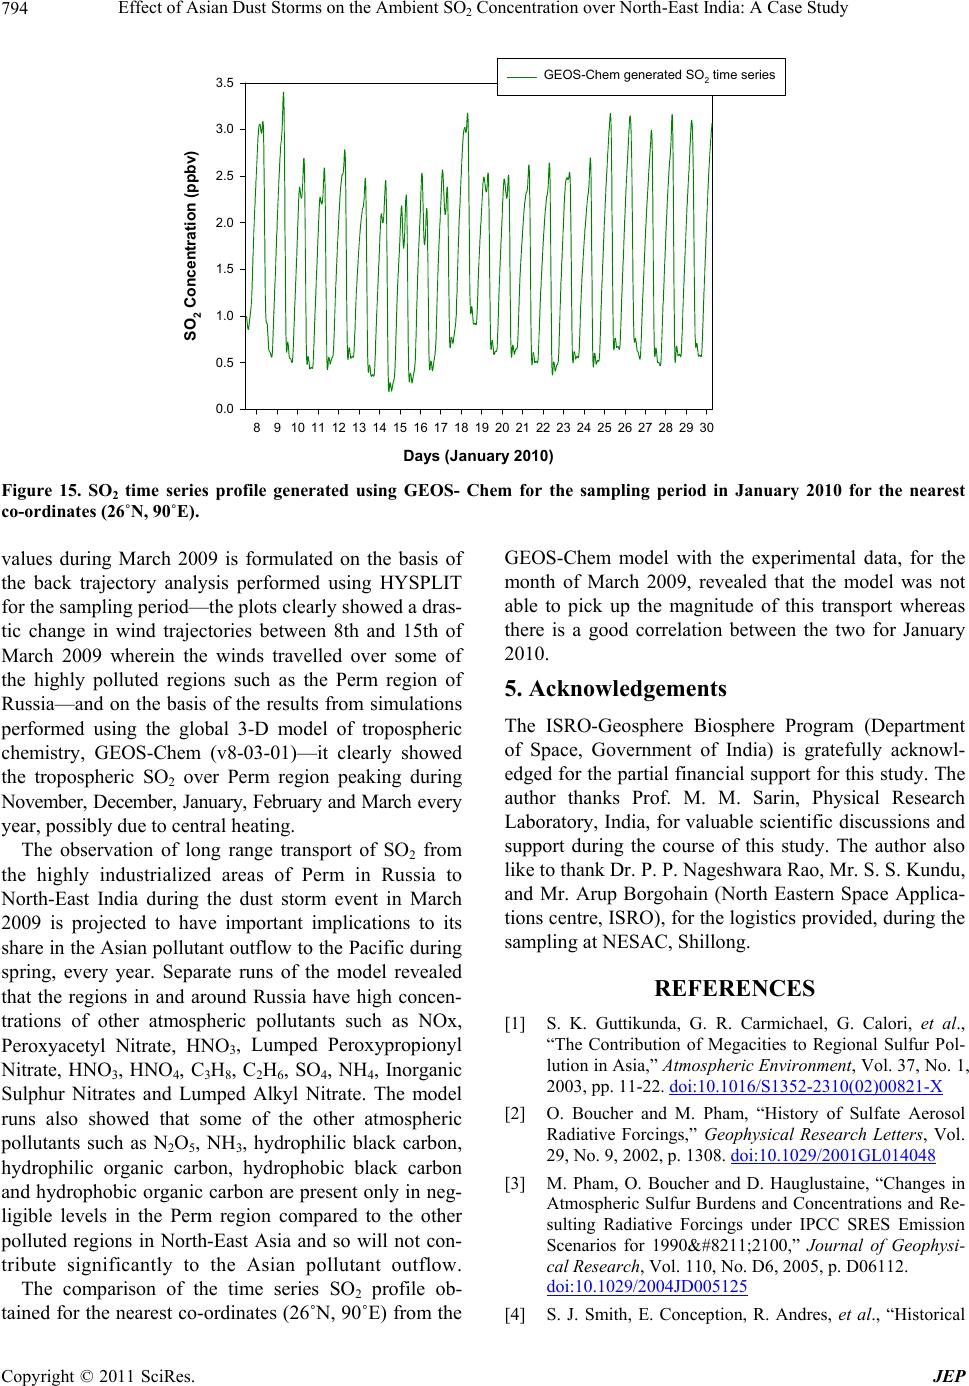 Effect of Asian Dust Storms on the Ambient SO Concentration over North-East India: A Case Study 794 2 Days (January 2010) 8910 11 12 13 14 1516 17 18 19 20 21 22 2324 25 26 27 28 2930 SO 2 Concentration (ppbv) 0.0 0.5 1.0 1.5 2.0 2.5 3.0 3.5 GEOS-Chem generated SO 2 time series Figure 15. SO2 time series profile generated using GEOS- Chem for the sampling period in January 2010 for the nearest co-ordinates (26˚N, 90˚E). values during March 2009 is formulated on the basis of the back trajectory analysis performed using HYSPLIT for the sampling period—the plots clearly showed a dras- tic change in wind trajectories between 8th and 15th of March 2009 wherein the winds travelled over some of the highly polluted regions such as the Perm region of Russia—and on the basis of the results from simulations performed using the global 3-D model of tropospheric chemistry, GEOS-Chem (v8-03-01)—it clearly showed the tropospheric SO2 over Perm region peaking during November, December, Janu ary, February and March ev er y year, possi bl y due to central heating. The observation of long range transport of SO2 from the highly industrialized areas of Perm in Russia to North-East India during the dust storm event in March 2009 is projected to have important implications to its share in the Asian pollutant outflow to the Pacific during spring, every year. Separate runs of the model revealed that the regions in and around Russia have high concen- trations of other atmospheric pollutants such as NOx, Peroxyacetyl Nitrate, HNO3, Lumped Peroxypropionyl Nitrate, HNO3, HNO4, C3H8, C2H6, SO4, NH4, Inorganic Sulphur Nitrates and Lumped Alkyl Nitrate. The model runs also showed that some of the other atmospheric pollutants such as N2O5, NH3, hydrophilic black carbon, hydrophilic organic carbon, hydrophobic black carbon and hydrophobic org anic carbon ar e present on ly in neg- ligible levels in the Perm region compared to the other polluted regions in North-East Asia and so will not con- tribute significantly to the Asian pollutant outflow. The comparison of the time series SO2 profile ob- tained for the nearest co-ordinates (26˚N, 90˚E) from the GEOS-Chem model with the experimental data, for the month of March 2009, revealed that the model was not able to pick up the magnitude of this transport whereas there is a good correlation between the two for January 2010. 5. Acknowledgements The ISRO-Geosphere Biosphere Program (Department of Space, Government of India) is gratefully acknowl- edged for the partial financial support for this study. The author thanks Prof. M. M. Sarin, Physical Research Laboratory, India, for valuable scien tific discussions and support during the course of this study. The author also like to thank Dr. P. P. Nageshwara Rao, Mr. S. S. Kundu, and Mr. Arup Borgohain (North Eastern Space Applica- tions centre, ISRO), for the logistics provided, during the sampling at NESAC, Shillong. REFERENCES [1] S. K. Guttikunda, G. R. Carmichael, G. Calori, et al., “The Contribution of Megacities to Regional Sulfur Pol- lution in Asia,” Atmospheric Environment, Vol. 37, No. 1, 2003, pp. 11-22. doi:10.1016/S1352-2310(02)00821-X [2] O. Boucher and M. Pham, “History of Sulfate Aerosol Radiative Forcings,” Geophysical Research Letters, Vol. 29, No. 9, 2002, p. 1308. doi:10.1029/2001GL014048 [3] M. Pham, O. Boucher and D. Hauglustaine, “Changes in Atmospheric Sulfur Burdens and Concentrations and Re- sulting Radiative Forcings under IPCC SRES Emission Scenarios for 1990–2100,” Journal of Geophysi- cal Research, Vol. 110, No. D6, 2005, p. D06112. doi:10.1029/2004JD005125 [4] S. J. Smith, E. Conception, R. Andres, et al., “Historical Copyright © 2011 SciRes. JEP  Effect of Asian Dust Storms on the Ambient SO Concentration over North-East India: A Case Study795 2 Sulphur Dioxide Emissions 1850-2000: Methods and Results,” Research Report, No. PNNL-14537, Pacific Northwest National Laborat ory, Richland, 2004. [5] Y. Igarashi, Y. Sawa, K. Yoshioka, et al., “Monitoring the SO2 Concentration at the Summit of Mt. Fuji and a Comparison with Other Trace Gases during Winter,” Journal of Geophysical Research, Vol. 109, No. D17, 2004, pp. 1-21. doi:10.1029/2003JD004428 [6] W. T. Luke, “Evaluation of a Commercial Pulsed Fluo- rescence Detector for the Measurement of Low-Level SO2 Concentrations during the Gas-Phase Sulfur Inter- comparison Experiment,” Journal of Geophysical Re- search, Vol. 102, No. D13, 1997, pp. 16255-16265. doi:10.1029/96JD03347 [7] M. Luria, J. F. Boatman, J. Harris, et al., “Atmospheric Sulfur Dioxide at Mauna Loa, Hawaii,” Journal of Geo- physical Research, Vol. 97, No. D5, 1992, pp. 6011- 6022. [8] R. R. Draxler and G. D. Rolph, “HYSPLIT (Hybrid Sin- gle-Particle Lagrangian Integrated Trajectory) Model,” NOAA, Air Resources Laboratory, Silver Spring, 2011. http://www.arl.noaa.gov/ready/hysplit4.html [9] G. D. Rolph, “Real-Time Environmental Applications and Display System (READY),” NOAA Air Resource Lab, Silver Spring, Md, 2003. http://www.arl.noaa.gov/ready/hysplit4.html [10] I. Bey, D. J. Jacob, R. M. Yantosca, et al., “Global Mod- eling of Tropospheric Chemistry with Assimilated Mete- orology: Model Description and Evaluation,” Journal of Geophysical Research, Vol. 106, No. D19, 2001, pp. 23073-23095. doi:10.1029/2001JD000807 [11] R. J. Park, D. J. Jacob, B. D. Field, et al., “Natural and Transboundary Pollution Influences on Sulfate-Nitrate- Ammonium Aerosols in the United States: Implications for Policy,” Journal of Geophysical Research, Vol. 109, No. D15, 2004, CiteID: D15204. [12] J. Wang, D. J. Jacob and S. T. Martin, “Sensitivity of Sulfate Direct Climate Forcing to the Hysteresis of Parti- cle Phase Transitions,” Journal of Geophysical Research, Vol. 113, No. D11, 2008, pp. D11207.1-D11207.15. [13] T. D. Fairlie, D. J. Jacob and R. J. Park, “The Impact of Transpacific Transport of Mineral Dust in the United States,” Atmospheric Environment, Vol. 41, No. 6, 2007, pp. 1251-1266. doi:10.1016/j.atmosenv.2006.09.048 [14] D. Chen, Y. Wang, M. B. McElroy, et al., “Regional CO Pollution and Export in China Simulated by the High-Resolution Nested-Grid GEOS-Chem Model,” At- mospheric Chemistry and Physics, Vol. 9, No. 11, 2009, pp. 3825-3839. [15] V. Vestreng and H. Klein, “Emission Data Reported to UNECE/EMEP. Quality Assurance and Trend Analysis and Presentation of WebDab,” MSC-W Status Report 2002, Norwegian Meteorological Institute, Oslo, 2002. [16] H. Kuhns, M. Green and V. Etyemezian, “Big Bend Re- gional Aerosol and Visibility Observational (BRAVO) study emissions inventory,” Desert Research Institute, Las Vegas, 2003. [17] J. G. J. Olivier and J. J. M. Berdowski, “Global Emis- sions Sources and Sinks, in the Climate Systemp,” Balkema Publishers/Swets & Zeitlinger Publishers, Lisse, 2001, pp. 33-78. [18] D. G. Streets, Q. Zhang, L. Wang, et al., “Revisiting China’s CO Emissions after the Transport and Chemical Evolution over the Pacific (TRACE-P) Mission: Synthe- sis of Inventories, Atmospheric Modeling, and Observa- tions,” Journal of Geophysical Research, Vol. 111, No. D14, 2006, Cite ID: D14306. [19] A. Guenther, T. Karl, P. Harley, et al., “Estimates of Global Terrestrial Isoprene Emissions Using MEGAN (Model of Emissions of Gases and Aerosols from Na- ture),” Atmospheric Chemistry and Physics, Vol. 6, No. 11, 2006, pp. 3181-3210. doi:10.5194/acp-6-3181-2006 [20] X. Li, and W. Song, “Dust Storm Detection Based on Modis Data,” International Archives of Photogrammetry, Remote Sensing and Spatial Information Sciences, Liaoning Technology University, Shengyang, pp. 169- 172. [21] A. R. Sharma, S. K. Kharol and K. V. S. Badarinath, “An Unusual Dust Event over North-Eastern India and Its Association with Extreme Climatic Conditions—A Study Using Satellite Data,” Aerosols & Clouds: Climate Change Perspectives, ISATA Bulletin, 2000, pp. 214- 217. [22] T. S. Liu, “Loess and the Environment,” China Ocean, Beijing, 1985, pp. 251. [23] J. Sun, M. Zhang and T. Liu, “Spatial and Temporal Characteristics of Dust Storms in China and its Sur- rounding Regions, 1960-1999: Relations to Source Area and Climate,” Journal of Geophysical Research, Vol. 106, No. D10, 2001, pp. 10325-10333. doi:10.1029/2000JD900665 Copyright © 2011 SciRes. JEP
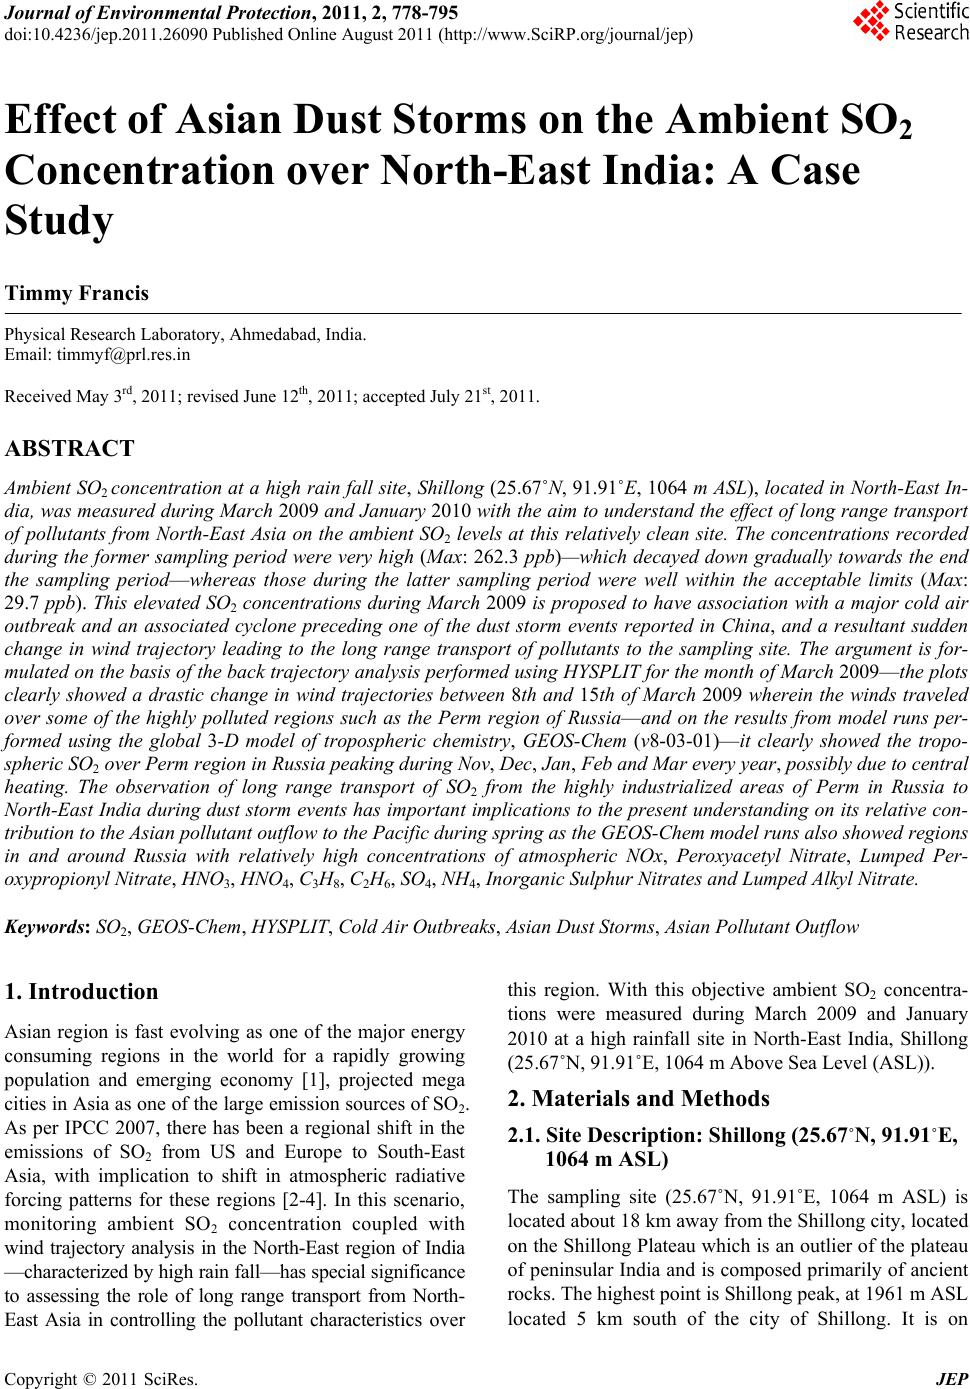
|