World Journal of Engineering and Technology
Vol.04 No.03(2016), Article ID:70713,8 pages
10.4236/wjet.2016.43C004
Numerical Tools Dedicated to Wind Engineering in Large Urban Area
Li Wang1, Sophie Puygrenier2, Guillaume Caniot2, Stéphane Sanquer2, Didier Delaunay2
1Meteodyn Meteorology and Dynamics Technology, Beijing, China
2Meteodyn, Nantes, France


Received: June 16, 2016; Accepted: September 19, 2016; Published: September 22, 2016
ABSTRACT
This paper presents a global methodology to compute wind flow in complex urban areas in order to assess wind pedestrian comfort, wind energy, wind safety or natural ventilation potential. The numerical tool presented here is composed of a CFD software suite covering both regional scale (20 km) and urban scale (1km), and able to model the wind in any complex terrains and in large urban environments. Examples are presented in the paper in order to show the advantages of the methodology for urban designers.
Keywords:
Wind Engineering, Urban Area, Wind Design, Wind Safety, Comfort, Sustainable Development

1. Introduction
From an urban designer point of view, the knowledge of the urban climatology and especially the wind flow around buildings is crucial in many applications such as:
・ Wind characteristics for the design of buildings and structures;
・ Wind comfort in outdoor spaces and in opened indoor spaces exposed to wind;
・ Wind safety of pedestrian and urban transportation system (tramway, shuttles, cable car…);
・ Wind energy production from small wind turbines;
・ Air quality and thermal behavior inside buildings (depending on wind pressure on façades).
Usually the reference meteorological data are available at an open area and cannot be used transferred easily to urban locations. Buildings generate strong modifications of the wind flow by creating shear, vortices with flow separation, speed-up with Venturi effects… In that context, numerical approach becomes a realistic solution at the condition that validations are carried out.
A lot of publications show that Computational Fluid Dynamics (CFD) tools, when dedicated to wind flow inside built environment, allow an exhaustive interpretation of wind flows: Estimation of extreme wind speeds for wind design, assessment of stability of crane, optimization of the master plan according to pedestrians wind comfort [1]- [3], natural ventilation [4] and small energy production [5].
In this paper, a whole methodology is presented based on a suite of commercial software (TopoWind and UrbaWind), allowing computation of wind flow at high resolution in an urban environment. Some examples of applications to wind safety, outdoor climatic comfort, energy saving are shown. This methodology is designed for operational applications, i.e. a compromise between automaticity, computation time, efficiency and required accuracy has been systematically looked for.
2. Technical Background
We take the example of the city of Barcelona. The developed methodology consists in two main steps:
・ Transferring wind data from a weather station to a 200 m high area over the urban area. We use the CFD software Topowind [6] which through Navier-Stokes equations resolution (multigrid coupled MIGAL-S solver for structured grid) using a k-L turbulence model, evaluate the effect of orography and terrain roughness on the flow. A horizontal resolution of 25 m, leads to a numerical grid of about 20 M cells for a computational time of 5 h per wind direction (18 sectors of 20 deg width). A mapping of the resulting wind speed coefficients for one synoptic wind direction is shown in Figure 1. The obtained wind characteristics over the city are used as the input for the subsequent micro-scale downscaling computation.
・ The wind flow inside the urban canopy is computed with UrbaWind software [7], which considers the real geometry of each individual building. The urban development agency of Barcelona has provided the entire numerical model of the 640 km² urban area (Figure 2). UrbaWind solves the Navier-Stokes equations with a one- equation turbulence model. The finite-volume numerical resolution is based on a very efficient coupled multi-grid solver (MIGAL-UNS) for rectangular multi-bloc unstructured grid. The turbulent length scale LT varies linearly with the distance to the nearest wall. The calibration of the length scale law has been made by comparison with a number of wind tunnel experiments. Boundary conditions are automatically generated. The vertical profile of the mean wind speed at the inlet is taken as a logarithmic profile within the surface layer; and the Ekman layer wind profile up to the top of the Atmospheric Boundary Layer.
One single simulation of the entire area of Barcelona city entails 1.7 TB of RAM. The area is divided then into 138 sub-areas of 2.5 km × 2.5 km each. An overlapping area of 450 m is added to each border to ensure better wind characteristics thanks to the extra
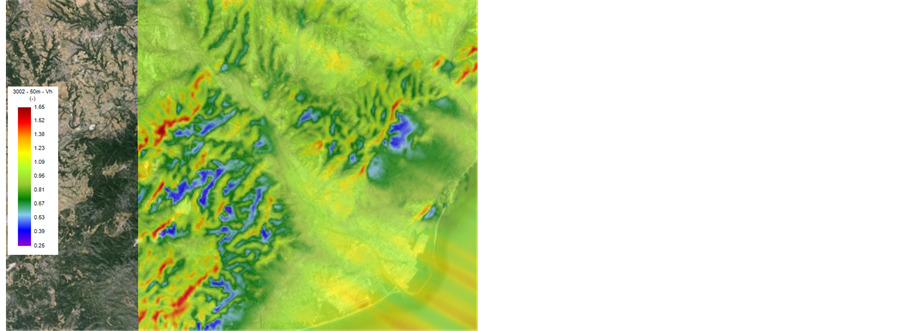
Figure 1. Wind speed coefficient mapping for direction 300 deg (City of Barcelona).
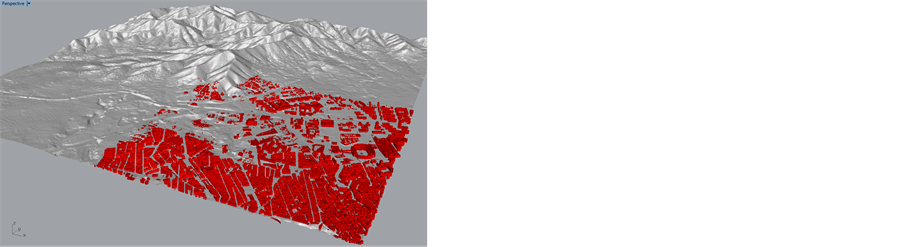
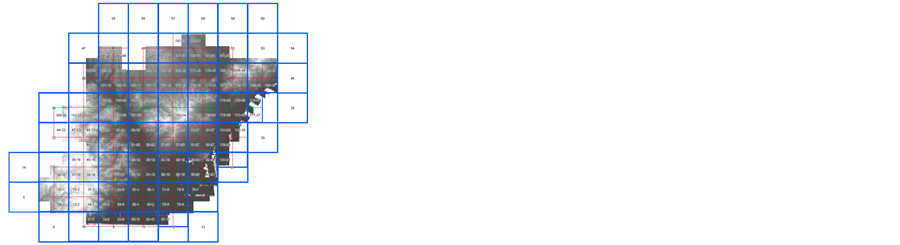
Figure 2. Sample of buildings and topography (source: Barcelona Regional).
roughness on the ground. Thus each computed sub-area has a 3.4 × 3.4 km2 surface. The mesh resolution is about 1 m around the buildings and close to the ground leads to a 10 Million cells grid. Figure 3 shows the result for the average wind speed at 20 m height.
3. Applications
3.1. Wind Design and Stability of Structures
Building and structures are generally designed according to a reference wind speed, corresponding to a 50-yr return period (“extreme wind speed”), and with an associated turbulence intensity for estimating the maximal gust applied to the structure. National construction codes give the reference 50-yr wind speed at 10 m height agl for an open and flat terrain. For real conditions (height, roughness), some simple formulations are proposed. However they are not applicable to complex topography terrain and neither inside the urban boundary layer. Then, the above procedure is proposed to get the real 50-yr wind speed and associated turbulence in each direction. This approach has been validated with comparison with the Eurocode [8].
When applied to moving structures, like cranes, a simple mechanical model can be added to evaluate the risk of instability (self-rotating) following a procedure previously applied in wind tunnel on crane models [9]. The computations of the crane dynamics (auto-rotation, misalignment…) have been validated with such wind-tunnel experiments (Figure 4).
3.2. Pedestrian Comfort and Safety in Outdoor Spaces
The wind comfort is expressed in terms of frequency of wind speeds threshold exceedance. The CSTB criterion [10] considers the frequency of the “gust speed” exceeding 3.6 m/s, defined as the sum of the 10 min mean wind speed and its standard deviation. An area is considered as “uncomfortable” if the threshold is exceeded with a frequency of 5% for a steady position, 10% for a walking pedestrian, and 20% for a brisk walking.
Figure 5 shows an example of wind comfort map in an urban renovation area in Paris (Ile Seguin): The 0.12 km2 area includes 29,400 m2 of terrace and 12,000 m2 of park. The wind comfort is critical in those pedestrian area where the closest building on the opposite river bank is located from 60 m to 100 m to Seguin Island. Several wind accelerations responsible for wind discomfort have been observed: Border effect at point 1 and Venturi effect at points 2 and 3. Local treatments such as vegetation or fence can prevent such strong acceleration and lead to enhance the wind comfort.

Figure 3. Yearly average mean speed of Barcelona at 20 m agl (source: Barcelona Regional).
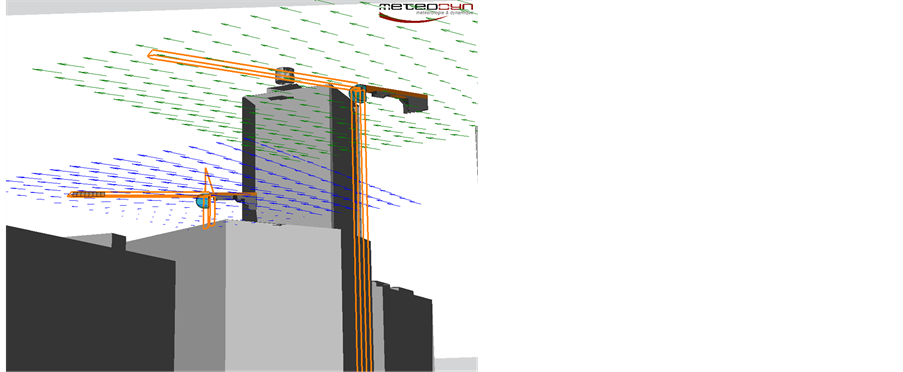
Figure 4. Simulation of crane dynamics submitted to urban wind field.
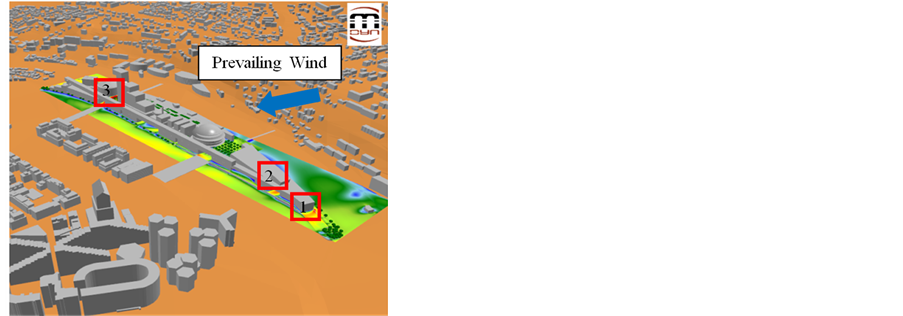
Figure 5. Pedestrian wind comfort assessment on Seguin Island in Paris.
3.3. Wind Safety for Transportation System
Tramways, shuttles, trains, high-sided lorries can be at risk of a wind-induced accident on exposed sites such as embankment, or long span bridges. Wind alarm procedures, based on a scientific probabilistic approach, are currently used in the railway transportation, for instance for the TGV lines in France. In road transportation, while a number of bridges have adopted vehicle restriction measures, new rules were defined in order to reduce the degree of arbitrariness throw the WEATHER project “Wind Early Alarm system for Terrestrial transportation, Handling the Evaluation of Risks” [11]. The base of the methodology is to define the statistics of the wind at each point along the track in order to assess the frequency or occurrence of high winds that exceed a safety threshold. The threshold was defined previously for every vehicle. Hereafter, the Figure 6 shows an example of wind statistics computed with the CFD suite for tramway network in Barcelona in order to assess the risk and to design wind alarm system if relevant.
3.4. Wind Energy Production from Small Wind Turbines
Built environment is characterized by high turbulence intensity and low mean wind speed. Then a wrong siting of small wind turbines could lead to turbine failure. In the example of Barcelona city, the objective of computations was to detect better locations to install small wind turbines. Mean annual wind Speed, potential production and turbulence intensity have been computed at 10 m, 20 m, 30 m, 40 m and 50 m height with a horizontal resolution of 10 m (Figure 7).
3.5. Natural Ventilation (“Green Buildings”)
The example is located at the Reunion Island where trade winds are moderate on the North side of the island. Even in urban areas the average velocity is close to 2 m/s at 10 m above the ground and the buildings may be naturally ventilated. Moreau and Gandemer [12] gave some recommendations to assess the potential of natural ventilation in tropical warm climates. Guidelines are based on the pressure coefficient differential ΔCp between upwind and downwind sides of a building.
Some ΔCp mappings are shown at Figure 8 for the main wind direction. The buildings layout may be optimized in order to allow enough pressure on walls for each volume. Porosity of façades was defined according to the variability of ACH. Computed thermal loads depend on the location of the volume in the building (ground, middle, top) and on the location of the building in the master plan (exposed, protected, shaded

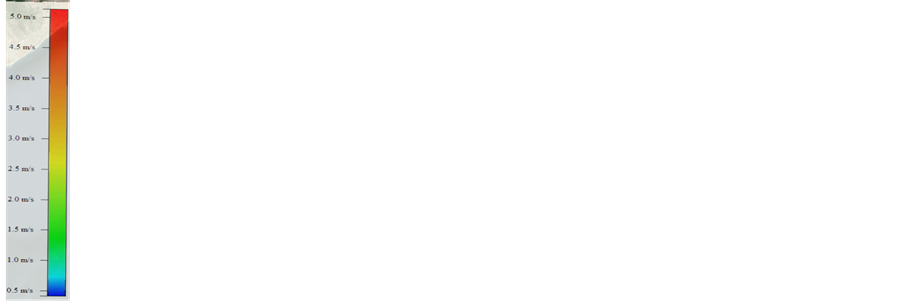
Figure 6. Wind mapping along the rail track (City of Barcelona).
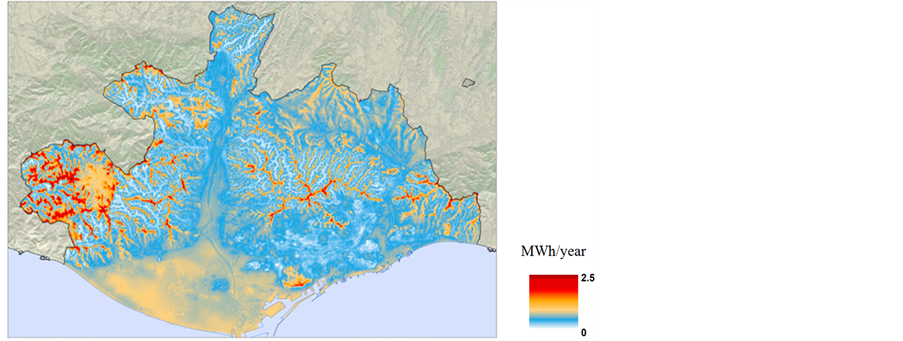
Figure 7. Mean annual energy production Atlas at 20 m high (City of Barcelona).
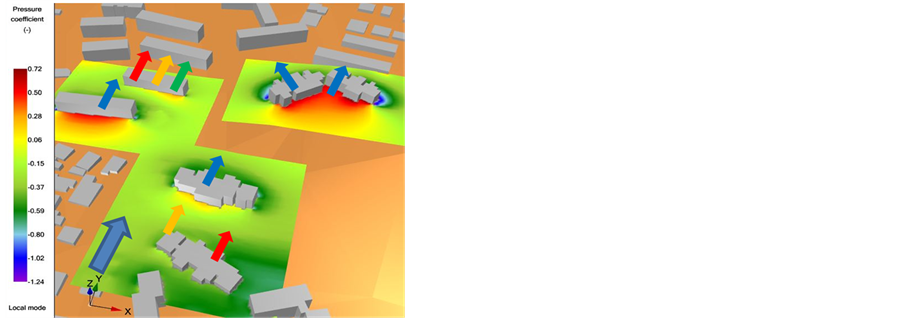
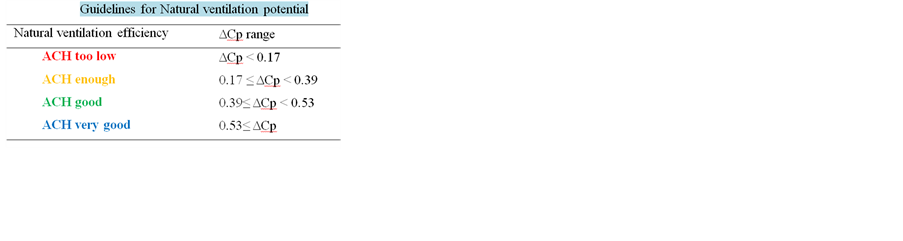
Figure 8. Pressure field mapping to assess the potential of natural ventilation (La Réunion Island).
by nearby buildings). Thermal design was carried out according to the simple methodology Batipei commonly used in such tropical overseas territories (Sanquer et al. [13]).
4. Conclusion
The recent progress in numerical methods and wind analysis give now the possibility of evaluating the statistical properties of the wind (mean wind speed and direction, turbulent fluctuations) in very complex sites, like built environment. The procedure presented is a combination of CFD modelling at two different scales in order to transfer the wind characteristics as they are measured at weather stations to the real wind at the urban site, with a resolution better than 1 m, as requested for some applications. Such tools are now available and can be used easily in civil engineering for a very large spectrum of applications.
Cite this paper
Wang, L., Puy- grenier, S., Caniot, G., Sanquer, S. and Delaunay, D. (2016) Numerical Tools Dedicated to Wind Engineering in Large Urban Area. World Journal of Engineering and Te- chnology, 4, 22-29. http://dx.doi.org/10.4236/wjet.2016.43C004
References
- 1. Janssen, W., Blocken, B. and Hooff, T.V. (2013) Use of CFD Simulations to Improve the Pedestrian Wind Comfort around a High-Rise Building in a Complex Urban Area. 13th Conference of International Building Performance Simulation Association, Chambéry, 1918-1925.
- 2. Fadl, M.S. and Karadelis, J. (2013) CFD Simulation for Wind Comfort and Safety in Urban Area: A Case Study of Coventry University Central Campus. International Journal of Architecture, Engineering and Construction, 2, 131-143.
- 3. Szücs, A. (2013) Wind Comfort in a Public Urban Space—Case Study within Dublin Docklands. Frontiers of architectural Research, 2, 50-66.
- 4. Sanquer, S., Caniot, G. and Bandhare, S. (2015) Wind Assessment in Urban Area with CFD Tools: Application to Natural Ventilation Potential and Outdoor Pedestrian Comfort. Building Simulation Conference 2015 (IBPSA), Hyderabad.
- 5. Caniot, G., Bullido García, M., Sanquer, S., Naya, S. and Emili del Pozo, E. (2015), Wind Resource Assessment of the Metropolitan Area of Barcelona. Smart GCS 2015, Toron-to.
- 6. Delaunay, D., Chantelot, A., Guyader, T. and Alexandre, P. (2004) Meteodyn WT: An Automatic CFD Software for Wind Resource Assessment in Complex Terrain. EWEC 2004 Wind Energy Conference, London.
- 7. Caniot, G., Wang, L. and Dupont, G. (2011) Valida-tions and Applications of a CFD Tool Dedicated to Wind Assessment in Urban Areas. 13th International Conference on Wind Engineering, Amsterdam, July 2011.
- 8. Delaunay, D., Di, L. and Bodéré, S. (2011) Calibrating a CFD Canopy Model with the EC1 Vertical Profiles of Mean Wind Speed and Turbulence. 13 International Conference on Wind Engineering, Amsterdam, July 2011.
- 9. Berthaut, J. and Barré, C. (2011) Aerodynamic Sensitivity of Out-of-Service Tower Cranes. 13th International Conference on Wind Engineering, Amsterdam, July 2011.
- 10. Delpech, P., Baker, C.J., Blackmore, P.A., Koss, H., Sanz-Andres, A., Stathopoulos, T. and Willemsen, E. (2005) Pedestrian Wind Comfort Assessment Criteria: A Comparative Case Study. 4th European & African Conference on Wind Engineering, 11-15 July 2005, Prague.
- 11. Delaunay, D., Baker, C.J., Cheli, F., Morvan, H., Berger, L., Casazza, M., Gomez, C., Le Cleac’h, C., Saffell, R. and Grégoire, R. (2006) Development of Wind Alarm Systems for Road and Rail Vehicles: Presentation of the WEATHER Project. XIII International Road Weather Conference, 25th-27th March 2006, Turin.
- 12. Moreau, S. and Gandemer, J. (2002) Guide sur la climatisation naturelle de l’habitat en climat tropical humide. Tome III Principes aérodynamiques de la ventilation naturelle dans l’habitat tropical collectif—CSTB.
- 13. Sanquer, S., Abdesselam, M. and Picgirard, F. (2011) Combined CFD-Mean Energy Balance Method to Thermal Comfort Assessment of Buildings in a Warm Tropical Climate. Buildings Simulation 2011, Sydney.