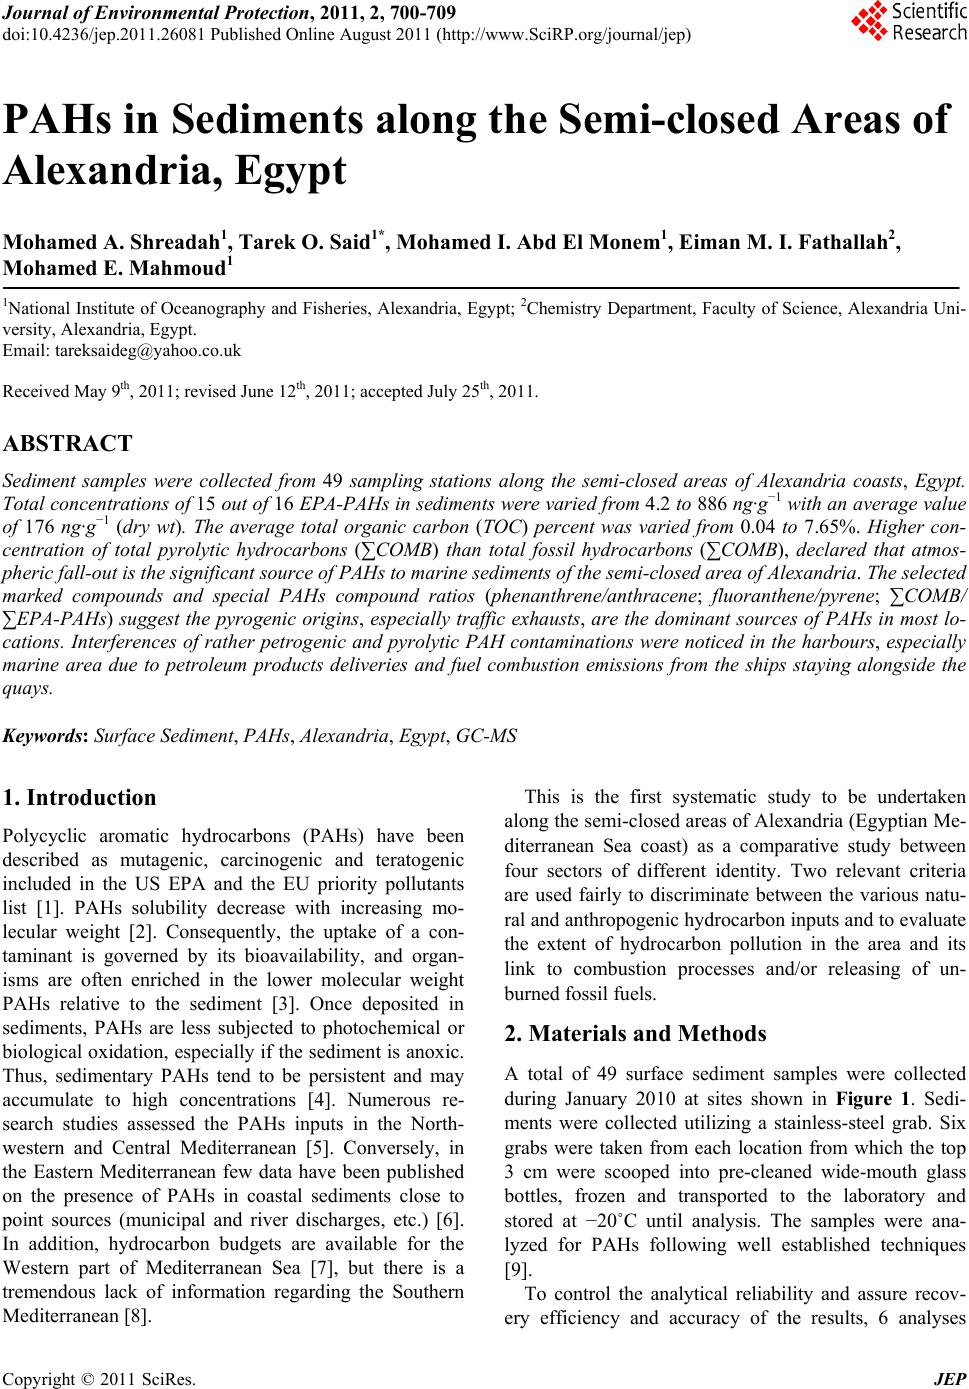
 Journal of Environmental Protection, 2011, 2, 700-709 doi:10.4236/jep.2011.26081 Published Online August 2011 (http://www.SciRP.org/journal/jep) Copyright © 2011 SciRes. JEP PAHs in Sediments along the Semi-closed Areas of Alexandria, Egypt Mohamed A. Shreadah1, Tarek O. Said1*, Mohamed I. Abd El Monem1, Eiman M. I. Fathallah2, Mohamed E. Mahmoud1 1National Institute of Oceanography and Fisheries, Alexandria, Egypt; 2Chemistry Department, Faculty of Science, Alexandria Uni- versity, Alexandria, Egypt. Email: tareksaideg@yahoo.co.uk Received May 9th, 2011; revised June 12th, 2011; accepted July 25th, 2011. ABSTRACT Sediment samples were collected from 49 sampling stations along the semi-closed areas of Alexandria coasts, Egypt. Total concentrations of 15 out of 16 EPA-PAHs in sediments were varied from 4.2 to 886 ng·g−1 with an average value of 176 ng·g−1 (dry wt). The average total organic carbon (TOC) percent was varied from 0.04 to 7.65%. Higher con- centration of total pyrolytic hydrocarbons (∑COMB) than total fossil hydrocarbons (∑COMB), declared that atmos- pheric fall-out is the significant source of PAHs to marine sediments of the semi-closed area of Alexandria. The selected marked compounds and special PAHs compound ratios (phenanthrene/anthracene; fluoranthene/pyrene; ∑COMB/ ∑EPA-PAHs) suggest the pyrogenic origins, especially traffic exhausts, are the dominant sources of PAHs in most lo- cations. Interferences of rather petrogenic and pyrolytic PAH contaminations were noticed in the harbours, especially marine area due to petroleum products deliveries and fuel combustion emissions from the ships staying alongside the quays. Keywords: Surface Sediment, PAHs, Alexandria, Egypt, GC-MS 1. Introduction Polycyclic aromatic hydrocarbons (PAHs) have been described as mutagenic, carcinogenic and teratogenic included in the US EPA and the EU priority pollutants list [1]. PAHs solubility decrease with increasing mo- lecular weight [2]. Consequently, the uptake of a con- taminant is governed by its bioavailability, and organ- isms are often enriched in the lower molecular weight PAHs relative to the sediment [3]. Once deposited in sediments, PAHs are less subjected to photochemical or biological oxidation, especially if the sediment is anoxic. Thus, sedimentary PAHs tend to be persistent and may accumulate to high concentrations [4]. Numerous re- search studies assessed the PAHs inputs in the North- western and Central Mediterranean [5]. Conversely, in the Eastern Mediterranean few data have been published on the presence of PAHs in coastal sediments close to point sources (municipal and river discharges, etc.) [6]. In addition, hydrocarbon budgets are available for the Western part of Mediterranean Sea [7], but there is a tremendous lack of information regarding the Southern Mediterranean [8]. This is the first systematic study to be undertaken along the semi-closed areas of Alexandria (Egyptian Me- diterranean Sea coast) as a comparative study between four sectors of different identity. Two relevant criteria are used fairly to discriminate between the various natu- ral and anthropogenic hydrocarbon inputs and to evaluate the extent of hydrocarbon pollution in the area and its link to combustion processes and/or releasing of un- burned fossil fuels. 2. Materials and Methods A total of 49 surface sediment samples were collected during January 2010 at sites shown in Figure 1. Sedi- ments were collected utilizing a stainless-steel grab. Six grabs were taken from each location from which the top 3 cm were scooped into pre-cleaned wide-mouth glass bottles, frozen and transported to the laboratory and stored at −20˚C until analysis. The samples were ana- lyzed for PAHs following well established techniques [9]. To control the analytical reliability and assure recov- ery efficiency and accuracy of the results, 6 analyses 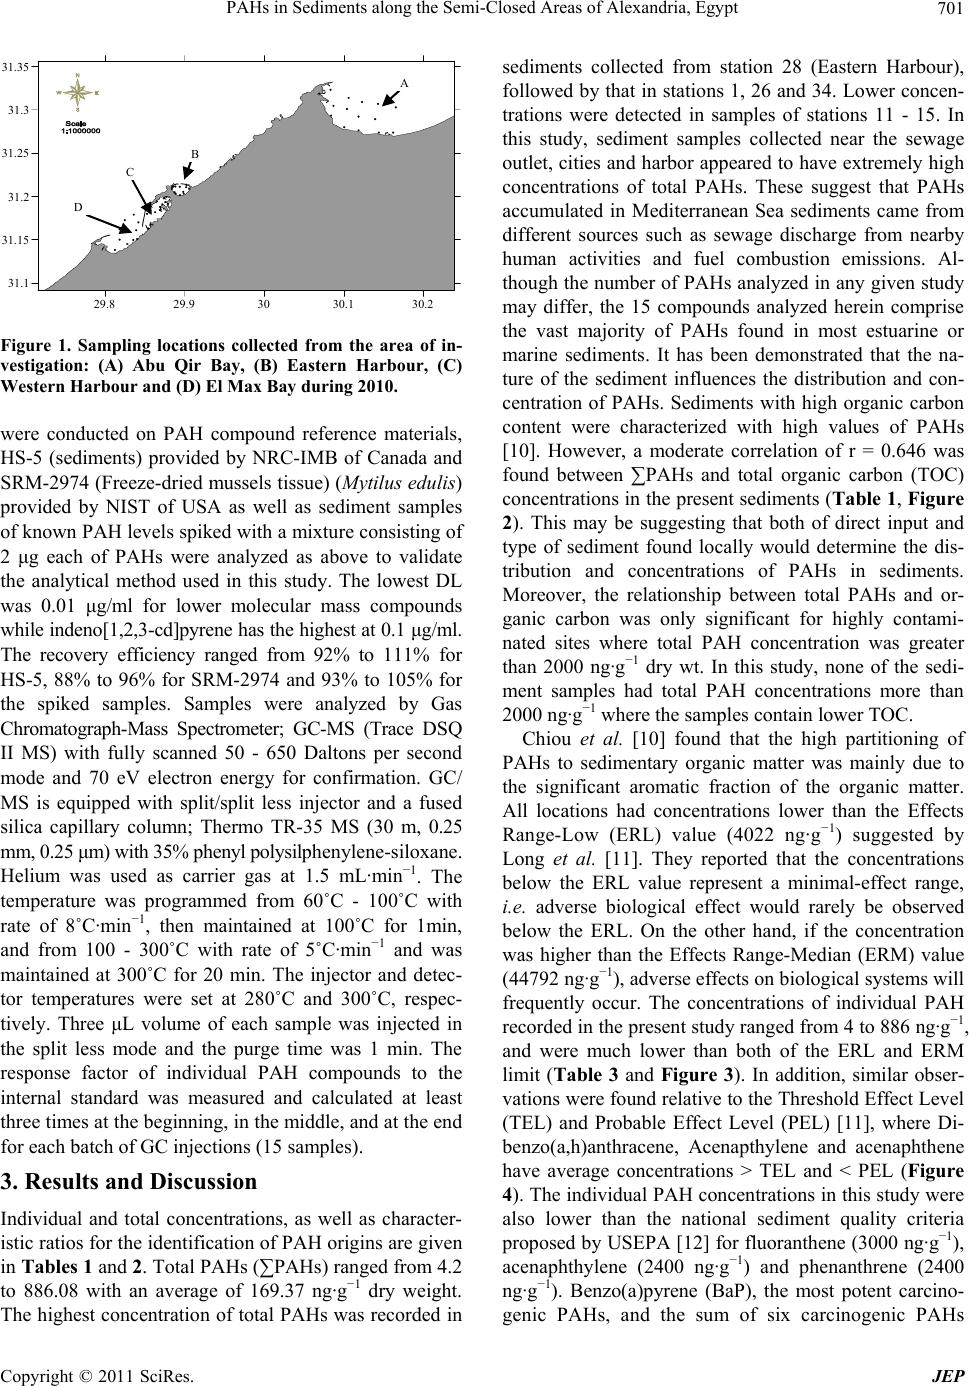 PAHs in Sediments along the Semi-Closed Areas of Alexandria, Egypt701 29.829.9 30 30.130.2 31.1 31.15 31.2 31.25 31.3 31.35 B D Figure 1. Sampling locations collected from the area of in- vestigation: (A) Abu Qir Bay, (B) Eastern Harbour, (C) Western Harbour and (D) El Max Bay during 2010. were conducted on PAH compound reference materials, HS-5 (sediments) provided by NRC-IMB of Canada and SRM-2974 (Freeze-dried mussels tissue) (Mytilus edulis) provided by NIST of USA as well as sediment samples of known PAH levels spiked with a mixture consisting of 2 μg each of PAHs were analyzed as above to validate the analytical method used in this study. The lowest DL was 0.01 μg/ml for lower molecular mass compounds while indeno[1,2,3-cd]pyrene has the highest at 0.1 μg/ml. The recovery efficiency ranged from 92% to 111% for HS-5, 88% to 96% for SRM-2974 and 93% to 105% for the spiked samples. Samples were analyzed by Gas Chromatograph-Mass Spectrometer; GC-MS (Trace DSQ II MS) with fully scanned 50 - 650 Daltons per second mode and 70 eV electron energy for confirmation. GC/ MS is equipped with split/split less injector and a fused silica capillary column; Thermo TR-35 MS (30 m, 0.25 mm, 0.25 μm) with 35% phenyl polysilphenylene-siloxane. Helium was used as carrier gas at 1.5 mL·min−1. The temperature was programmed from 60˚C - 100˚C with rate of 8˚C·min−1, then maintained at 100˚C for 1min, and from 100 - 300˚C with rate of 5˚C·min−1 and was maintained at 300˚C for 20 min. The injector and detec- tor temperatures were set at 280˚C and 300˚C, respec- tively. Three μL volume of each sample was injected in the split less mode and the purge time was 1 min. The response factor of individual PAH compounds to the internal standard was measured and calculated at least three times at the beginning, in the middle, and at the end for each batch of GC injections (15 samples). 3. Results and Discussion Individual and total concentrations, as well as character- istic ratios for the identification of PAH origins are given in Tables 1 and 2. Total PAHs (∑PAHs) ranged from 4.2 to 886.08 with an average of 169.37 ng·g−1 dry weight. The highest concentration of total PAHs was recorded in sediments collected from station 28 (Eastern Harbour), followed by that in stations 1, 26 and 34. Lower concen- trations were detected in samples of stations 11 - 15. In this study, sediment samples collected near the sewage outlet, cities and harbor appeared to have extremely high concentrations of total PAHs. These suggest that PAHs accumulated in Mediterranean Sea sediments came from different sources such as sewage discharge from nearby human activities and fuel combustion emissions. Al- though the number of PAHs analyzed in any given study may differ, the 15 compounds analyzed herein comprise the vast majority of PAHs found in most estuarine or marine sediments. It has been demonstrated that the na- ture of the sediment influences the distribution and con- centration of PAHs. Sediments with high organic carbon content were characterized with high values of PAHs [10]. However, a moderate correlation of r = 0.646 was found between ∑PAHs and total organic carbon (TOC) concentrations in the present sediments (Table 1, Figure 2). This may be suggesting that both of direct input and type of sediment found locally would determine the dis- tribution and concentrations of PAHs in sediments. Moreover, the relationship between total PAHs and or- ganic carbon was only significant for highly contami- nated sites where total PAH concentration was greater than 2000 ng·g−1 dry wt. In this study, none of the sedi- ment samples had total PAH concentrations more than 2000 ng·g−1 where the samples contain lower TOC. Chiou et al. [10] found that the high partitioning of PAHs to sedimentary organic matter was mainly due to the significant aromatic fraction of the organic matter. All locations had concentrations lower than the Effects Range-Low (ERL) value (4022 ng·g−1) suggested by Long et al. [11]. They reported that the concentrations below the ERL value represent a minimal-effect range, i.e. adverse biological effect would rarely be observed below the ERL. On the other hand, if the concentration was higher than the Effects Range-Median (ERM) value (44792 ng·g−1), adverse effects on biological systems will frequently occur. The concentrations of individual PAH recorded in the present study ranged from 4 to 886 ng·g−1, and were much lower than both of the ERL and ERM limit (Table 3 and Figure 3). In addition, similar obser- vations were found relative to the Threshold Effect Level (TEL) and Probable Effect Level (PEL) [11], where Di- benzo(a,h)anthracene, Acenapthylene and acenaphthene have average concentrations > TEL and < PEL (Figure 4). The individual PAH concentrations in this study were also lower than the national sediment quality criteria proposed by USEPA [12] for fluoranthene (3000 ng·g−1), acenaphthylene (2400 ng·g−1) and phenanthrene (2400 ng·g−1). Benzo(a)pyrene (BaP), the most potent carcino- genic PAHs, and the sum of six carcinogenic PAHs Copyright © 2011 SciRes. JEP 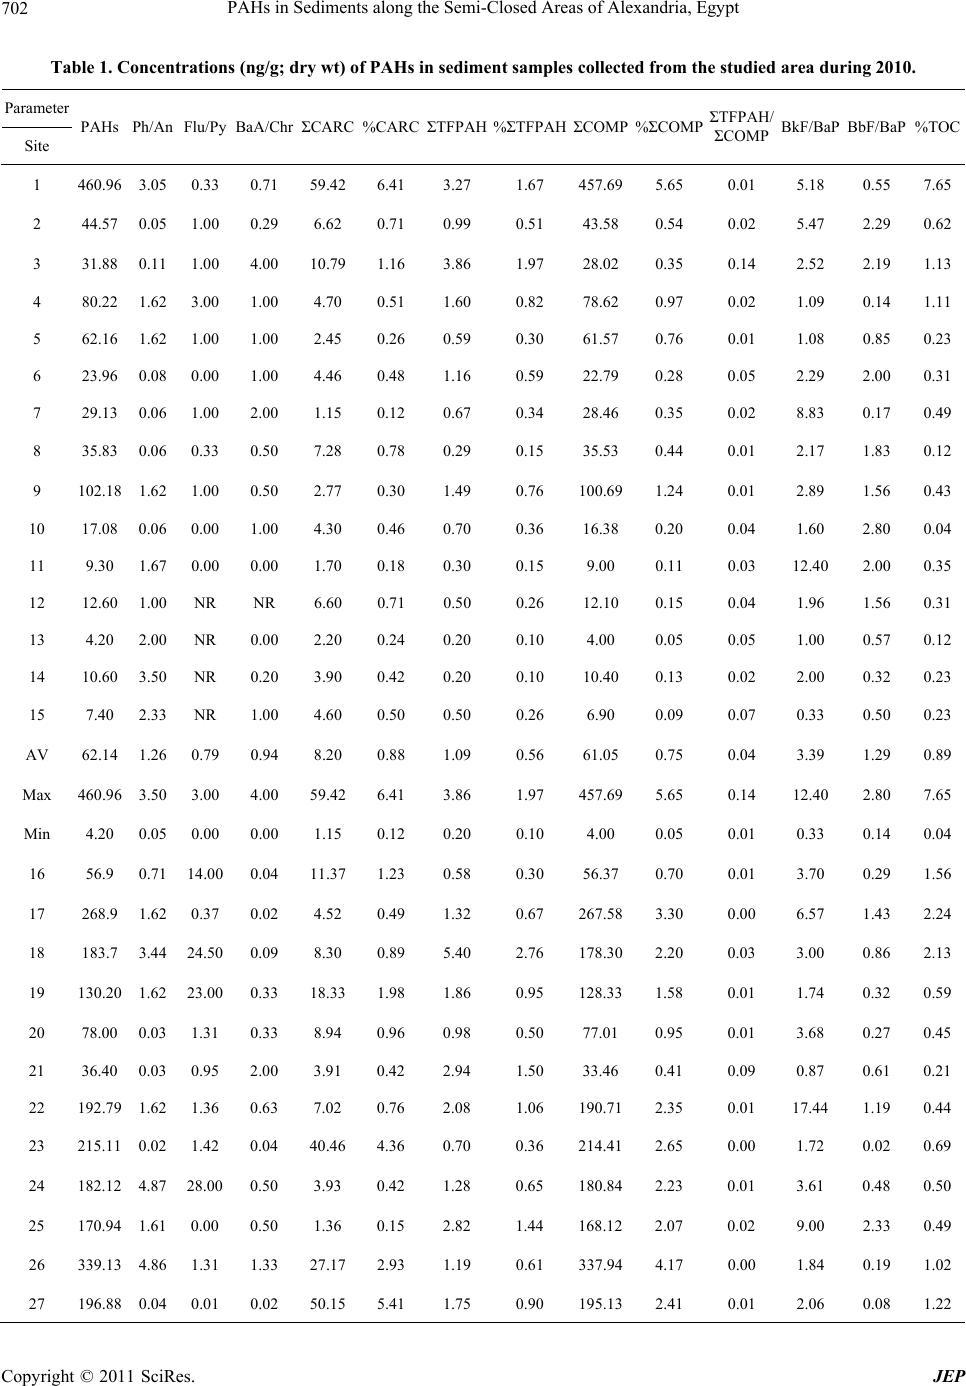 PAHs in Sediments along the Semi-Closed Areas of Alexandria, Egypt Copyright © 2011 SciRes. JEP 702 Table 1. Concentrations (ng/g; dry wt) of PAHs in sediment samples collected from the studied area during 2010. Parameter Site PAHs Ph/An Flu/Py BaA/Chr ΣCARC %CARCΣTFPAH %ΣTFPAH ΣCOMP %ΣCOMP ΣTFPAH/ ΣCOMP BkF/BaP BbF/BaP%TOC 1 460.96 3.05 0.33 0.71 59.42 6.41 3.27 1.67 457.695.65 0.01 5.18 0.55 7.65 2 44.57 0.05 1.00 0.29 6.62 0.71 0.99 0.51 43.580.54 0.02 5.47 2.29 0.62 3 31.88 0.11 1.00 4.00 10.79 1.16 3.86 1.97 28.020.35 0.14 2.52 2.19 1.13 4 80.22 1.62 3.00 1.00 4.70 0.51 1.60 0.82 78.620.97 0.02 1.09 0.14 1.11 5 62.16 1.62 1.00 1.00 2.45 0.26 0.59 0.30 61.570.76 0.01 1.08 0.85 0.23 6 23.96 0.08 0.00 1.00 4.46 0.48 1.16 0.59 22.790.28 0.05 2.29 2.00 0.31 7 29.13 0.06 1.00 2.00 1.15 0.12 0.67 0.34 28.460.35 0.02 8.83 0.17 0.49 8 35.83 0.06 0.33 0.50 7.28 0.78 0.29 0.15 35.530.44 0.01 2.17 1.83 0.12 9 102.18 1.62 1.00 0.50 2.77 0.30 1.49 0.76 100.691.24 0.01 2.89 1.56 0.43 10 17.08 0.06 0.00 1.00 4.30 0.46 0.70 0.36 16.38 0.20 0.04 1.60 2.80 0.04 11 9.30 1.67 0.00 0.00 1.70 0.18 0.30 0.15 9.00 0.11 0.03 12.40 2.00 0.35 12 12.60 1.00 NR NR 6.60 0.71 0.50 0.26 12.100.15 0.04 1.96 1.56 0.31 13 4.20 2.00 NR 0.00 2.20 0.24 0.20 0.10 4.00 0.05 0.05 1.00 0.57 0.12 14 10.60 3.50 NR 0.20 3.90 0.42 0.20 0.10 10.40 0.13 0.02 2.00 0.32 0.23 15 7.40 2.33 NR 1.00 4.60 0.50 0.50 0.26 6.90 0.09 0.07 0.33 0.50 0.23 AV 62.14 1.26 0.79 0.94 8.20 0.88 1.09 0.56 61.050.75 0.04 3.39 1.29 0.89 Max 460.96 3.50 3.00 4.00 59.42 6.41 3.86 1.97 457.695.65 0.14 12.40 2.80 7.65 Min 4.20 0.05 0.00 0.00 1.15 0.12 0.20 0.10 4.00 0.05 0.01 0.33 0.14 0.04 16 56.9 0.71 14.00 0.04 11.37 1.23 0.58 0.30 56.370.70 0.01 3.70 0.29 1.56 17 268.9 1.62 0.37 0.02 4.52 0.49 1.32 0.67 267.583.30 0.00 6.57 1.43 2.24 18 183.7 3.44 24.50 0.09 8.30 0.89 5.40 2.76 178.302.20 0.03 3.00 0.86 2.13 19 130.20 1.62 23.00 0.33 18.33 1.98 1.86 0.95 128.331.58 0.01 1.74 0.32 0.59 20 78.00 0.03 1.31 0.33 8.94 0.96 0.98 0.50 77.01 0.95 0.01 3.68 0.27 0.45 21 36.40 0.03 0.95 2.00 3.91 0.42 2.94 1.50 33.46 0.41 0.09 0.87 0.61 0.21 22 192.79 1.62 1.36 0.63 7.02 0.76 2.08 1.06 190.71 2.35 0.01 17.44 1.19 0.44 23 215.11 0.02 1.42 0.04 40.46 4.36 0.70 0.36 214.412.65 0.00 1.72 0.02 0.69 24 182.12 4.87 28.00 0.50 3.93 0.42 1.28 0.65 180.842.23 0.01 3.61 0.48 0.50 25 170.94 1.61 0.00 0.50 1.36 0.15 2.82 1.44 168.12 2.07 0.02 9.00 2.33 0.49 26 339.13 4.86 1.31 1.33 27.17 2.93 1.19 0.61 337.944.17 0.00 1.84 0.19 1.02 27 196.88 0.04 0.01 0.02 50.15 5.41 1.75 0.90 195.132.41 0.01 2.06 0.08 1.22  PAHs in Sediments along the Semi-Closed Areas of Alexandria, Egypt703 28 886.1 6.04 1.24 0.85 143.47 15.460.57 0.29 885.5110.93 0.00 1.95 0.03 3.18 AV 225.9 2.0 7.5 0.5 25.3 2.7 1.8 0.9 224.12.8 0.0 4.4 0.6 1.1 Max 886.1 6.0 28.0 2.0 143.5 15.5 5.4 2.8 885.510.9 0.1 17.4 2.3 3.2 Min 36.4 0.0 0.0 0.0 1.4 0.1 0.6 0.3 33.5 0.4 0.0 0.9 0.0 0.2 29 266.4 1.62 4.20 0.04 23.68 2.55 2.70 1.38 263.743.25 0.01 2.22 0.25 2.67 30 292.8 2.79 1.40 0.23 46.50 5.01 14.807.56 278.003.43 0.05 2.75 0.43 6.00 31 47.8 0.06 1.00 1.50 4.92 0.53 1.98 1.01 45.790.57 0.04 3.50 1.35 0.36 32 356.9 0.62 1.26 11.94 78.00 8.41 0.90 0.46 356.004.39 0.00 2.59 1.55 2.71 33 184.8 0.03 1.20 4.17 45.80 4.94 3.40 1.74 181.402.24 0.02 2.12 0.51 3.96 34 542.3 0.53 4.88 0.08 11.20 1.21 2.90 1.48 539.406.66 0.01 3.60 1.03 2.89 35 205.3 0.01 1.08 0.12 7.29 0.79 1.40 0.71 203.892.52 0.01 8.62 2.15 1.82 36 56.7 0.02 4.25 0.83 13.00 1.40 2.20 1.12 54.500.67 0.04 1.63 0.41 0.63 37 719.0 0.68 9.71 0.80 153.80 16.582.40 1.23 716.608.84 0.00 2.33 0.07 3.58 38 157.6 42.11 3.63 7.85 36.60 3.94 1.90 0.97 155.701.92 0.01 14.05 2.74 2.81 39 181.2 0.06 3.26 0.07 21.19 2.28 2.39 1.22 178.812.21 0.01 2.07 0.08 3.09 AV 273.7 4.4 3.3 2.5 40.2 4.3 3.4 1.7 270.33.3 0.0 4.1 1.0 2.8 Max 719.0 42.1 9.7 11.9 153.8 16.6 14.8 7.6 716.68.8 0.1 14.1 2.7 6.0 Min 47.8 0.0 1.0 0.0 4.9 0.5 0.9 0.5 45.8 0.6 0.0 1.6 0.1 0.4 40 73.3 0.38 0.10 NR 2.98 0.32 24.3812.46 48.900.60 0.50 3.33 1.44 0.49 41 281.9 1.62 1.00 NR 6.57 0.71 1.03 0.52 280.903.47 0.00 1.17 3.67 2.17 42 200.9 1.47 1.50 1.00 2.52 0.27 0.80 0.41 200.132.47 0.00 1.00 0.70 0.93 43 201.1 1.74 1.24 1.00 1.62 0.17 1.89 0.97 199.192.46 0.01 27.50 3.50 1.26 44 119.5 2.12 0.80 1.00 3.40 0.37 0.85 0.43 118.691.46 0.01 1.78 1.67 0.30 45 100.2 0.11 1.00 2.00 3.02 0.33 44.92 22.96 55.240.68 0.81 2.29 1.43 1.54 46 226.6 1.65 0.77 1.00 3.13 0.34 32.62 16.67 193.952.39 0.17 1.73 0.80 0.61 47 70.8 0.19 3.80 1.00 3.20 0.35 6.40 3.27 64.400.79 0.10 1.42 0.75 0.73 48 22.9 2.77 1.50 NR 3.54 0.38 1.27 0.65 21.650.27 0.06 1.00 0.33 0.30 49 121.8 3.42 2.00 1.00 3.93 0.42 4.77 2.44 117.061.44 0.04 1.63 4.75 0.42 AV 141.9 1.5 1.4 1.1 3.4 0.4 11.9 6.1 130.01.6 0.2 4.3 1.9 0.9 Max 281.9 3.4 3.8 2.0 6.6 0.7 44.9 23.0 280.93.5 0.8 27.5 4.8 2.2 Min 22.91 0.11 0.10 1.00 1.62 0.17 0.80 0.41 21.650.27 0.00 1.00 0.33 0.30 Abu Qir Sector from 1 - 15; Eastern Harbour sector: 16 - 28, Western Harbour sector: 29 - 39, El Max sector: 40 - 49, Av: average, Max: maximum, Min: minimum, PAHs: Sum of aromatic hydrocarbons, Phe: phenanthrene, An: anthracene, Flu: Fluoranthene, Py: pyrene, BaA: Benzo(a)anthracene, Chr: Chrysene, BkF: benzo(k)flouranthene, BaP: benzo(a)pyrene, BbF: benzo(b)fluoranthene, ΣCARC: Sum of BaA + BbF + BkF + BaP + DBA + InP, ΣTFPAH: Sum Ace- naphthylene + Acenaphthene, ΣCOMP: Sum of all PAHs except those calculated for ΣTFPAH. Copyright © 2011 SciRes. JEP 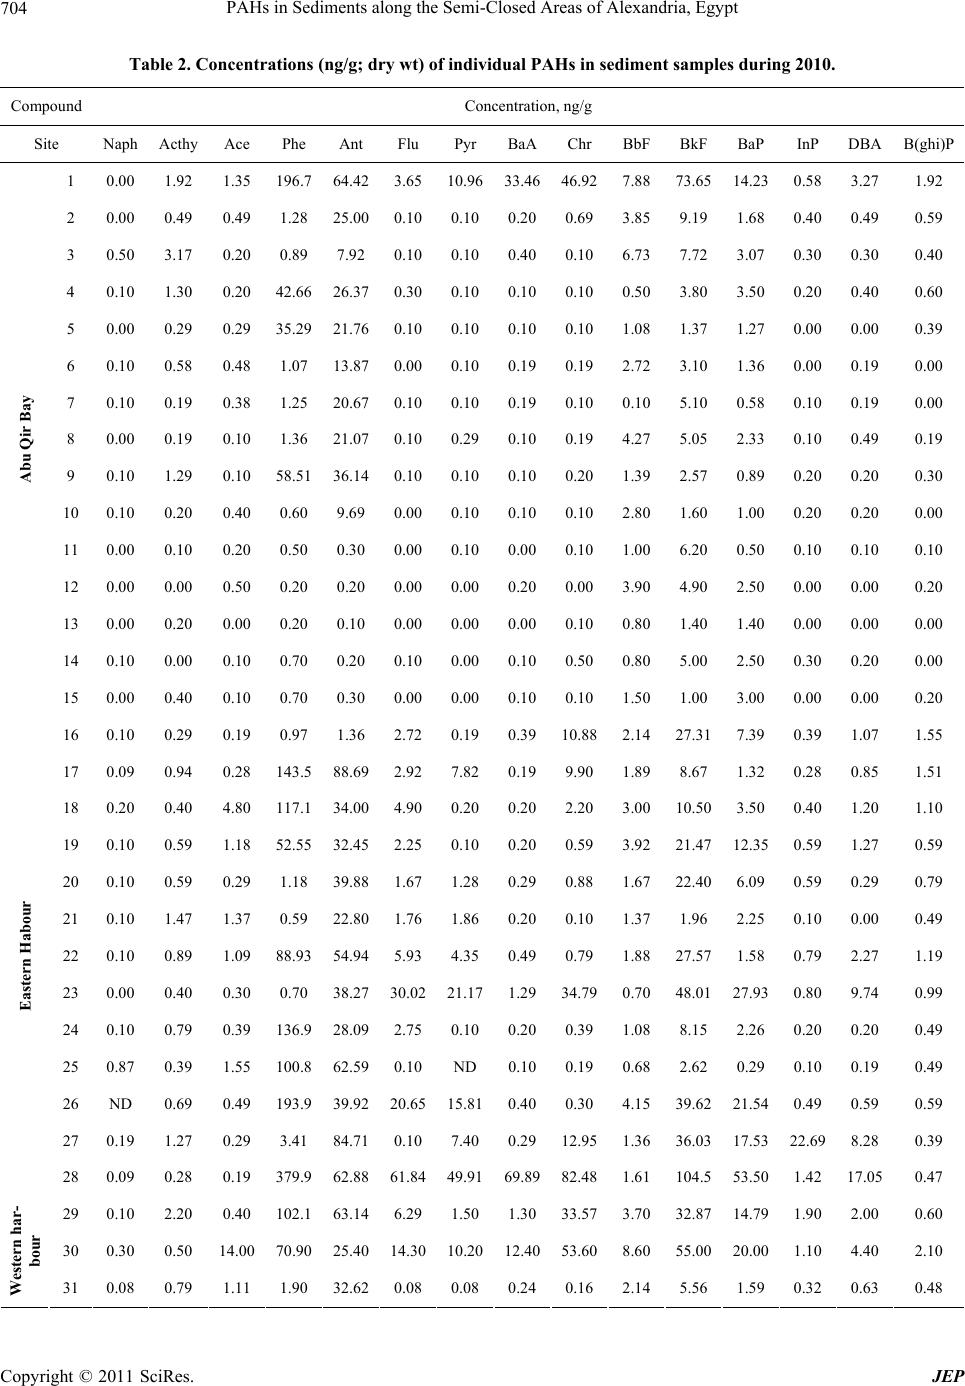 PAHs in Sediments along the Semi-Closed Areas of Alexandria, Egypt 704 Table 2. Concentrations (ng/g; dry wt) of individual PAHs in sediment samples during 2010. Compound Concentration, ng/g Site Naph Acthy AcePhe Ant Flu Pyr BaAChr BbFBkFBaP InP DBAB(ghi)P 1 0.00 1.92 1.35196.7 64.42 3.6510.96 33.46 46.927.8873.65 14.23 0.58 3.271.92 2 0.00 0.49 0.491.28 25.00 0.100.100.200.693.859.191.68 0.40 0.490.59 3 0.50 3.17 0.20 0.89 7.92 0.10 0.10 0.40 0.10 6.73 7.723.07 0.30 0.300.40 4 0.10 1.30 0.2042.66 26.37 0.300.100.100.100.503.803.50 0.20 0.400.60 5 0.00 0.29 0.2935.29 21.76 0.100.100.100.101.081.371.27 0.00 0.000.39 6 0.10 0.58 0.481.07 13.87 0.000.100.190.192.723.101.36 0.00 0.190.00 7 0.10 0.19 0.381.25 20.67 0.100.100.190.100.105.100.58 0.10 0.190.00 8 0.00 0.19 0.101.36 21.07 0.100.290.100.194.275.052.33 0.10 0.490.19 9 0.10 1.29 0.1058.51 36.14 0.100.100.100.201.392.570.89 0.20 0.200.30 10 0.10 0.20 0.400.60 9.69 0.00 0.100.10 0.10 2.80 1.601.00 0.20 0.200.00 11 0.00 0.10 0.200.50 0.30 0.00 0.100.00 0.10 1.00 6.200.50 0.10 0.100.10 12 0.00 0.00 0.500.20 0.20 0.00 0.000.20 0.00 3.90 4.902.50 0.00 0.000.20 13 0.00 0.20 0.000.20 0.10 0.00 0.000.00 0.10 0.80 1.401.40 0.00 0.000.00 14 0.10 0.00 0.100.70 0.20 0.10 0.000.10 0.50 0.80 5.002.50 0.30 0.200.00 Abu Qir Bay 15 0.00 0.40 0.100.70 0.30 0.00 0.000.10 0.10 1.50 1.003.00 0.00 0.000.20 16 0.10 0.29 0.190.97 1.36 2.72 0.190.3910.882.1427.317.39 0.39 1.071.55 17 0.09 0.94 0.28143.5 88.69 2.927.820.199.901.898.671.32 0.28 0.851.51 18 0.20 0.40 4.80117.1 34.00 4.900.200.202.203.0010.503.50 0.40 1.201.10 19 0.10 0.59 1.1852.55 32.45 2.250.100.200.593.9221.47 12.35 0.59 1.270.59 20 0.10 0.59 0.291.18 39.88 1.671.280.290.881.67 22.40 6.09 0.59 0.290.79 21 0.10 1.47 1.370.59 22.80 1.761.860.200.101.371.962.25 0.10 0.000.49 22 0.10 0.89 1.0988.93 54.94 5.934.350.490.791.8827.571.58 0.79 2.271.19 23 0.00 0.40 0.300.70 38.27 30.0221.171.2934.790.70 48.0127.93 0.80 9.740.99 24 0.10 0.79 0.39136.9 28.09 2.750.100.200.391.088.152.26 0.20 0.200.49 25 0.87 0.39 1.55100.8 62.59 0.10ND 0.100.190.682.620.29 0.10 0.190.49 26 ND 0.69 0.49193.9 39.92 20.65 15.810.400.304.1539.62 21.54 0.49 0.590.59 27 0.19 1.27 0.293.41 84.71 0.107.400.29 12.95 1.36 36.0317.53 22.69 8.280.39 Eastern Habour 28 0.09 0.28 0.19379.9 62.88 61.84 49.91 69.89 82.481.61104.553.50 1.42 17.050.47 29 0.10 2.20 0.40102.1 63.14 6.291.501.3033.573.7032.8714.79 1.90 2.000.60 30 0.30 0.50 14.00 70.90 25.40 14.30 10.20 12.40 53.608.6055.0020.00 1.10 4.402.10 Western har- bour 31 0.08 0.79 1.111.90 32.62 0.080.080.240.162.145.561.59 0.32 0.630.48 Copyright © 2011 SciRes. JEP 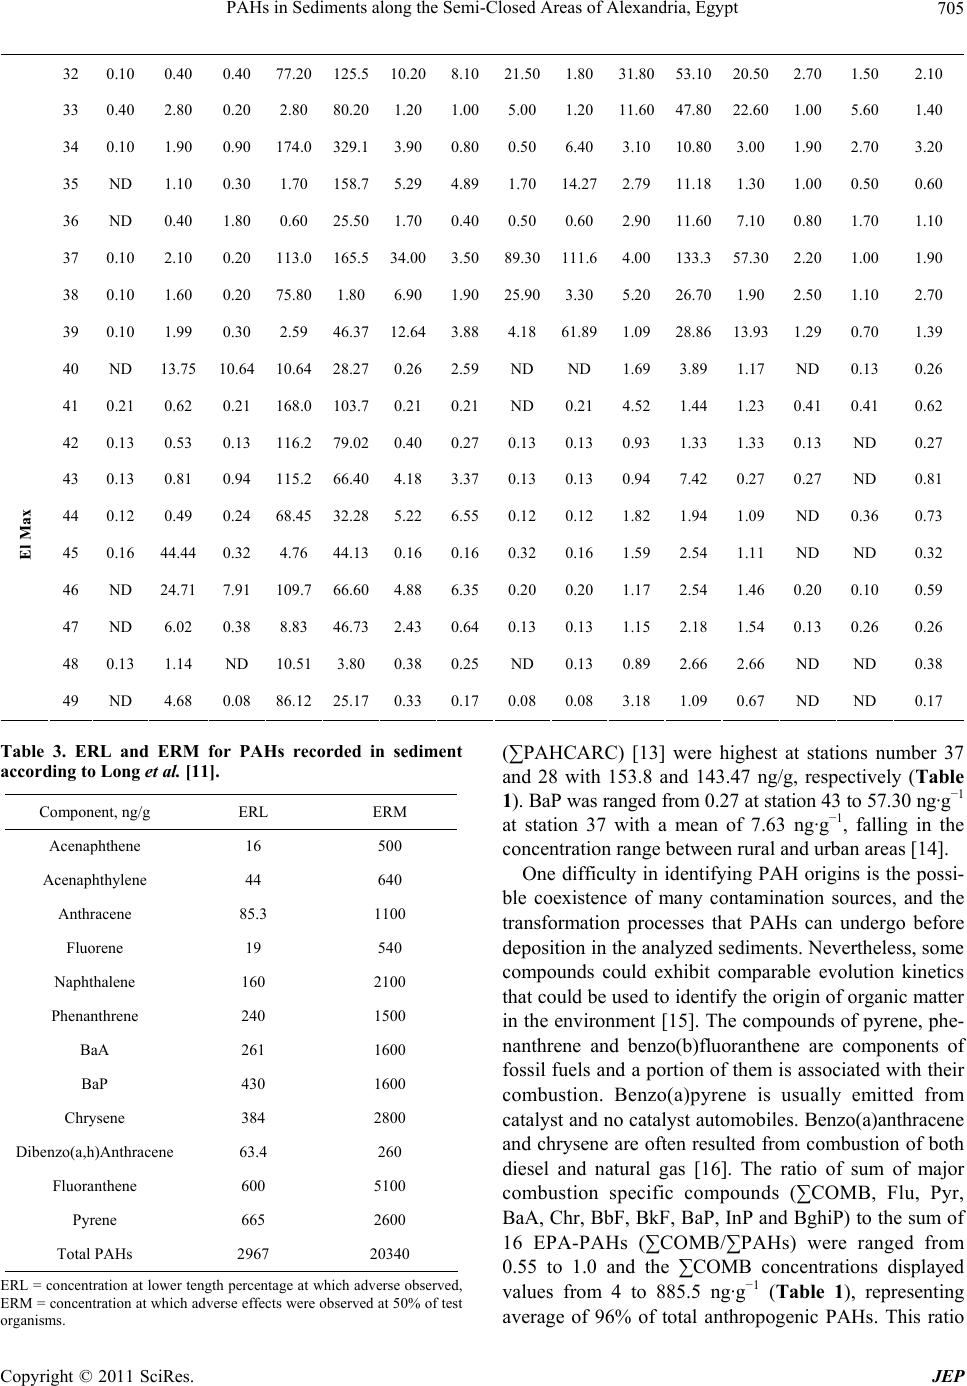 PAHs in Sediments along the Semi-Closed Areas of Alexandria, Egypt Copyright © 2011 SciRes. JEP 705 32 0.10 0.40 0.4077.20 125.5 10.208.1021.501.8031.8053.1020.50 2.70 1.502.10 33 0.40 2.80 0.202.80 80.20 1.201.005.001.20 11.6047.8022.60 1.00 5.601.40 34 0.10 1.90 0.90174.0 329.1 3.900.800.506.403.1010.803.00 1.90 2.703.20 35 ND 1.10 0.301.70 158.7 5.294.891.70 14.27 2.7911.181.30 1.00 0.500.60 36 ND 0.40 1.800.60 25.50 1.700.400.500.602.90 11.607.10 0.80 1.701.10 37 0.10 2.10 0.20113.0 165.5 34.003.5089.30 111.64.00133.3 57.30 2.20 1.001.90 38 0.10 1.60 0.20 75.80 1.80 6.901.90 25.90 3.305.20 26.70 1.90 2.50 1.102.70 39 0.10 1.99 0.302.59 46.37 12.643.884.18 61.891.0928.8613.93 1.29 0.701.39 40 ND 13.75 10.64 10.64 28.27 0.262.59ND ND 1.693.891.17 ND 0.130.26 41 0.21 0.62 0.21168.0 103.7 0.210.21ND 0.214.521.441.23 0.41 0.410.62 42 0.13 0.53 0.13116.2 79.02 0.400.270.130.130.931.331.33 0.13 ND 0.27 43 0.13 0.81 0.94115.2 66.40 4.183.370.130.130.947.420.27 0.27 ND 0.81 44 0.12 0.49 0.2468.45 32.28 5.226.550.120.121.821.941.09 ND 0.360.73 45 0.16 44.44 0.324.76 44.13 0.160.160.320.161.592.541.11 ND ND 0.32 46 ND 24.71 7.91109.7 66.60 4.886.350.200.201.172.541.46 0.20 0.100.59 47 ND 6.02 0.388.83 46.73 2.430.640.130.131.152.181.54 0.13 0.260.26 48 0.13 1.14 ND 10.51 3.80 0.380.25ND 0.130.892.662.66 ND ND 0.38 El Max 49 ND 4.68 0.0886.12 25.17 0.330.170.080.083.181.090.67 ND ND 0.17 Table 3. ERL and ERM for PAHs recorded in sediment according to Long et al. [11]. ERM ERL Component, ng/g 500 16 Acenaphthene 640 44 Acenaphthylene 1100 85.3 Anthracene 540 19 Fluorene 2100 160 Naphthalene 1500 240 Phenanthrene 1600 261 BaA 1600 430 BaP 2800 384 Chrysene 260 63.4 Dibenzo(a,h)Anthracene 5100 600 Fluoranthene 2600 665 Pyrene 20340 2967 Total PAHs ERL = concentration at lower tength percentage at which adverse observed, ERM = concentration at which adverse effects were observed at 50% of test organisms. (∑PAHCARC) [13] were highest at stations number 37 and 28 with 153.8 and 143.47 ng/g, respectively (Table 1). BaP was ranged from 0.27 at station 43 to 57.30 ng·g−1 at station 37 with a mean of 7.63 ng·g−1, falling in the concentration range between rural and urban areas [14]. One difficulty in identifying PAH origins is the possi- ble coexistence of many contamination sources, and the transformation processes that PAHs can undergo before deposition in the analyzed sediments. Nevertheless, some compounds could exhibit comparable evolution kinetics that could be used to identify the origin of organic matter in the environment [15]. The compounds of pyrene, phe- nanthrene and benzo(b)fluoranthene are components of fossil fuels and a portion of them is associated with their combustion. Benzo(a)pyrene is usually emitted from catalyst and no catalyst automobiles. Benzo(a)anthracene and chrysene are often resulted from combustion of both diesel and natural gas [16]. The ratio of sum of major combustion specific compounds (∑COMB, Flu, Pyr, BaA, Chr, BbF, BkF, BaP, InP and BghiP) to the sum of 16 EPA-PAHs (∑COMB/∑PAHs) were ranged from 0.55 to 1.0 and the ∑COMB concentrations displayed values from 4 to 885.5 ng·g−1 (Table 1), representing average of 96% of total anthrpogenic PAHs. This ratio o 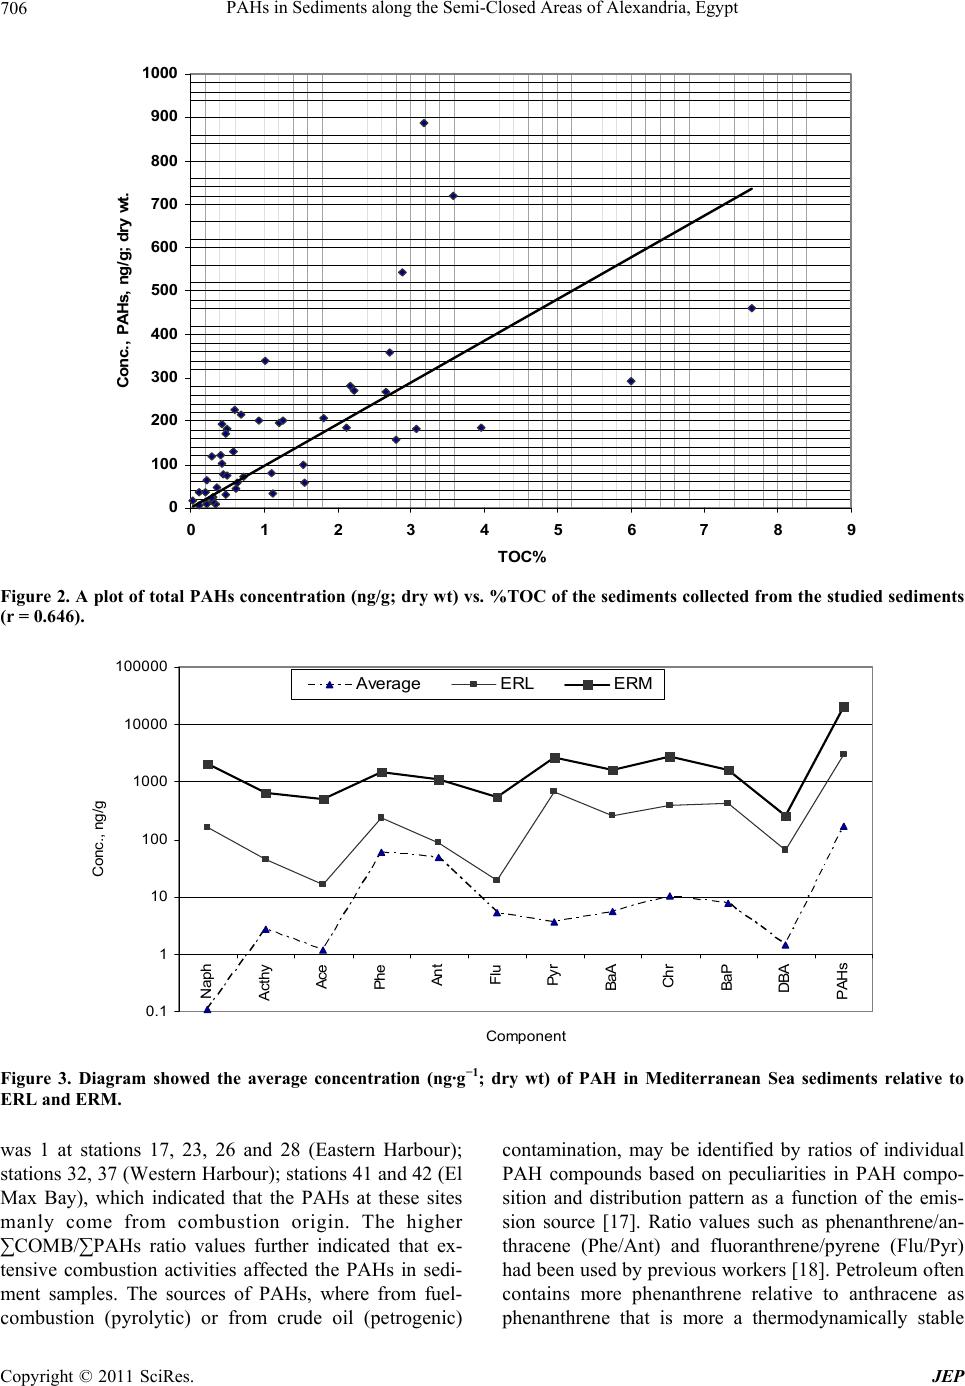 PAHs in Sediments along the Semi-Closed Areas of Alexandria, Egypt 706 0 100 200 300 400 500 600 700 800 900 1000 012345678 TOC% Conc., P AHs, ng/g; dry wt. 9 Figure 2. A plot of total PAHs concentration (ng/g; dry wt) vs. %TOC of the sediments collected from the studied sediments (r = 0.646). 0.1 1 10 100 1000 10000 100000 Naph Acthy Ace Ph e An t Flu Pyr Ba A Ch r Ba P DBA PAHs Component Conc., ng/g Average ERLERM Figure 3. Diagram showed the average concentration (ng·g−1; dry wt) of PAH in Mediterranean Sea sediments relative to ERL and ERM. was 1 at stations 17, 23, 26 and 28 (Eastern Harbour); stations 32, 37 (Western Harbour); stations 41 and 42 (El Max Bay), which indicated that the PAHs at these sites manly come from combustion origin. The higher ∑COMB/∑PAHs ratio values further indicated that ex- tensive combustion activities affected the PAHs in sedi- ment samples. The sources of PAHs, where from fuel- combustion (pyrolytic) or from crude oil (petrogenic) contamination, may be identified by ratios of individual PAH compounds based on peculiarities in PAH compo- sition and distribution pattern as a function of the emis- sion source [17]. Ratio values such as phenanthrene/an- thracene (Phe/Ant) and fluoranthrene/pyrene (Flu/Pyr) had been used by previous workers [18]. Petroleum often contains more phenanthrene relative to anthracene as phenanthrene that is more a thermodynamically stable Copyright © 2011 SciRes. JEP 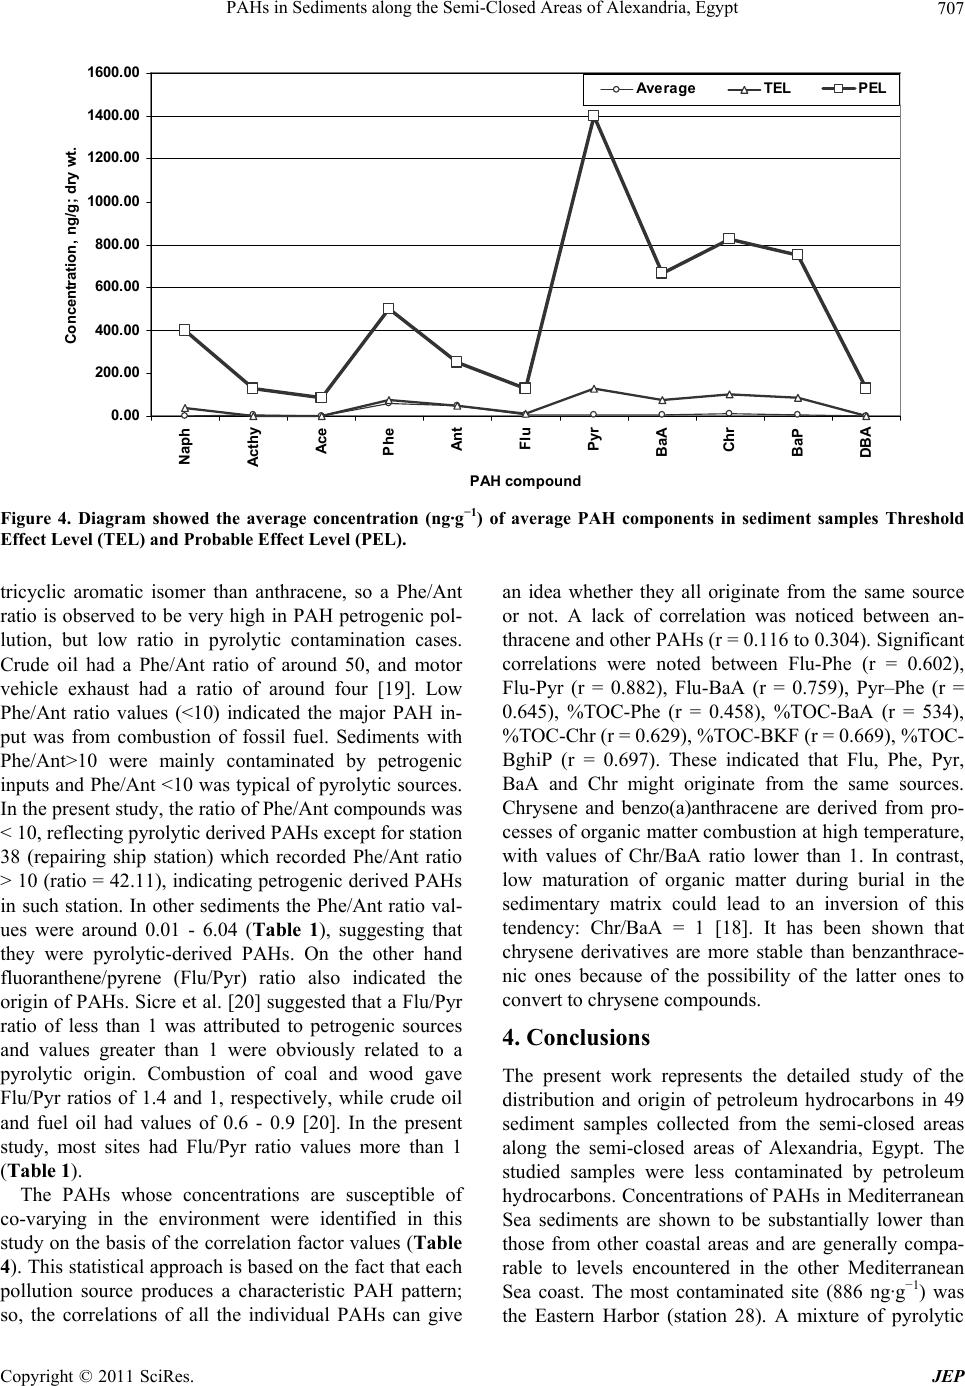 PAHs in Sediments along the Semi-Closed Areas of Alexandria, Egypt707 0. 00 200. 00 400. 00 600. 00 800. 00 1000.00 1200.00 1400.00 1600.00 Naph Acthy Ace Phe Ant Flu Pyr BaA Ch r BaP DBA PAH compound Concentration, ng/ g; dry wt. Average TELPEL Figure 4. Diagram showed the average concentration (ng·g−1) of average PAH components in sediment samples Threshold Effect Level (TEL) and Probable Effect Level (PEL). tricyclic aromatic isomer than anthracene, so a Phe/Ant ratio is observed to be very high in PAH petrogenic pol- lution, but low ratio in pyrolytic contamination cases. Crude oil had a Phe/Ant ratio of around 50, and motor vehicle exhaust had a ratio of around four [19]. Low Phe/Ant ratio values (<10) indicated the major PAH in- put was from combustion of fossil fuel. Sediments with Phe/Ant>10 were mainly contaminated by petrogenic inputs and Phe/Ant <10 was typical of pyrolytic sources. In the present study, the ratio of Phe/Ant compounds was < 10, reflecting pyrolytic derived PAHs except for station 38 (repairing ship station) which recorded Phe/Ant ratio > 10 (ratio = 42.11), indicating petrogenic derived PAHs in such station. In other sediments the Phe/Ant ratio val- ues were around 0.01 - 6.04 (Table 1), suggesting that they were pyrolytic-derived PAHs. On the other hand fluoranthene/pyrene (Flu/Pyr) ratio also indicated the origin of PAHs. Sicre et al. [20] suggested that a Flu/Pyr ratio of less than 1 was attributed to petrogenic sources and values greater than 1 were obviously related to a pyrolytic origin. Combustion of coal and wood gave Flu/Pyr ratios of 1.4 and 1, respectively, while crude oil and fuel oil had values of 0.6 - 0.9 [20]. In the present study, most sites had Flu/Pyr ratio values more than 1 (Table 1). The PAHs whose concentrations are susceptible of co-varying in the environment were identified in this study on the basis of the correlation factor values (Table 4). This statistical approach is based on the fact that each pollution source produces a characteristic PAH pattern; so, the correlations of all the individual PAHs can give an idea whether they all originate from the same source or not. A lack of correlation was noticed between an- thracene and other PAHs (r = 0.116 to 0.304). Significant correlations were noted between Flu-Phe (r = 0.602), Flu-Pyr (r = 0.882), Flu-BaA (r = 0.759), Pyr–Phe (r = 0.645), %TOC-Phe (r = 0.458), %TOC-BaA (r = 534), %TOC-Chr (r = 0.629), %TOC-BKF (r = 0.669), %TOC- BghiP (r = 0.697). These indicated that Flu, Phe, Pyr, BaA and Chr might originate from the same sources. Chrysene and benzo(a)anthracene are derived from pro- cesses of organic matter combustion at high temperature, with values of Chr/BaA ratio lower than 1. In contrast, low maturation of organic matter during burial in the sedimentary matrix could lead to an inversion of this tendency: Chr/BaA = 1 [18]. It has been shown that chrysene derivatives are more stable than benzanthrace- nic ones because of the possibility of the latter ones to convert to chrysene compounds. 4. Conclusions The present work represents the detailed study of the distribution and origin of petroleum hydrocarbons in 49 sediment samples collected from the semi-closed areas along the semi-closed areas of Alexandria, Egypt. The studied samples were less contaminated by petroleum hydrocarbons. Concentrations of PAHs in Mediterranean Sea sediments are shown to be substantially lower than those from other coastal areas and are generally compa- rable to levels encountered in the other Mediterranean Sea coast. The most contaminated site (886 ng·g−1) was the Eastern Harbor (station 8). A mixture of pyrolytic 2 Copyright © 2011 SciRes. JEP 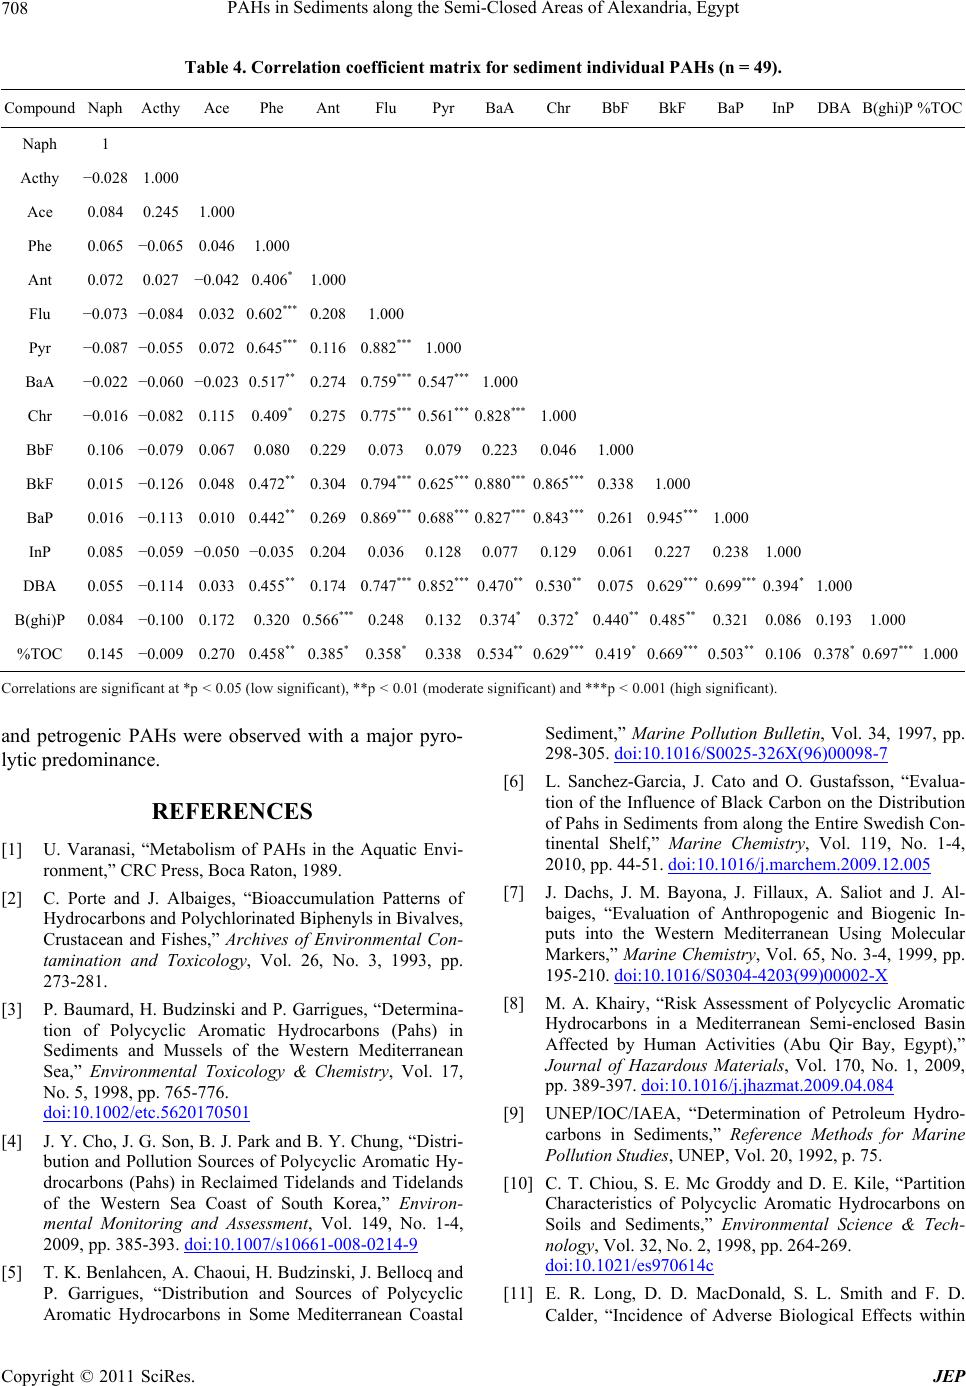 PAHs in Sediments along the Semi-Closed Areas of Alexandria, Egypt 708 Table 4. Correlation coefficient matrix for sediment individual PAHs (n = 49). Compound Naph Acthy Ace Phe Ant Flu Pyr BaAChr BbFBkF BaP InP DBA B(ghi)P%TOC Naph 1 Acthy −0.028 1.000 Ace 0.084 0.245 1.000 Phe 0.065 −0.065 0.046 1.000 Ant 0.072 0.027 −0.042 0.406* 1.000 Flu −0.073 −0.084 0.032 0.602*** 0.208 1.000 Pyr −0.087 −0.055 0.072 0.645*** 0.116 0.882*** 1.000 BaA −0.022 −0.060 −0.023 0.517** 0.274 0.759*** 0.547***1.000 Chr −0.016 −0.082 0.115 0.409* 0.275 0.775*** 0.561*** 0.828*** 1.000 BbF 0.106 −0.079 0.067 0.080 0.229 0.0730.0790.2230.0461.000 BkF 0.015 −0.126 0.048 0.472** 0.304 0.794*** 0.625*** 0.880***0.865***0.3381.000 BaP 0.016 −0.113 0.010 0.442** 0.269 0.869*** 0.688*** 0.827***0.843***0.2610.945*** 1.000 InP 0.085 −0.059 −0.050 −0.035 0.204 0.0360.1280.0770.1290.0610.2270.238 1.000 DBA 0.055 −0.114 0.033 0.455** 0.174 0.747*** 0.852***0.470** 0.530** 0.075 0.629*** 0.699*** 0.394* 1.000 B(ghi)P 0.084 −0.100 0.172 0.320 0.566*** 0.2480.1320.374*0.372*0.440**0.485** 0.321 0.086 0.193 1.000 %TOC 0.145 −0.009 0.270 0.458** 0.385* 0.358*0.338 0.534**0.629*** 0.419*0.669***0.503** 0.106 0.378* 0.697***1.000 Correlations are significant at *p < 0.05 (low significant), **p < 0.01 (moderate significant) and ***p < 0.001 (high significant). and petrogenic PAHs were observed with a major pyro- lytic predominance. REFERENCES [1] U. Varanasi, “Metabolism of PAHs in the Aquatic Envi- ronment,” CRC Press, Boca Raton, 1989. [2] C. Porte and J. Albaiges, “Bioaccumulation Patterns of Hydrocarbons and Polychlorinated Biphenyls in Bivalves, Crustacean and Fishes,” Archives of Environmental Con- tamination and Toxicology, Vol. 26, No. 3, 1993, pp. 273-281. [3] P. Baumard, H. Budzinski and P. Garrigues, “Determina- tion of Polycyclic Aromatic Hydrocarbons (Pahs) in Sediments and Mussels of the Western Mediterranean Sea,” Environmental Toxicology & Chemistry, Vol. 17, No. 5, 1998, pp. 765-776. doi:10.1002/etc.5620170501 [4] J. Y. Cho, J. G. Son, B. J. Park and B. Y. Chung, “Distri- bution and Pollution Sources of Polycyclic Aromatic Hy- drocarbons (Pahs) in Reclaimed Tidelands and Tidelands of the Western Sea Coast of South Korea,” Environ- mental Monitoring and Assessment, Vol. 149, No. 1-4, 2009, pp. 385-393. doi:10.1007/s10661-008-0214-9 [5] T. K. Benlahcen, A. Chaoui, H. Budzinski, J. Bellocq and P. Garrigues, “Distribution and Sources of Polycyclic Aromatic Hydrocarbons in Some Mediterranean Coastal Sediment,” Marine Pollution Bulletin, Vol. 34, 1997, pp. 298-305. doi:10.1016/S0025-326X(96)00098-7 [6] L. Sanchez-Garcia, J. Cato and O. Gustafsson, “Evalua- tion of the Influence of Black Carbon on the Distribution of Pahs in Sediments from along the Entire Swedish Con- tinental Shelf,” Marine Chemistry, Vol. 119, No. 1-4, 2010, pp. 44-51. doi:10.1016/j.marchem.2009.12.005 [7] J. Dachs, J. M. Bayona, J. Fillaux, A. Saliot and J. Al- baiges, “Evaluation of Anthropogenic and Biogenic In- puts into the Western Mediterranean Using Molecular Markers,” Marine Chemistry, Vol. 65, No. 3-4, 1999, pp. 195-210. doi:10.1016/S0304-4203(99)00002-X [8] M. A. Khairy, “Risk Assessment of Polycyclic Aromatic Hydrocarbons in a Mediterranean Semi-enclosed Basin Affected by Human Activities (Abu Qir Bay, Egypt),” Journal of Hazardous Materials, Vol. 170, No. 1, 2009, pp. 389-397. doi:10.1016/j.jhazmat.2009.04.084 [9] UNEP/IOC/IAEA, “Determination of Petroleum Hydro- carbons in Sediments,” Reference Methods for Marine Pollution Studies, UNEP, Vol. 20, 1992, p. 75. [10] C. T. Chiou, S. E. Mc Groddy and D. E. Kile, “Partition Characteristics of Polycyclic Aromatic Hydrocarbons on Soils and Sediments,” Environmental Science & Tech- nology, Vol. 32, No. 2, 1998, pp. 264-269. doi:10.1021/es970614c [11] E. R. Long, D. D. MacDonald, S. L. Smith and F. D. Calder, “Incidence of Adverse Biological Effects within Copyright © 2011 SciRes. JEP  PAHs in Sediments along the Semi-Closed Areas of Alexandria, Egypt709 Ranges of Chemical Concentrations in Marine and Estua- rine Sediments,” Environmental Management, Vol. 19, 1995, pp. 81-97. doi:10.1007/BF02472006 [12] USEPA, “Proposed Sediment Quality Criteria for the Protection of Benthic Organism. EPA-882-R-93-012, EPA- 882-R-93-013, EPA-882-R-93-014,” US Environ- mental Protection Agency, Office of Water, Washington, DC, 1993. [13] International Agency for Research on Cancer, “IARC Monographs on the Evaluation of the Carcinogenic Risk of Chemicals to Human. Polynuclear Aromatic Hydro- carbons, Part I, Chemical, Environmental, and Experi- mental Data,” Agency for Research on Cancer, Lyons, Vol. 32, 1983, pp. 1-477. [14] C. A. Menzie, B. B. Potocki and J. Santodonato, “Expo- sure to Carcinogenic PAHs in the Environment,” Envi- ronmental Science & Technology, Vol. 26, No. 7, 1992, pp. 1278-1284. doi:10.1021/es00031a002 [15] G. P. Yang, “Polycyclic Aromatic Hydrocarbons in the Sediments of the South China Sea,” Environmental Polls, Vol. 108, No. 2, 2000, pp. 163-171. doi:10.1016/S0269-7491(99)00245-6 [16] W. F. Rogge, L. Hildemann, M. A. Mazurek, G. R. Cass and B. R. T. Simoneit, “Sources of Fine Organic Aerosol: 2. Noncatalyst and Catalyst-Equipped Automobiles and Heavy Duty Diesel Trucks,” Environmental Science & Technology, Vol. 27, 1993, pp. 636-651. doi:10.1021/es00041a007 [17] P. M. Gschwend and R. A. Hites, “Fluxes of Polycyclic Aromatic Hydrocarbons to Marine and Lacustrine Sedi- ments in the Northeastern United States,” Geochim Cosmochim Acta, Vol. 45, 1981, pp. 2359-2367. doi:10.1016/0016-7037(81)90089-2 [18] H. H. Soclo, P. H. Garrigues and M. Ewald, “Origin of Polycyclic Aromatic Hydrocarbons (Pahs) in Coastal Ma- rine Sediments: Case Studies in Cotonou (Benin) and Aquitaine (France) Areas,” Marine Pollution Bulletin, Vol. 40, No. 5, 2000, pp. 387-396. doi:10.1016/S0025-326X(99)00200-3 [19] S. Y. N. Yang, D. W. Connell, D. W. Hawker and S. I. Kayat, “Polycyclic Aromatic Hydrocarbons in Air, Soil Land Vegetation in the Vicinity of an Urban Roadway,” Science of the Total Environment, Vol. 102, 1991, pp. 229-240. doi:10.1016/0048-9697(91)90317-8 [20] M. A. Sicre, J. C. Marty, A. Saliot, X. Aparicio, J. Gri- malt and J. Albaiges, “Aliphatic and Aromatic Hydrocar- bons in Different Sized Aerosols over the Mediterranean Sea: Occurrence and Origin,” ATM Environment, Vol. 21, 1987, pp. 2247-2259. doi:10.1016/0004-6981(87)90356-8 Copyright © 2011 SciRes. JEP
|