 Journal of Environmental Protection, 2011, 2, 855-866 doi:10.4236/jep.2011.26097 Published Online August 2011 (http://www.SciRP.org/journal/jep) Copyright © 2011 SciRes. JEP 855 Patterns of Variation of Herbivore Assemblages at Nairobi National Park, Kenya, 1990-2008 Alfred O. Owino1, Moses Lekishon Kenana2, Paul Webala3, Samuel Andanje1, Patrick O. Omondi1 1Biodiversity Research & Monitoring Division, Kenya Wildlife Service, Nairobi, Kenya; 2Nairobi National Park, Nairobi, Kenya; 3Kenya Wildlife Service Training Institute, Naivasha, Kenya. Email: Alfred@kws.go.ke Received April 5th, 2011; revised May 24th, 2011; accepted July 6th, 2011. ABSTRACT Wildlife, especially mammals populations dynamics in many conservation areas are influenced by ecosystem processes and increasingly by climate change. Generally, cyclic population dynamics is relatively common among small mam- mals, especially in high latitudes but is not yet established among many African savanna ungulates. Habitat fragmenta- tion and loss propagated by anthropogenic activities are responsible for the decline in populations of many wildlife species leading to the confinement many wildlife species particularly herbivores within parks and reserves as a con- servation measure. We assessed the patterns of variation in abundance of eight herbivore species (African Buffalo, Eland, Burchell’s Zebra, Wildebeest, Giraffe, Grant’s Gazelle, Thomson’s Gazelle and Impala) at Kenya’s Nairobi National Park using population counts data over the period 1990-2008. Overall, the eight herbivores abundances de- clined within the Park with significant declines in Wildebeest (R2 = 0.54), Grant’s Gazelle (R2 = 0.72) and Impala (R2 = 0.80). Seasonality had effects on herbivore numbers and assemblages at the Park with the numbers of individual spe- cies increasing within the Park during dry seasons compared to wet seasons (t-test, t = 4.45, p = 0.03). Land use changes and urban development, especially in the dispersal areas and the accompanying effects of climate change of reduced rainfall and longer periods of drought had significant negative impacts on herbivore assemblages at the Park. We discuss the significance of the population fluctuations of the eight species at the Park, the potential impacts of the changes on Park ecosystem processes and the expected long-term population dynamics of the species if the conditions remain as witnessed over the past two decades. Keywords: Nairobi National Park, Herbivores, Habitat Fragmentation, Climate Change 1. Introduction The monitoring of populations of wildlife species is an established management practice [1]. This implies site monitoring so that changes in the populations can be as- sessed against a standard level [2]. To define such stan- dards, natural variability must first be examined through surveillance—a repeated set of surveys conducted in a standardized manner over longer periods. Wildlife popu- lation trend analyses obtained through regular long-term censuses datasets have been of continual interest to eco- logists and wildlife management authorities [1]. Exten- sive research, especially on small mammal in the north- ern latitudes has implicated a predator-prey interaction as the most pervasive cause of population cycles [3]. In the search for general patterns of wildlife population trends, the influence of the past is largely ignored, despite sub- stantial evidence of historical constraints that may range from major events to short-term disturbances [4]. How- ever, there has been a general appreciation of the influ- ence of rainfall, food availability and periodicity in the dynamics, especially of large herbivore populations [5]. In addition, there has been a growing interest on the ef- fects of anthropogenic activities, invasive/alien species, and most recently climate change as key drivers of wild- life population trends, especially in the tropics [1,6-9]. In Africa, populations of many wildlife species have declined substantially inside and outside the protected areas [1,6,10-13]. Contributory causes include recurrent droughts [6,14,15], land-use changes [6,16], growing human settlements [17], illicit hunting [18 ] and livestock incursions into protected areas [6]. In East Africa wildlife population dynamics within many conservation areas are influenced by many factors including trophic interactions with resources [19], autocorrelated exogenous factors [20], climate change effects [5] and land use changes/ 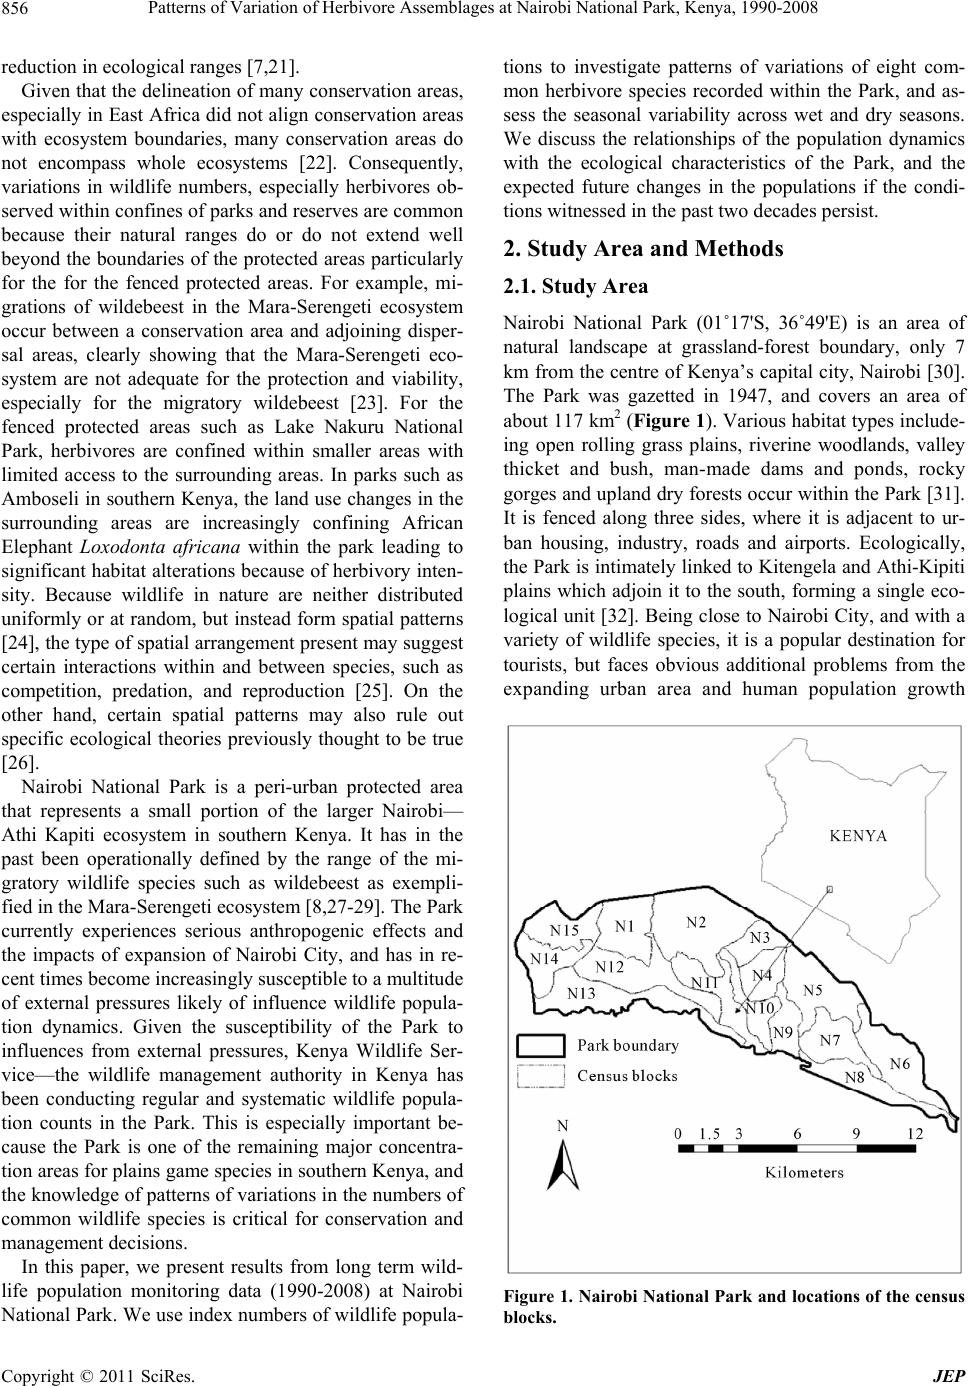 Patterns of Variation of Herbivore Assemblages at Nairobi National Park, Kenya, 1990-2008 856 reduction in ecological ranges [7,21]. Given that the delineation of many conservation areas, especially in East Africa did not align conservation areas with ecosystem boundaries, many conservation areas do not encompass whole ecosystems [22]. Consequently, variations in wildlife numbers, especially herbivores ob- served within confines of parks and reserves are common because their natural ranges do or do not extend well beyond the boundaries of the protected areas particularly for the for the fenced protected areas. For example, mi- grations of wildebeest in the Mara-Serengeti ecosystem occur between a conservation area and adjoining disper- sal areas, clearly showing that the Mara-Serengeti eco- system are not adequate for the protection and viability, especially for the migratory wildebeest [23]. For the fenced protected areas such as Lake Nakuru National Park, herbivores are confined within smaller areas with limited access to the surrounding areas. In parks such as Amboseli in southern Kenya, the land use changes in the surrounding areas are increasingly confining African Elephant Loxodonta africana within the park leading to significant habitat alterations because of herbivory inten- sity. Because wildlife in nature are neither distributed uniformly or at random, but instead form spatial patterns [24], the type of spatial arrangement present may suggest certain interactions within and between species, such as competition, predation, and reproduction [25]. On the other hand, certain spatial patterns may also rule out specific ecological theories previously thought to be true [26]. Nairobi National Park is a peri-urban protected area that represents a small portion of the larger Nairobi— Athi Kapiti ecosystem in southern Kenya. It has in the past been operationally defined by the range of the mi- gratory wildlife species such as wildebeest as exempli- fied in the Mara-Serengeti ecosystem [8,27-29]. The Park currently experiences serious anthropogenic effects and the impacts of expansion of Nairobi City, and has in re- cent times become increasingly susceptible to a multitude of external pressures likely of influence wildlife popula- tion dynamics. Given the susceptibility of the Park to influences from external pressures, Kenya Wildlife Ser- vice—the wildlife management authority in Kenya has been conducting regular and systematic wildlife popula- tion counts in the Park. This is especially important be- cause the Park is one of the remaining major concentra- tion areas for plains game species in southern Kenya, and the knowledge of pattern s of variations in the n umbers of common wildlife species is critical for conservation and management decisions. In this paper, we present results from long term wild- life population monitoring data (1990-2008) at Nairobi National Park. We use index numbers of wildlife popula- tions to investigate patterns of variations of eight com- mon herbivore species recorded within the Park, and as- sess the seasonal variability across wet and dry seasons. We discuss the relationships of the population dynamics with the ecological characteristics of the Park, and the expected future changes in the populations if the condi- tions witnessed in the p ast two decades persist. 2. Study Area and Methods 2.1. Study Area Nairobi National Park (01˚17'S, 36˚49'E) is an area of natural landscape at grassland-forest boundary, only 7 km from the centre of Kenya’s capital city, Nairobi [30]. The Park was gazetted in 1947, and covers an area of about 117 km2 (Figure 1). Various habitat types include- ing open rolling grass plains, riverine woodlands, valley thicket and bush, man-made dams and ponds, rocky gorges and up land dry forests o ccur within the Park [31]. It is fenced along three sides, where it is adjacent to ur- ban housing, industry, roads and airports. Ecologically, the Park is intimately linked to Kitengela and Athi-Kipiti plains which adjoin it to the south, forming a single eco- logical unit [32]. Being clo se to Nairobi City, and with a variety of wildlife species, it is a popular destination for tourists, but faces obvious additional problems from the expanding urban area and human population growth Figure 1. Nairobi National Park and locations of the census blocks. Copyright © 2011 SciRes. JEP 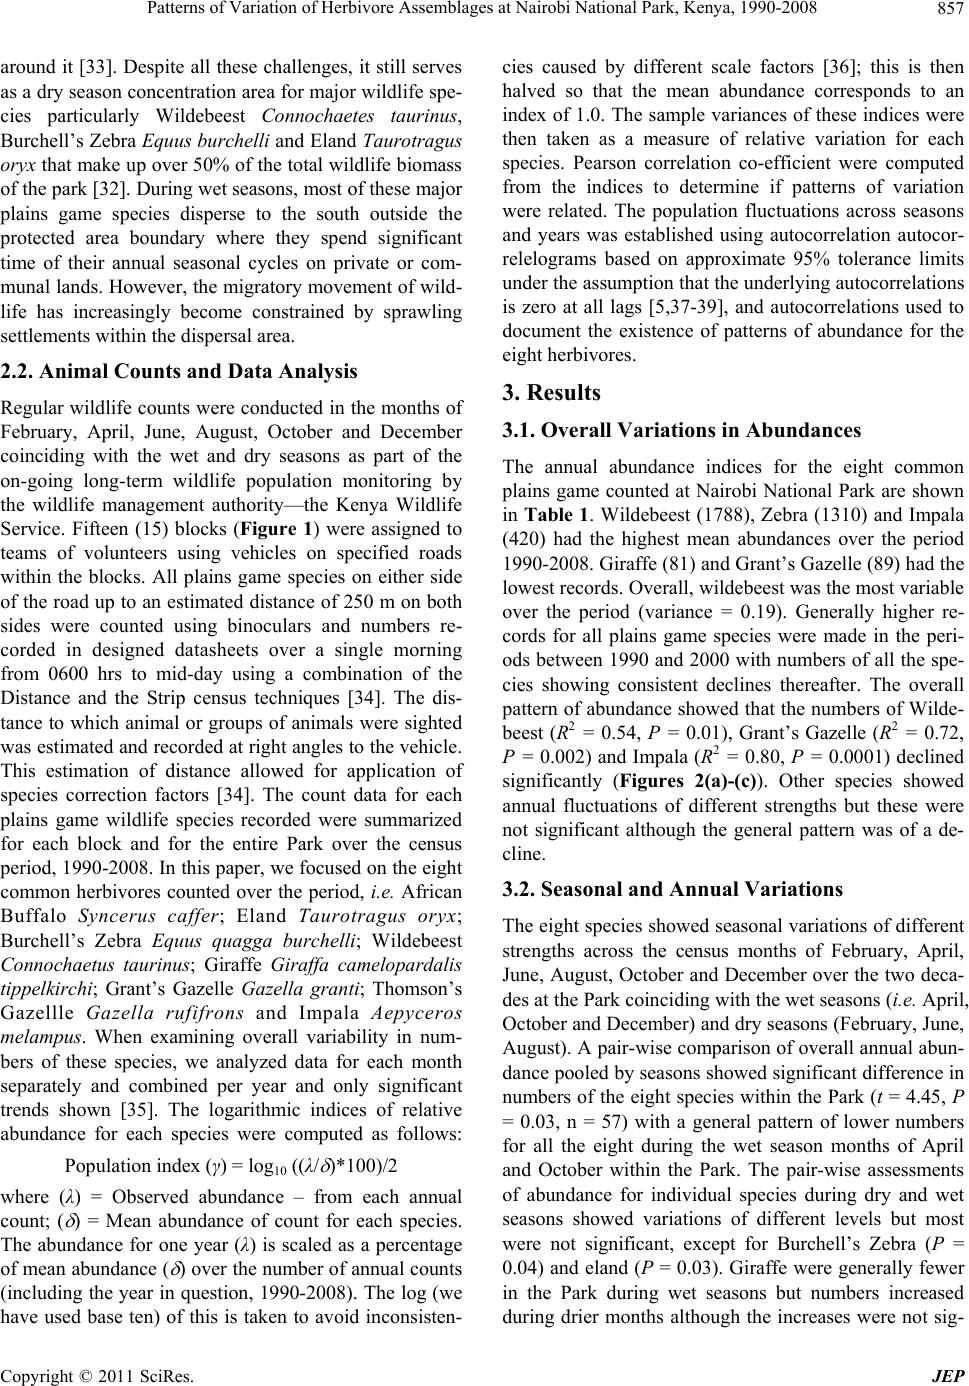 Patterns of Variation of Herbivore Assemblages at Nairobi National Park, Kenya, 1990-2008857 around it [33]. Despite all these challenges, it still serves as a dry season concentration area for major wildlife spe- cies particularly Wildebeest Connochaetes taurinus, Burchell’s Zebra Equus burchelli and Eland Taurotragus oryx that make up over 50% of the total wildlife biomass of the park [32]. During wet seasons, most of these major plains game species disperse to the south outside the protected area boundary where they spend significant time of their annual seasonal cycles on private or com- munal lands. However, the migratory movement of wild- life has increasingly become constrained by sprawling settlements within the dispersal area. 2.2. Animal Counts and Data Analysis Regular wildlife counts were conducted in the months of February, April, June, August, October and December coinciding with the wet and dry seasons as part of the on-going long-term wildlife population monitoring by the wildlife management authority—the Kenya Wildlife Service. Fifteen (15) blocks (Figure 1) were assigned to teams of volunteers using vehicles on specified roads within the blocks. All plains game species on either side of the road up to an estimated distance of 250 m on both sides were counted using binoculars and numbers re- corded in designed datasheets over a single morning from 0600 hrs to mid-day using a combination of the Distance and the Strip census techniques [34]. The dis- tance to which animal or groups of animals were sighted was estimated and recorded at right angles to the vehicle. This estimation of distance allowed for application of species correction factors [34]. The count data for each plains game wildlife species recorded were summarized for each block and for the entire Park over the census period, 1990-2008. In this paper, we focused on the eight common herbivores counted over the period, i.e. African Buffalo Syncerus caffer; Eland Taurotragus oryx; Burchell’s Zebra Equus quagga burchelli; Wildebeest Connochaetus taurinus; Giraffe Giraffa camelopardalis tippelkirchi; Grant’s Gazelle Gazella granti; Thomson’s Gazellle Gazella rufifrons and Impala Aepyceros melampus. When examining overall variability in num- bers of these species, we analyzed data for each month separately and combined per year and only significant trends shown [35]. The logarithmic indices of relative abundance for each species were computed as follows: Population index (γ) = log10 ((λ/ )*100)/2 where (λ) = Observed abundance – from each annual count; ( ) = Mean abundance of count for each species. The abundance for one year (λ) is scaled as a percentage of mean abundance ( ) over the nu mber of annu al counts (including the year in question, 1990- 2008). The log (we have used base ten) of this is taken to avoid inconsisten- cies caused by different scale factors [36]; this is then halved so that the mean abundance corresponds to an index of 1.0. The sample variances of these indices were then taken as a measure of relative variation for each species. Pearson correlation co-efficient were computed from the indices to determine if patterns of variation were related. The population fluctuations across seasons and years was established using autocorrelation autocor- relelograms based on approximate 95% tolerance limits under the assumption that the underlying autocorrelations is zero at all lags [5,37-39], and autocorrelations used to document the existence of patterns of abundance for the eight herbivores. 3. Results 3.1. Overall Variations in Abundances The annual abundance indices for the eight common plains game counted at Nairobi National Park are shown in Table 1. Wildebeest (1788), Zebra (1310) and Impala (420) had the highest mean abundances over the period 1990-2008. Giraffe (81) and Grant’s Gazelle (89) had the lowest records. Overall, wildebeest was the most variable over the period (variance = 0.19). Generally higher re- cords for all plains game species were made in the peri- ods between 1990 and 2000 with numbers of all the spe- cies showing consistent declines thereafter. The overall pattern of abund ance showed that the numbers of Wilde- beest (R2 = 0.54, P = 0.01), Grant’s Gazelle (R2 = 0.72, P = 0.002) and Impala (R2 = 0.80, P = 0.0001) declined significantly (Figures 2(a)-(c)). Other species showed annual fluctuations of different strengths but these were not significant although the general pattern was of a de- cline. 3.2. Seasonal and Annual Variations The eight species showed seasonal variations of different strengths across the census months of February, April, June, August, October and December over the two deca- des at the Park coinciding with the wet seasons (i.e. April, October and December) and dry seasons (February, June, August). A pair-wise comparison of overall annual abun- dance pooled by seasons sh owed significant d ifference in numbers of the eight species within the Park (t = 4.45, P = 0.03, n = 57) with a general pattern of lower numbers for all the eight during the wet season months of April and October within the Park. The pair-wise assessments of abundance for individual species during dry and wet seasons showed variations of different levels but most were not significant, except for Burchell’s Zebra (P = 0.04) and eland (P = 0.03). Giraffe were generally fewer in the Park during wet seasons but numbers increased during drier months although the increases were not sig- Copyright © 2011 SciRes. JEP 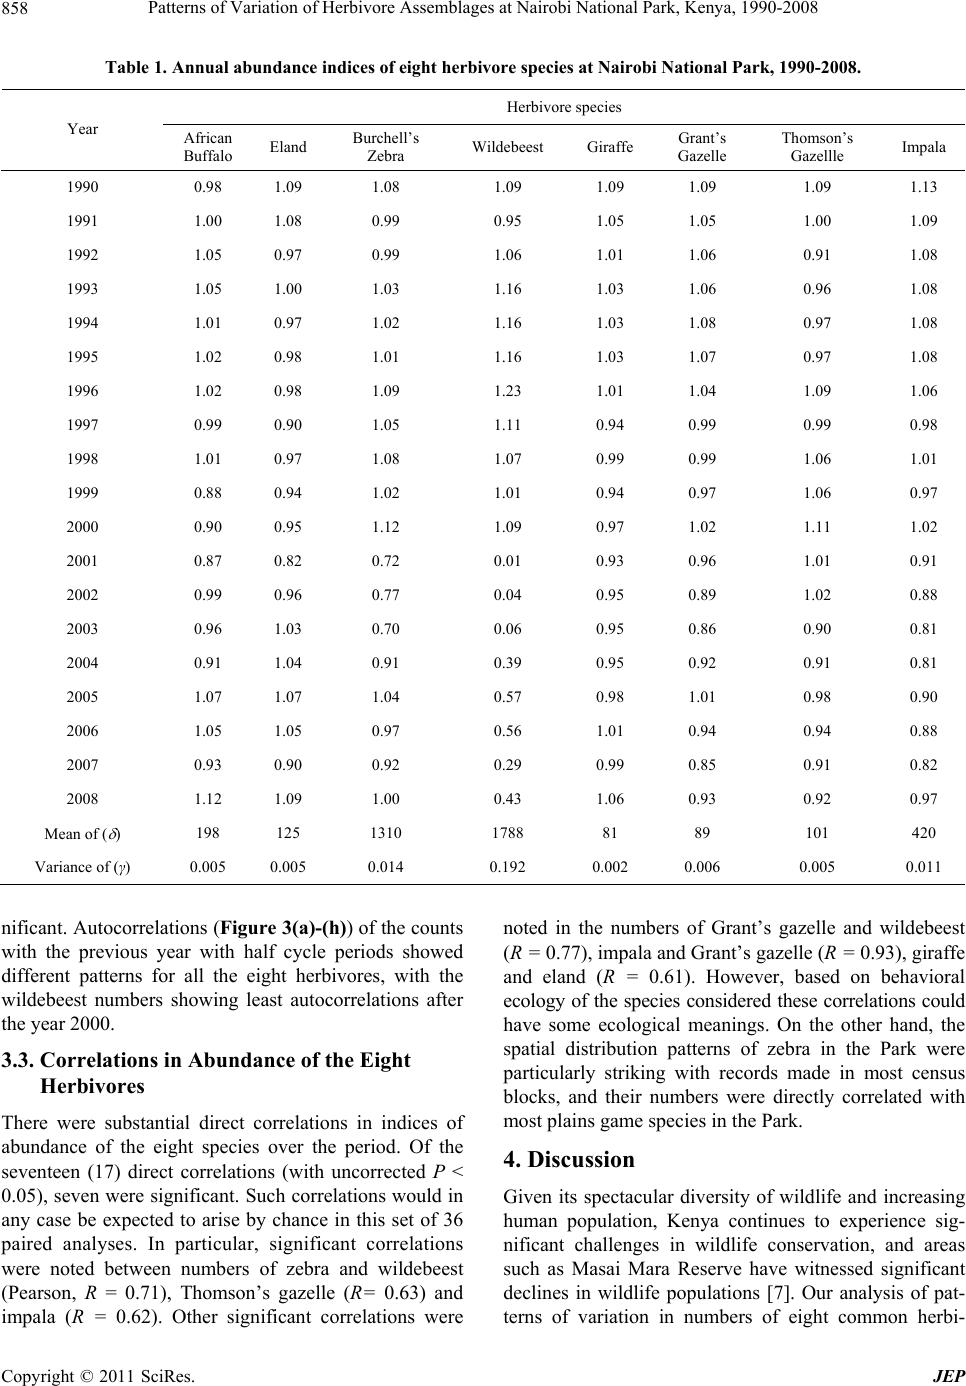 Patterns of Variation of Herbivore Assemblages at Nairobi National Park, Kenya, 1990-2008 Copyright © 2011 SciRes. JEP 858 Table 1. Annual abundance indices of eight herbivore species at Nairobi National Park, 1990-2008. Herbivore species Year African Buffalo Eland Burchell’s Zebra Wildebeest Giraffe Grant’s Gazelle Thomson’s Gazellle Impala 1990 0.98 1.09 1.08 1.09 1.09 1.09 1.09 1.13 1991 1.00 1.08 0.99 0.95 1.05 1.05 1.00 1.09 1992 1.05 0.97 0.99 1.06 1.01 1.06 0.91 1.08 1993 1.05 1.00 1.03 1.16 1.03 1.06 0.96 1.08 1994 1.01 0.97 1.02 1.16 1.03 1.08 0.97 1.08 1995 1.02 0.98 1.01 1.16 1.03 1.07 0.97 1.08 1996 1.02 0.98 1.09 1.23 1.01 1.04 1.09 1.06 1997 0.99 0.90 1.05 1.11 0.94 0.99 0.99 0.98 1998 1.01 0.97 1.08 1.07 0.99 0.99 1.06 1.01 1999 0.88 0.94 1.02 1.01 0.94 0.97 1.06 0.97 2000 0.90 0.95 1.12 1.09 0.97 1.02 1.11 1.02 2001 0.87 0.82 0.72 0.01 0.93 0.96 1.01 0.91 2002 0.99 0.96 0.77 0.04 0.95 0.89 1.02 0.88 2003 0.96 1.03 0.70 0.06 0.95 0.86 0.90 0.81 2004 0.91 1.04 0.91 0.39 0.95 0.92 0.91 0.81 2005 1.07 1.07 1.04 0.57 0.98 1.01 0.98 0.90 2006 1.05 1.05 0.97 0.56 1.01 0.94 0.94 0.88 2007 0.93 0.90 0.92 0.29 0.99 0.85 0.91 0.82 2008 1.12 1.09 1.00 0.43 1.06 0.93 0.92 0.97 Mean of ( ) 198 125 1310 1788 81 89 101 420 Variance of (γ) 0.005 0.005 0.014 0.192 0.002 0.006 0.005 0.011 nificant. Autocorrelations (Figure 3(a)-(h)) of the counts with the previous year with half cycle periods showed different patterns for all the eight herbivores, with the wildebeest numbers showing least autocorrelations after the year 2000. 3.3. Correlations in Abundance of the Eight Herbivores There were substantial direct correlations in indices of abundance of the eight species over the period. Of the seventeen (17) direct correlations (with uncorrected P < 0.05), seven were significant. Such correlations would in any case be expected to arise by chance in this set of 36 paired analyses. In particular, significant correlations were noted between numbers of zebra and wildebeest (Pearson, R = 0.71), Thomson’s gazelle (R= 0.63) and impala (R = 0.62). Other significant correlations were noted in the numbers of Grant’s gazelle and wildebeest (R = 0.77), impala and Grant’s gazelle (R = 0.93), giraff e and eland (R = 0.61). However, based on behavioral ecology of the species considered these correlations could have some ecological meanings. On the other hand, the spatial distribution patterns of zebra in the Park were particularly striking with records made in most census blocks, and their numbers were directly correlated with most plains game species in the Park. 4. Discussion Given its spectacular diversity of wildlife and increasing human population, Kenya continues to experience sig- nificant challenges in wildlife conservation, and areas such as Masai Mara Reserve have witnessed significant declines in wildlife populations [7]. Our analysis of pat- terns of variation in numbers of eight common herbi- 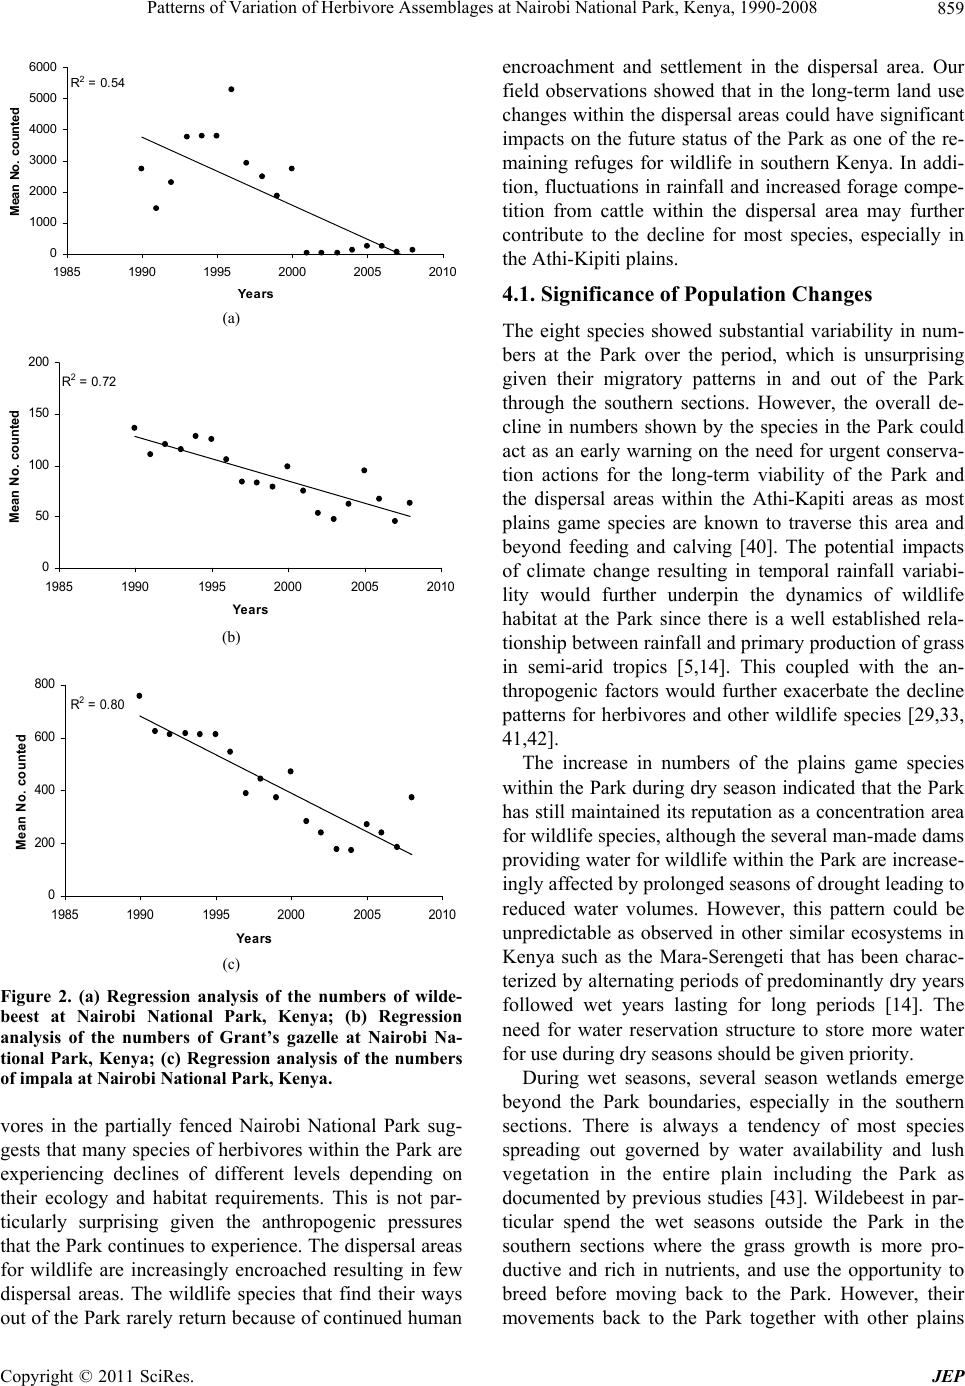 Patterns of Variation of Herbivore Assemblages at Nairobi National Park, Kenya, 1990-2008859 R 2 = 0.54 0 1000 2000 3000 4000 5000 6000 1985 1990 1995 2000 2005 2010 Years Mean No. counted (a) R 2 = 0.72 0 50 100 150 200 1985 19901995 20002005 2010 Year s Me an No. co u nted (b) R 2 = 0. 80 0 200 400 600 800 1985 19901995 20002005 2010 Years Mean No. counted (c) Figure 2. (a) Regression analysis of the numbers of wilde- beest at Nairobi National Park, Kenya; (b) Regression analysis of the numbers of Grant’s gazelle at Nairobi Na- tional Park, Kenya; (c) Regression analysis of the numbers of impala at Nairobi National Park, Kenya. vores in the partially fenced Nairobi National Park sug- gests that many species of herbivore s within the Park ar e experiencing declines of different levels depending on their ecology and habitat requirements. This is not par- ticularly surprising given the anthropogenic pressures that the Park continue s to experien ce. Th e dis pers al ar eas for wildlife are increasingly encroached resulting in few dispersal areas. The wildlife species that find their ways out of the Park rarely return because of continued human encroachment and settlement in the dispersal area. Our field observations showed that in the long-term land use changes within the dispersal areas could have significant impacts on the future status of the Park as one of the re- maining refuges for wildlife in southern Kenya. In addi- tion, fluctuations in rainfall and increased forage compe- tition from cattle within the dispersal area may further contribute to the decline for most species, especially in the Athi-Kipiti plains. 4.1. Significance of Population Changes The eight species showed substantial variability in num- bers at the Park over the period, which is unsurprising given their migratory patterns in and out of the Park through the southern sections. However, the overall de- cline in numbers shown by the species in the Park could act as an early warning on the need for urgent conserva- tion actions for the long-term viability of the Park and the dispersal areas within the Athi-Kapiti areas as most plains game species are known to traverse this area and beyond feeding and calving [40]. The potential impacts of climate change resulting in temporal rainfall variabi- lity would further underpin the dynamics of wildlife habitat at the Park since there is a well established rela- tionship between rainfall and primary production of grass in semi-arid tropics [5,14]. This coupled with the an- thropogenic factors would further exacerbate the decline patterns for herbivores and other wildlife species [29,33, 41,42]. The increase in numbers of the plains game species within the Park during dry season indicated that the Park has still maintained its reputation as a concentration area for wildlife species, although the several man-made dams providing water for wildlife within the Park are increase- ingly affected by prolonged seasons of drought leading to reduced water volumes. However, this pattern could be unpredictable as observed in other similar ecosystems in Kenya such as the Mara-Serengeti that has been charac- terized by alternating periods of predominantly d ry years followed wet years lasting for long periods [14]. The need for water reservation structure to store more water for use during dry seaso ns s hould be given priority. During wet seasons, several season wetlands emerge beyond the Park boundaries, especially in the southern sections. There is always a tendency of most species spreading out governed by water availability and lush vegetation in the entire plain including the Park as documented by previous studies [43]. Wildebeest in par- ticular spend the wet seasons outside the Park in the southern sections where the grass growth is more pro- ductive and rich in nutrients, and use the opportunity to breed before moving back to the Park. However, their movements back to the Park together with other plains Copyright © 2011 SciRes. JEP  Patterns of Variation of Herbivore Assemblages at Nairobi National Park, Kenya, 1990-2008 Copyright © 2011 SciRes. JEP 860 (a) (b) 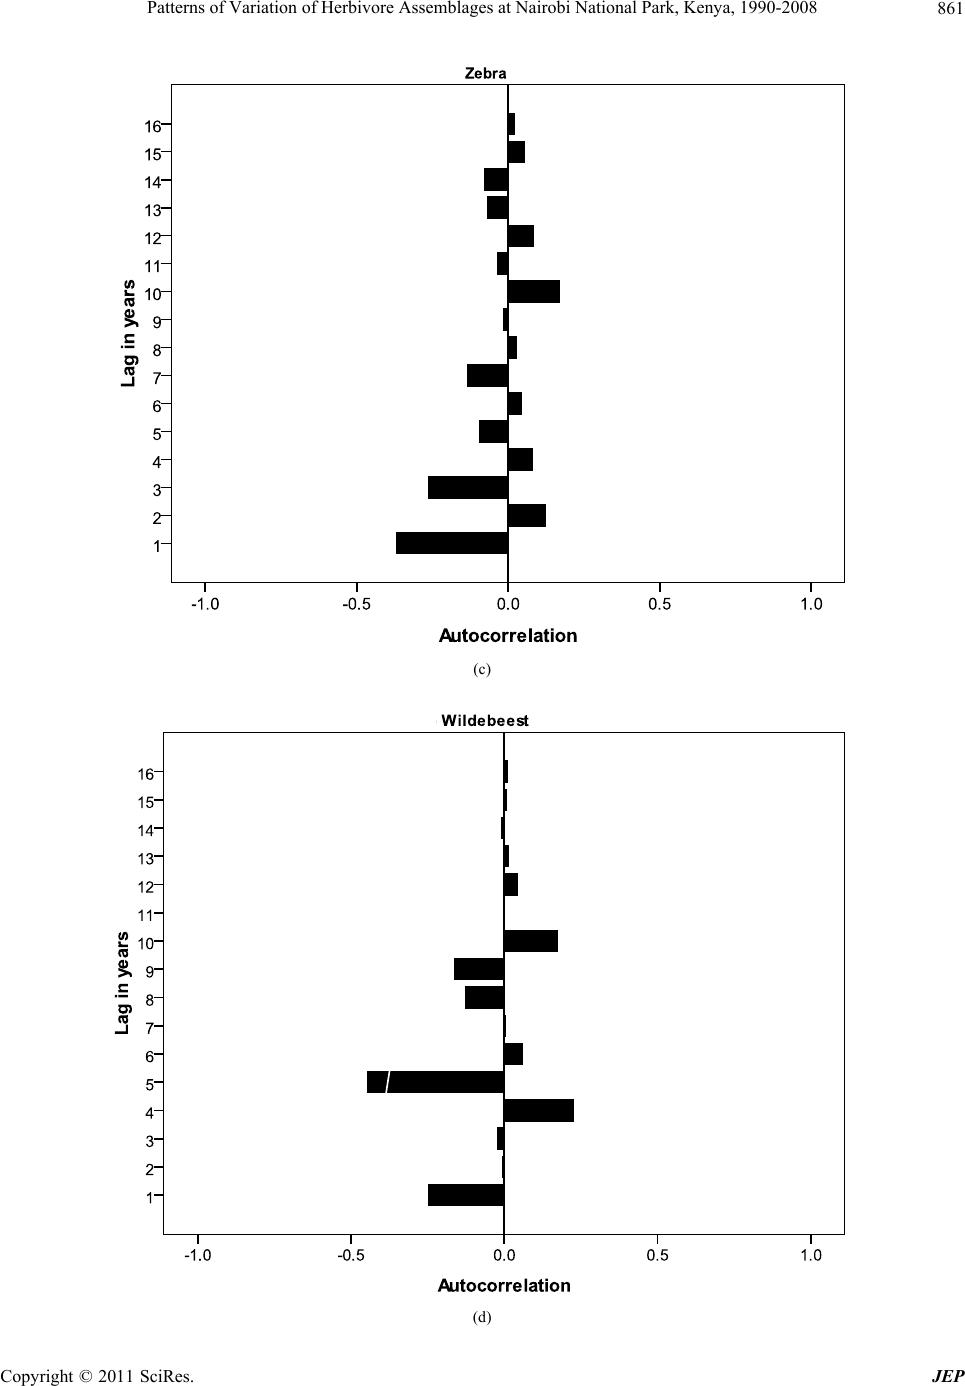 Patterns of Variation of Herbivore Assemblages at Nairobi National Park, Kenya, 1990-2008861 (c) (d) Copyright © 2011 SciRes. JEP 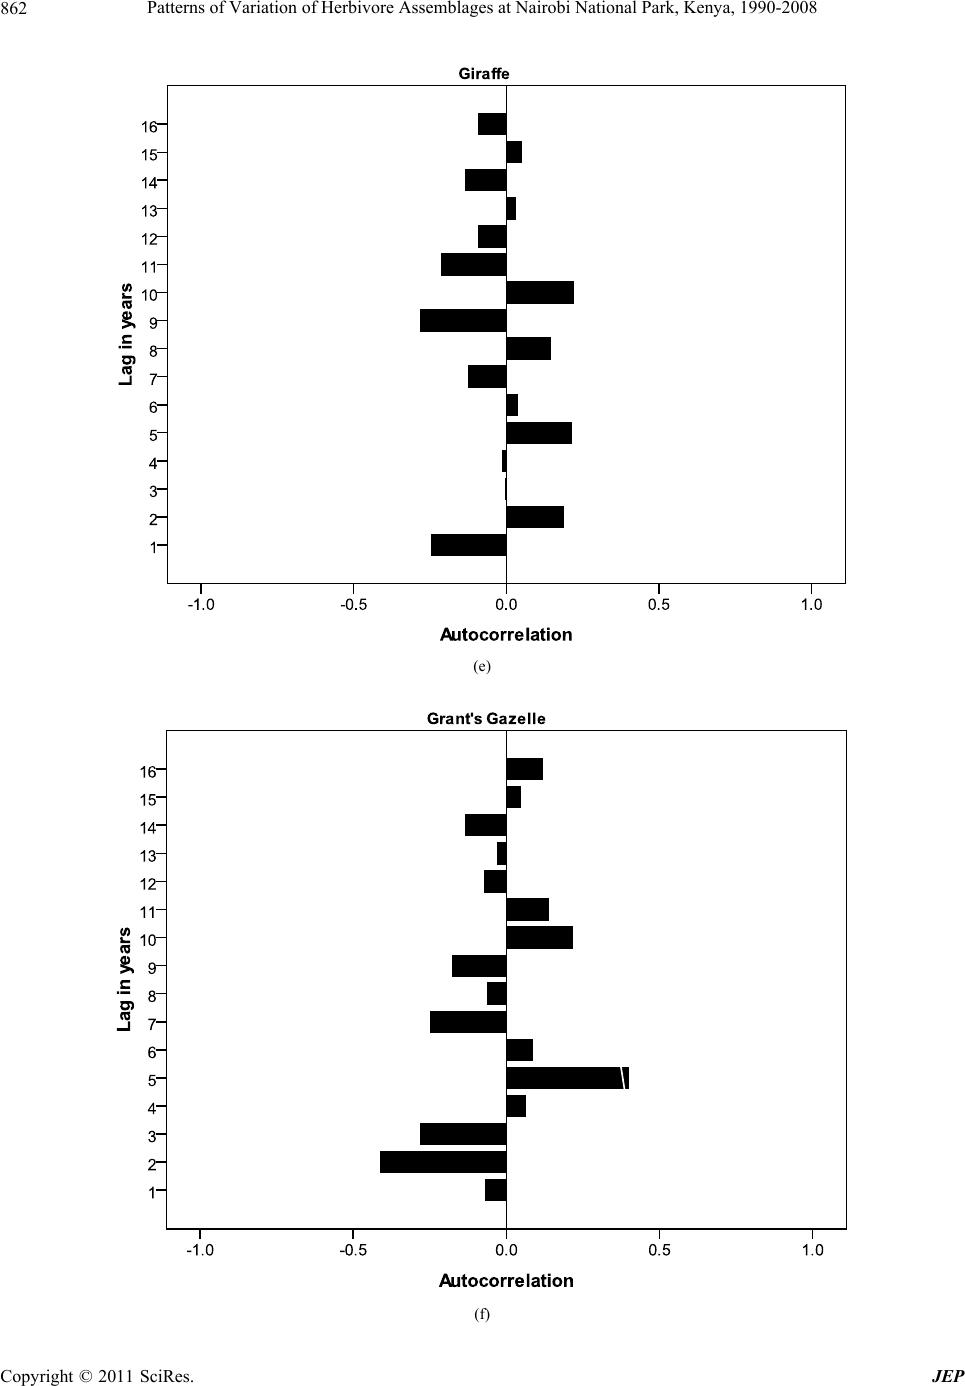 Patterns of Variation of Herbivore Assemblages at Nairobi National Park, Kenya, 1990-2008 862 (e) (f) Copyright © 2011 SciRes. JEP 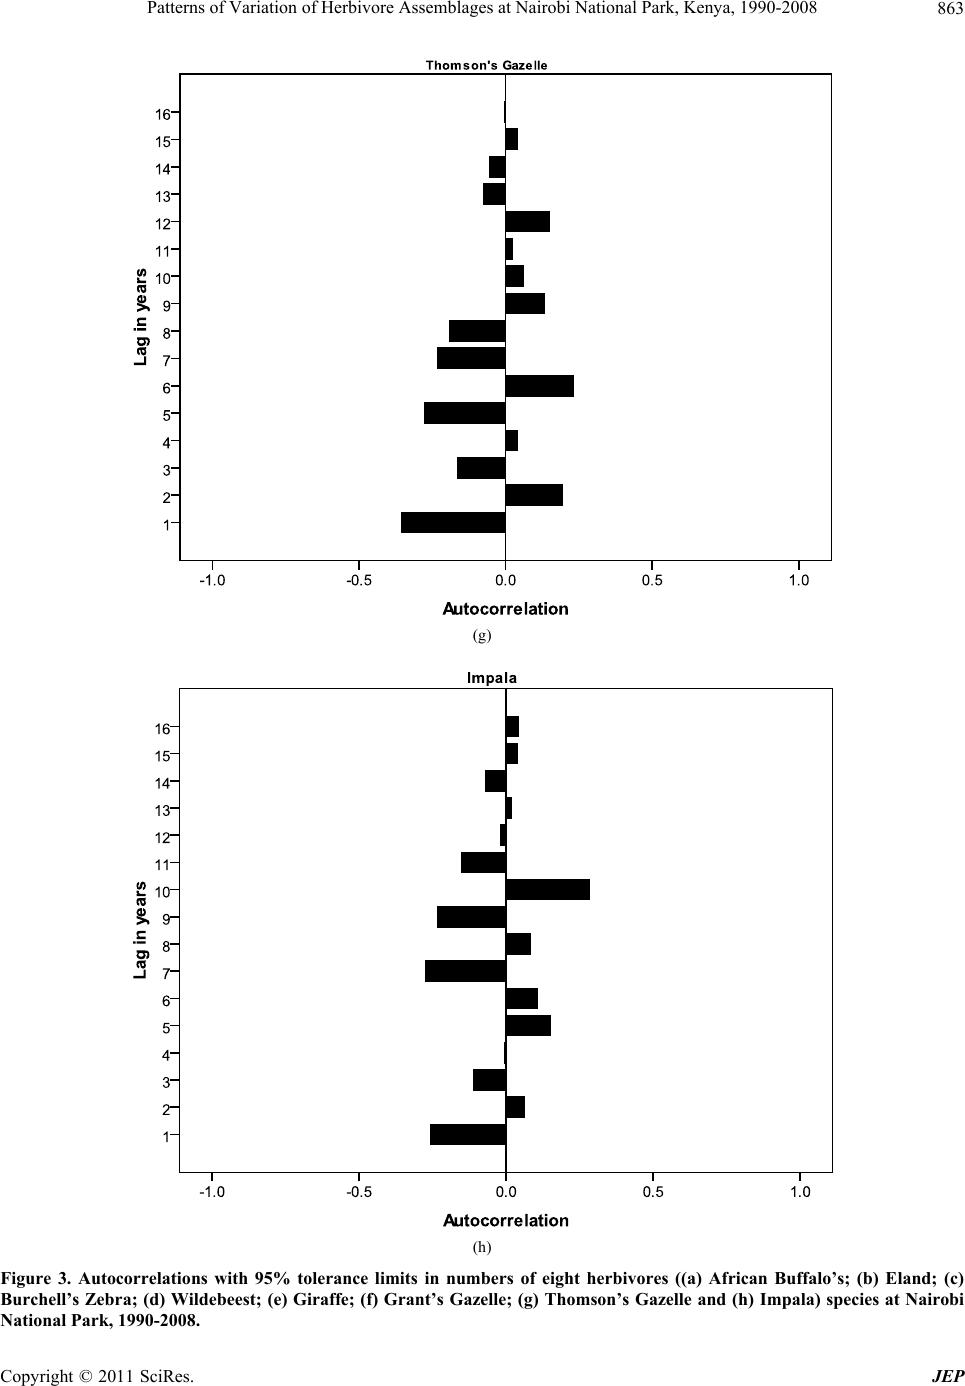 Patterns of Variation of Herbivore Assemblages at Nairobi National Park, Kenya, 1990-2008863 (g) (h) Figure 3. Autocorrelations with 95% tolerance limits in numbers of eight herbivores ((a) African Buffalo’s; (b) Eland; (c) Burchell’s Zebra; (d) Wildebeest; (e) Giraffe; (f) Grant’s Gazelle; (g) Thomson’s Gazelle and (h) Impala) species at Nairobi National Park, 1990-2008. Copyright © 2011 SciRes. JEP  Patterns of Variation of Herbivore Assemblages at Nairobi National Park, Kenya, 1990-2008 Copyright © 2011 SciRes. JEP 864 cing challenges due to dimi- bility of Indication how correlated further evident that patterns of ation for long-term he 5. Acknowledgements nitoring programme is con- monitoring and assessment [1] C. Stoner, T. Cgwa, G. Sabuni, M. Borner and C Large Herbivore ame appear to experieng nishing space. This could explain their patterns as shown by autocorrelations after year 2000. Human settlements and livestock grazing within the dispersal area increased after the year 2000, and this has limited the movements of wildebeest and other plains game species to and from the Park. 4.2. Relia Wildlife species with similar ecology do s patterns at specific sites, although not with complete consistency but the reliability of population estimates derived from censuses can be affected by counting errors and biases as animal numbers may be underestimated due to vegetation cover, especially for ground censuses [35,44]. However, our results still confirmed and ex- tended patterns as documented from analysis of a subsec- tion of the K ruger data [5]. From our analyses, it was Pop variations for browsing species such as giraffes and elands were partly attributed to their ecology. These spe- cies feed mainly in browse, and fluctuations in their numbers within the Park were inter-correlated. These correlations make sens e, but it is difficult to interp ret the links between them, except in terms of overarching vari- ables such as browse quality and availability. The ob- served correlation patterns for Burchell’s Zebra with the abundances of other herbivores reaffirms the role of ze- bra in the vegetation succession within the Park. These ultimately influence abundance and distribution of other herbivores [45]. The repercussions resulting from indi- rect effects of rearrangement of wildlife communities and changes in the patterns of inter-specific interactions [45] will probably transfor m the character of wildlife species’ interactions and fundamental ecosystem processes in unforeseen ways in the Park [14,45]. Our analyses provide useful inform rbivore populations’ management at Nairobi National Park as they show long-term patterns of variations in numbers under a changing habitat condition. This would be important for the long-term conservation and mana- gement of wildlife in the Park. The continuation of monitoring of wildlife population through regular census would be essential as has been done over the past two decades. However, there is still need for collection of additional and complimentary information of biotic and abiotic information to allow for more focused analyses. Specific research topics linking wildlife population fluc- tuation patterns with the potential impacts of climate change and anthropogenic effects would be useful. In addition, land use planning and management of wildlife corridors and dispersal areas require considerable atten- tion from all wildlife management stakeholders. The wildlife census and mo ducted as part of biodiversity by Kenya Wildlife Service for all conservation areas in the country. We thank Nairobi National Park manage- ment and volunteers who have over the years participated in these counts since the programme was initiated. We further thank anonymous reviewers who provided com- ments and suggestions on this manuscript. REFERENCES aro, S. Mduma, C. Mlin . Schelten, “Changes in ulations across Large Areas of Tanzania,” African Journal of Ecology, Vol. 45, No. 2, 2006, pp. 202-215. doi:10.1111/j.1365-2028.2006.00705.x [2] J. M. Hellawell, “Development of a Rationale for Mon toring,” In: F. B. Goldsmith, Ed., Mon i- itoring for Con- servation and Ecology, Chapman & Hall, London, 1991, pp. 1-14. doi:10.1007/978-94-011-3086-8_1 [3] N. C. Stenseth, “Population Cycles in Voles and Lem- mings: Density Dependence in a Stochastic World,” Oikos, Vol. 87, No. 3, 1999, pp. 427-461. doi:10.2307/3546809 [4] J. Fjeldsa, E. Lambin and B. Mertens, “ tween Endemism and Correlation be- Local Ecoclimatic Stability Docu- mented by Comparing Andean Bird Distributions and Remotely Sensed Land Surface Data”, Ecography, Vol. 22, No. 1, 1999, pp. 63-78. doi:10.1111/j.1600-0587.1999.tb00455.x [5] J. O. Ogutu and N. Owen-S Mammal Populations: Are They Related to mith, “Oscillations of Large Predation or Rainfall?” African Journal of Ecology, Vol. 43, No. 4, 2005, pp. 332-339. doi:10.1111/j.1365-2028.2005.00587.x [6] J. O. Ogutu, H. P. Piepho, H. T. Dublin, N S. Reid, “Dynamics of Mara-Serengeti U. Bhola and R. ngulates in Rela- tion to Land Use Changes,” Journal of Zoology, Vol. 278, No. 1, 2009, pp. 1-14. doi:10.1111/j.1469-7998.2008.00536.x [7] J. O. Ogutu, N. Owen- Said, “Continuing Wildlife Populatio Smith, H. P. Piepho and M. Y. n Declines and e Non- Range Contraction in the Mara Region of Kenya during 1977-2009,” Journal of Zoology, 2011, pp. 1-11. [8] W. K., Ottichilo, J. De Leeuw, A. K. Skidmore, H. H. T. Prins and M. Y. Said, “Population Trends of Larg migratory Wild Herbivores and Livestock in the Maasai Mara Ecosystem, Kenya, between 1977 and 1997,” Afri- can Journal of Ecology, Vol. 38, No. 3, 2000, pp. 202-216. doi:10.1046/j.1365-2028.2000.00242.x [9] B. M. Fitzgerald and J. A. Gibb, “Introduced Mammals in a New Zealand Forest: Long-Term Research in the Oron- gorongo Valley,” Biological Conservation, Vol. 99, No. 1, 2001, pp. 97-108. doi:10.1016/S0006-3207(00)00190-7 [10] N. Owen-Smith and M. G. L. Mills, “Manifold Interactive  Patterns of Variation of Herbivore Assemblages at Nairobi National Park, Kenya, 1990-2008865 Influences on the Population Dynamics of a Multispecies Ungulate Assemblage,” Ecological Monographs, Vol. 76, No. 1, 2006, pp. 73-92. doi:10.1890/04-1101 [11] T. Caro and P. Scholte, “When Protection Falters,” Afri- can Journal of Ecology, Vol. 45, No. 3, 2007, pp. 233- 235. doi:10.1111/j.1365-2028.2007.00814.x [12] G. Harris, S. Thirgood, J. G. C. Hopcraft, J. P. G. M. Cromsigt and J. Berger, “Global Decline in Aggregated Migrations of Large Terrestrial Mammals,” Endangered Species Research, Vol. 7, No. 1, 2009, pp. 55-76. doi:10.3354/esr00173 [13] D. Western, S. Russell and I. Cuthill, “The St Wildlife in Protected Aa reas Compared to Non-protected tus of Areas of Kenya” PLoS ONE, Vol. 4, No. 7, 2009, e6140. doi:10.1371/journal.pone.0006140 [14] J. O. Ogutu, H. P. Piepho, H. T. Dublin, N. Bhola and R. S. Reid, “El Nino-Southern Oscillation, Rainfall, Tem- perature and Normalized Difference Vegetation Index fluctuations in the Mara-Serengeti Ecosystem,” African Journal of Ecology, Vol. 46, No. 2, 2007, pp. 132-143. doi:10.1111/j.1365-2028.2007.00821.x [15] J. O. Ogutu, H. P. Piepho, H. T. Dublin, N. Bhola and R. S. Reid, “Rainfall Influences on Ungulate Population Abundance in the Mara-Serengeti Ecosystem,” Journal of Animal Ecology, Vol. 77, No. 4, 2008, pp 814-829. doi:10.1111/j.1365-2656.2008.01392.x [16] M. Thompson and K. Homewood, “Entrepreneurs, and Exclusion in Maasailand: Trends inElites Wildlife Conser- vation and Pastoralist Development,” Human Ecology, Vol. 30, No. 1, 2002, pp. 107-138. doi:10.1023/A:1014519113923 [17] M. Norton-Griffiths, M. Y. Said, S. Se M. Coughenour, R. H. Lamprey,rneels, D. S. Kae lo, D. M. Thompson and R ent to . S. Reid, “Land Use Economics in the Mara Area of the Serengeti Ecosystem,” In C. Packer and A. R. E. Sinclair, Eds., Serengeti III: Human Wildlife Interactions, Univer- sity of Chicago Press, Chicago, 2009, pp. 379-416. [18] M. Loibooki, H. Hofer, K. L. I. Cambpbell and M. L. East, “Bushmeat Hunting by Communities Adjac the Serengeti National Park, Tanzania: The Importance of Livestock Ownership and Alternative Sources of Protein and Income,” Environmental Conservation, Vol. 29, No.3, 2002, pp. 391-398. doi:10.1017/S0376892902000279 [19] P. Turchin, “Complex Population Dynamics: A Theoreti- cal/Empirical Synthesis,” Princeton University Press n of Delayed Density Dependence,” , Princeton, 2003. [20] L. Jiang and N. Shao, “Autocorrelated Exogenous Factors and the Detectio Ecology, Vol. 84, No. 8, 2003, pp. 2208-2213. doi:10.1890/02-0557 [21] H. H. T. Prins and H. Olff, “Species-Richness of Grazer Assemblages: Towards African a Functional Explanation,” ed Wildlife Sanctuary Site in Maasi of Resident Wildebeest [Connochaetes Taur- In: D. M. Newbery, H. H. T. Prins and N. Brown, Eds., Dynamics of Tropical Communities, Blackwell Science Ltd., London, 1998. [22] M. Okello, “An Assessment of the Large Mammal Com- ponent of the Propos Kuku Group Ranch near Amboseli, Kenya,” South Afri- can Journal of Wildlife Research, Vol. 35, No. 1, 2005, pp. 63-76. [23] W. K. Ottichilo, J. de Leeuw and H. H. T. Prins, “Popula- tion Trends inus Hecki (Neumann)] and Factors Influencing Them in the Masai Mara Ecosystem, Kenya,” Biological Conser- vation, Vol. 97, No. 3, 2001, pp. 271-282. doi:10.1016/S0006-3207(00)00090-2 [24] P. Legendre and M. J. Fortin, “Spatial Patte gical Analysis,” Plant Ecology, Vol. 8rn and Ecolo- 0, No. 2, 1989, pp. 107-138. doi:10.1007/BF00048036 [25] J. N. Perry, A. M. Liebhold, M. S. Rosenberg, J. Dungan, M. Miriti, A. Jakomulska and S. Citron-Pousty, “Illustra- tions and Guidelines for Selecting Statistical Methods for Quantifying Spatial Pattern in Ecological Data,” Ecography, Vol. 25, No. 5, 2002, pp. 578-600. doi:10.1034/j.1600-0587.2002.250507.x [26] A. M. Liebhold and J. Gurevitch “Integrating tical Analysis of Spatial Data in Ecologthe Statis- y,” Ecography, Vol. 25, No. 5, 2002, pp. 553-557. doi:10.1034/j.1600-0587.2002.250505.x [27] M. D. Broten and M. Said, “Population Trends lates in and Around Kenya’s Maasai MaOf Ungu- ra Reserve,” In: ture for Pastor- A. R. E. Sinclair and P. Arcese, Eds., Serengeti II: Dy- namics, Management and Conservation of an Ecosystem, University of Chicago Press, Chicago, 1995, pp. 169-193. [28] J. O. Ogutu, “Herbivore Dynamics in the Mara Area of Kenya: The Influence of Land Use Change, Climate and Predators,” Shaker Verlag, Aachen, 2000. [29] R. Lamprey and R. S. Reid, “Expansion of Human Set- tlement in Kenya’s Maasai Mara: What Fu alism and Wildlife?” Journal of Biogeography, Vol. 31, No. 6, 2004, pp. 997-1032. doi:10.1111/j.1365-2699.2004.01062.x [30] L. A. Bennun and P. Njoroge, “Important Bird Kenya,” East Africa Natural History Areas in Society, Nairobi, P. Bauer, “Game or Cattle for Meat Production on Athi-Kaptei Plains,” PhD Thesis, University e Corridor Links between d Nature Reserve Annual Game Count,” Re- 1999. [31] R. E. McDowell, D. S. Sisler, C. Schermerhon, J. D. Reed and R. Kenyan Rangelands? Cornell International Agriculture Mimeo 101,” Cornell University, Ithaca, New York, 1983. [32] H. W. Gichohi, “The Ecology of a Truncated Ecosys- tem— The of Leicester, Leicester, 1996. [33] H. W. Gichohi, “Direct Payments as a Mechanism for Conserving Important Wildlif Nairobi National Park and Its Wider Ecosystem: The Wildlife Conservation Lease Programme,” Proceedings of the 5th World Parks Congress, Durban, 8-17 Septem- ber 2003. [34] N. Odendaal, D. Shaw and A. Keding, “Results of the Namib Ran port of NamibRand Nature Reserve, Maltahöhe, 12 Au- gust 2007. [35] A. O. Owino, J. O. Oyugi, O. O. Nasirwa and L. A. Ben- Copyright © 2011 SciRes. JEP  Patterns of Variation of Herbivore Assemblages at Nairobi National Park, Kenya, 1990-2008 Copyright © 2011 SciRes. JEP 866 rns of Variation in Waterbird Numbers onnun, “Patte Four Rift Valley Lakes in Kenya, 1991-1999,” Hydrobi- ologia, Vol. 458, 2001, pp.45-53. doi:10.1023/A:1013115724138 [36] T. J. Crawford, “The Calculation o Wildlife Monitoring Data,” In: F. f Index Numbers from B. Goldsmith, Ed., Monitoring for Conservation and Ecology, Chapman and Hall, London, 1991, pp. 225-248. doi:10.1007/978-94-011-3086-8_12 [37] M. J. Fortin, M. R. T. Dale and J. ve Analysis in Ecology,” Encyclopedia r Hoef, “Spatia of Environm ridge University Press, nces of Sampling Dynamic Popu- l etrics, Vol. 4, 2002, pp. 2051-2058. [38] M. J. Fortin, R. Mark and T. Dale, “Spatial Analysis: A Guide for Ecologists,” Camb Cambridge, 2005. [39] P. C. Tobin, “Estimation of the Spatial Autocorrelation Function: Conseque lations in Space and Time,” Ecography, Vol. 27, No. 6, 2004, pp. 765-775. doi:10.1111/j.0906-7590.2004.03977.x [40] J. C. Hillman, “The Bio Pallas in the Wild,” PhD. Thesis, Univ logy of Eland Taurotragus oryx ersity of Nairobi, and R. L. Kruska, “Loss and . Sitati, “Human-Elephant Conflicts in the Maasai ebeer, “Distribution, “Counting Animals. Handbook tenseth, A. Mysterud, G. Ottersen, J. W. Hurrell, K. S Nairobi, 1979. [41] R. S., Reid, P. K. Thornton Fragmentation of Habitat for Pastoral People and Wildlife in East Africa: Concept and Issues,” South African Jour- nal of Grass and Forage Science, Vol. 21, 2004, pp. 171- 181. [42] N. W Mara Dispersal Areas of Transmara District,” PhD. The- sis, University of Kent, Kent, 2003. [43] J. C. B. Peterson and R. L. Cas Population Status and Group Composition of Wildebeest and Zebra on the Athi-Kaptei Plains,” Kenya Wildlife Management Project UNDP/FAO/KEN/71/526 Report No. 1, Nairobi, 1972. [44] M. Norton-Griffiths, No.1,” African Wildlife Leadership Foundation, Nairobi, 1978, [45] N. C. S . Chan and M. Lima, “Ecological Effects of Climate fluctuations,” Science, Vol. 297, No. 5585, 2002, pp. 1292-1296. doi:10.1126/science.1071281
|