International Journal of Geosciences, 2011, 2, 336-347
doi:10.4236/ijg.2011.23036 Published Online August 2011 (http://www.SciRP.org/journal/ijg)
Copyright © 2011 SciRes. IJG
Spontaneous Combustibility Characterisation of the
Chirimiri Coals, Koriya District, Chhatisgarh, India
Durga Shankar Pattanaik1, Purnananda Behera2, Bijay Singh3
1,2P.G. Department o f Ge ology, Utkal University, Bhubaneswar, Orissa, Indi a
3University Department of Ge ol o gy , Ra nchi Universi t y , R a nchi, Jharkhand, India
E-mail: ds_pattnaik@yahoo.com, purnananda.behera@gmail.com , bsingh6029@gmail.com
Received April 24, 2011; revised June 10, 2011; accepted July 19, 2011
Abstract
Representative coal samples were collected from different coal seams of the Chirimiri coalfield which cov-
ered the entire stratigraphic sequence. These samples were tested for Chemical analysis, Crossing Point
Temperature (CPT), Petrography, Infrared studies (IR) and Differential Thermal Analysis (DTA). All the test
results vindicated that the aforesaid parameters had a definite relationship with the stratigraphic disposition
or the ranks of coal. The low rank coals found as younger seams in the stratigraphic sequence were more
prone to spontaneous combustion whereas the higher rank coals found at the bottom of stratigraphic se-
quence were less prone to spontaneous combustion. Through combustibility characterisation by different
tests, it was found that the upper Duman and Kaperti seams placed as younger seams in the stratigraphic se-
quence are highly prone to spontaneous combustion whereas the lower Karakoh and Sonawani seams seem
to be least prone to spontaneous combustion.
Keywords: Chirimiri Coalfield, Crossing Point Temperature (CPT), Infrared (IR) Studies, Differential
Thermal Analysis (DTA), Spontaneous Combustion
1. Introduction
Spontaneous combustion of coal is a major hazard in
coal mines. It not only causes huge loss of coal resources
but also poses a great threat to the environment as well as
life of the mine workers.
Fires in coal mines could be anthropogenic, induced
from nearby fire affected seams or due to spontaneous
combustion which is a common phenomenon. Oxidation
of coal is an exothermic process and if the heat generated
is allowed to accumulate, the accumulated temperature
ignites the coal. This phenomenon is called spontaneous
combustion. This is a perennial problem in coal mines
everywhere. In India, spontaneous combustion is seen in
all major coalfields like Raniganj, Jharia, Karanpura,
Bokaro, Ib-valley, Talcher etc. Chirimiri coalfield of
Chhatisgarh is no exception.
Fire gases are liberated due to oxidation of coal in
sealed off mines. Monitoring fire gases is the main tool
for determination of fire status. On that basis different
fire indices can be determined for examining the extent
of fire and for devising efficient combat methods [1].
Mishra [2] did some work to characterise the petrog-
raphy of Chirimiri co als. Panigrahi and Sahu [3] con trib-
uted significantly on the nature of the spontaneous com-
bustibility in coals and found that seams having crossing
point temperature (CPT) in the range of 122˚C to 140˚C
are highly susceptible to spontaneous combustion and
between 140˚C to 170˚C are moderately susceptible to
spontaneous combustion. Further they classified the
Chirimiri coals with respect to their spontaneous heating
susceptibility by neutral approach. Jain [4] made an as-
sessment of spontaneous heating susceptibility by using
Differential Thermal Analysis (DTA) method. Singh et
al. [1] have devised some fire indices to be used for as-
sessing the spontaneous heating susceptibility.
Many physical and chemical parameters are responsi-
ble for spontaneous combustion in coal mines. In this
paper, an attempt has been made to characterise the
Chirimiri coals for their susceptibility to spontaneous
combustion by studying their geology, chemistry, CPT,
petrography, IR studies and DTA.
2. General Geology
The Chirimiri coalfield in Koriya district of Chhatisgarh
D. S. PATTANAIK ET AL.337
is a part of Son-valley basin. It falls within 23˚08'N and
23˚15'N latitudes and 82˚17'E and 82˚25'E longitudes
and covers an area of 130 sq. km. This coalfield has a
unique physiographic setting. Unlike other Gondwana
basins, this coalfield is marked by high hills with steep
scarp faces and deep gorges along the course of stream
flows. The mean altitude is about 650 m above mean sea
level (MSL) which is unique as compared with other
Gondwana coalfields in India. This coalfield forms a
plateau amidst the surrounding plains formed by Talchir
sediments. The geological map of Chirimiri coalfield is
shown in Figure 1.
2.1. Stratigraphic Formations
2.1.1. Precambrians
The Precambrian rocks do not crop out in the vicinity of
the coalfield. These are found to the northwest side of the
area and comprise granites, gneisses and few outcrops of
quartzite.
2.1.2. Talchirs
Talchir Formation covers a large tract of the low lying
plains surrounding the coalfield on the western, southern
and eastern margins. Due to unevenness of the Precam-
brian basement, varying thickness of the Talchir sedi-
ments is preserved at different places. The Talchirs are
composed of olive green shale and lemon yellow fine
grained sand stone. The sand stone is usually compact
with unaltered feld spars. Towa rds th e top of the Talchirs,
a transition zone is well defined. This zone is character-
ised by grey shales interbanded with green shales. The
grey shales on weathering develop distinctive greenish
shale and break into splin tery fragments. The transitional
zone contains thick units of light grey, fine to medium
grained sandstones which at places are not distinguish-
able from the Barakar strata.
2.1.3. Barakars
The Talchirs grade upwards into the Barakar Formation
which crops out on the highlands and occupies the cen-
tral part of the basin. It is composed of light grey, coarse
grained sandstones and the cement is normally kaolin-
ized feldspar. Lenticular bands of pebbly sandstone are
also common. The proportion of fine grained sandstone
is less compared to coarse grained sandstone. Ripple drift
laminated shales are also found. Coal seams, however,
show prominent horizons within the sand stone domi-
nated cycles.
Figure 1. (a) Outline map of India with location of Chirimiri coalfield. (b) Geological map of Chirimiri coalfield (modified
after Raja Rao [5]).
Copyright © 2011 SciRes. IJG
D. S. PATTANAIK ET AL.
Copyright © 2011 SciRes. IJG
338
2.2. Basic Flows, Dykes and Sills
Basic flows overlie the Barakar sequence and occur on
the tops of the hills giving rise to steep escarpments. A
prominent sill of dolerite defines the northern boundary
of the Chirimiri coalfield which continues further north-
ward into the Sonhat coalfield. The maximum thickness
of the sill is reported to be 100 m. A few dykes are also
reported.
The stratigraphy of the area is shown in Table 1.
2.2.1. Geology of Coal Seams
Chirimiri coalfield is one of the best and extensively de-
veloped coalfields in Chhatisgarh. There are seven work-
ing collieries in this field, namely Kurasia, Chirimiri,
New Chirimiri Pondi Hill (NCPH), West Chirimiri, Du-
man Hill, North Chirimiri and Koriya colliery.
The most important seam in Chirimiri basin is the Ka-
rakoh seam which is exposed in all the blocks. It is lo-
cally named as Bijora seam in Koriya colliery an d Ghor-
ghella seam in Duman Hill and North Chirimiri collieries.
This is a marker seam and co relatable in all collieries.
The other co relatable seam is the Sonawani seam which
is the lower most seam in Chirimiri coalfield. It is also
referred as Kotmi seam in Duman Hill and North Chiri-
miri collieries. The sequence of coal seams is reflected in
Table 2.
2.2.2. Chem i c al Analysis
The chemical analysis of the Chirimiri coals (Table 3)
reveals that the top most seam known as Duman seam is
the lowest in rank whereas the Sonawani seam found at
the bottom of the stratigraphic sequence shows highest
rank of all seams. Similar results have been proved in
Raniganj coalfield [6], Talchir coalfield [7 ] and Ib-valley
coalfield [8]. Gradual decrease of moisture and volatile
matter down the stratigraphic sequence is observed.
Table 1. Stratigraphy.
Age Formation Lithology
Upper Cretaceous to
Eocene Deccan Trap Basic flows, dykes
& sills (60 m. to
100 m)
Lower Permian Barakar
Sandstones with
subordinate shales
and coal seams
(230 m to 435 m)
Upper Carboniferous
to Lower Permian Talchir
Predominantly
olive green shales
and fine grained
sand stones (+9 m)
- - - - - - - - - - - - - - -
- - - - - Unconformity - - - - - - - - - - - - - -
- - - - -
Precambrians
Granite, gneisses
and quartzites
Table 2. Generalised seque nce of coal horizons in Chirimiri
coalfield.
Seam Thickness (m)
Duman 0.2 to 2.3
Parting 6 to 50
Kaperti 0.2 to 8
Parting 12 to 44
Karakoh - Bijora - Ghorghella 1.5 to 19.8
Parting 7.0 to 60
Sonawani - Kotmi 0.1 to 7.8
Parting 90 to 130
Talchir Formation
Table 3. Chemical analysis of the coals of the Chirimiri coalfield.
Proximate analysis (wt% air dried basis) Ultimate analysis (wt% d.m.f. basis)
Sample
No. Name of
coal seam Moisture Ash V.M. F.C C H N O Calorific
value(cal/g)
Du/4 Duman 7 10.7 34.0(40.5)48.3(59.5)77.1 6.4 1.48 15.02 6910
Du/3 Duman 7.6 10.4 32.2(38.5)49.8(61.5)81.16 6.5 1.73 10.61 7120
Du/2 Duman 8.4 8.4 30.0(35.4)53.2(64.6)80.38 6.74 1.46 11.42 6790
Du/1 Duman 6.7 15.3 30.1(37.4)47.9(62.6) 81.26 7.18 1.7 9.86 7370
Ka/3 Kaperti 7.5 15.8 29.0(36.5)47.7(63.5)81.79 5.86 1.46 10.89 7160
Ka/2 Kaperti 5.1 10.8 28.2(32.7)55.9(67.3)85.45 5.46 1.56 7.53 7550
Ka/1 Kaperti 6.2 15.6 25.0(30.6)53.2(69.4)86.9 5.48 1.43 6.19 7480
Kk/6 Karakoh 6.6 5.5 30.0(33.7)57.9(66.3)82.93 5.62 1.72 9.73 7440
Kk/5 Karakoh 6.7 15.2 26.9(33.1)51.2(66.9)81.93 5.61 1.83 10.63 7225
Kk/4 Karakoh 6.3 13.4 27.6(33.3)52.7(66.7)82.04 5.09 1.77 11.1 7590
Kk/3 Karakoh 6.3 12.1 28.7(34.2)52.9(65.8)82.25 5.57 1.74 10.44 7805
Kk/2 Karakoh 6.5 14.6 29.0(35.6)49.9(64.4)84.58 4.78 1.81 8.83 7330
Kk/1 Karakoh 6.4 14.9 29.2(35.9)49.5(64.1)78.62 4.79 1.68 14.91 7210
So/3 Sonawani 6.5 10.4 26.3(30.8)56.8(69.2)85.15 5 1.83 8.02 7900
So/2 Sonawani 6.1 12.3 26.7(31.7)54.9(68.3)82.49 4.85 1.74 10.92 7375
So/1 Sonawani 6 16.1 25.6(31.5)52.3(68.5)86.77 4.98 1.83 6.42 8005
N.B. figures in parenthe se s ( ) indicate values on dry mineral free (d.m.f.) basis
D. S. PATTANAIK ET AL.
Copyright © 2011 SciRes. IJG
339
The Duman seam coals are very rich in hydrogen, ex-
ceeding the upper limit of Seyler’s band [9] by 0.7% to
1.5% (Figure 2). The coals of other seams show plot-
tings within ±0.3% deviation from the Seyler’s band as
observed in other Indian coals [10]. The H/C vs. O/C
diagram (Figure 3) suggests the formation of type-III
Kerogen in terrestrial environment from which the
Chirimiri coals have evolved. The evolutionary paths of
maceral groups (Figure 4) show that normal vitrinites
and perhydrous vitrinites along with matured exinites
constitute the Chirimiri coals.
2.3. Spontaneous Combustibility
Characterisation of the Chirimiri Coals
Characterisation of coals towards proneness to sponta-
neous combustion can be done by measurement of
crossing point temperature (CPT) index. The methodol-
ogy or principle adopted here is heating of the coal sam-
ple in an oxidising atmosphere at a definite rate of tem-
perature rise. The apparatus used was CPT apparatus.
The coal samples of the Chirimiri coalfield were sub-
jected for CPT index measurement and the results are
shown in Table 4.
The CPT of all the samples of the Chirimiri coalfield
show that the average value of Duman seam coals is
130.1˚C, Kaperti, 135˚C, Karakoh, 143.1˚C and Sona-
wani 151.3˚C. It is seen that the oldest seam Sonawani
has highest CPT of 151.3˚C whereas the youngest Du-
man seam has CPT of 130.1˚C and there is gradual de-
crease of CPT from older seam to younger seam.
On the basis of parameters like V.M. and CPT, Chan-
dra et al. [12], Niyogi [7] and Behera [8] have classified
the coals as follows:
Volatile matter
(V.M) CPT (˚C) Susceptibility of coal to sponta-
neous combustion
<36% 155 - 185 Least susceptible
36% - 41% 140 - 155 Moderately s u sceptible
41% - 46% 125 - 140 Highly susceptible
As per the above classification, the coals of the Chiri-
miri Coalfield are considered moderately to highly prone
to spontaneou s combustion.
2.4. Petrography and Its Relation with CPT
The Chirimiri coals were studied for the petrography
(Table 5). It was found that vitrinite con tent varied from
12.2% to 76.2%, exinite from 4.6% to 17.0% and iner-
tinite from 17.9% to 81.7% on mineral matter free basis.
The average percentage of vitrinite was 44.4%, exinite
10% and inertinite 45.6%. It shows that the Chirimiri
coals are inertinite rich.
Figure 2. Plots of Chirimiri coals in Seyler’s Chart [9].
Figure 3. Depositional environment of Chirimiri coals (Af-
ter VAN KREVELEN [11]).
On seam wise consideration, the top Duman seam
contains more vitrinite which gradually decreases to-
wards Sonawani seam. The exinite content does not
show any variation in different seams. On the other hand,
the inertinite content shows increasing trend towards the
D. S. PATTANAIK ET AL.
340
Figure 4. Evolution paths of macerals of Chirimiri coals
(After VAN KREVELEN [11]).
Table 4. Crossing Point Temperature (CPT) of the coals of
the Chirimiri Coalfield.
Name of the seamSample No. CPT (˚C) Average CPT
(˚C)
Duman
Du/4
Du/3
Du/2
Du/1
129
125.5
132.0
134.0
130.1
Kaperti Ka/3
Ka/2
Ka/1
135
132
138 135
Karakoh
Kk/6
Kk/5
Kk/4
Kk/3
Kk/2
Kk/1
137
140
144
142
147
148.5
143.1
Sonawani So/3
So/2
So/1
151
148
155 151.3
Table 5. Maceral composition (volume%) and reflectance (Rm% and Rmax%) of vitrinite of the coals of the Chirimiri coal-
field.
Mineral matter
Sample
No. Name of
coal seam Vitrinite Exinite Inertinite Pyrite Others Total
Rm% Rmax%
Du/4 Duman 57.3(61.0) 11.5(12.3) 25.0(26.7) 0.8 5.4 6.2 0.52 0.6
Du/3 Duman 58.2(62.4) 11.3(12.1) 23.7(25.5) 1 5.8 6.8 0.55 0.63
Du/2 Duman 59.1(69.2) 6.5(7.6) 19.8(23.2) 0.3 14.3 14.6 0.58 0.68
Du/1 Duman 57.1(60.3) 9.4(9.9) 28.3(29.8) 1.2 4 5.2 0.56 0.69
Ka/3 Kaperti 64.0(76.2) 5.0(5.9) 15.0(17.9) 3 13 16 0.56 0.65
Ka/2 Kaperti 17.4(18.7) 13.9(15.0) 61.5(66.3) 0.2 7 7.2 0.58 0.7
Ka/1 Kaperti 32.6(37.2) 12.7(14.5) 42.3(48.3) 2.8 9.6 12.4 0.6 0.72
Kk/6 Karakoh 42.7(47.3) 11.5(12.7) 36.0(40.0) 1.6 8.2 9.8 0.57 0.67
Kk/5 Karakoh 47.0(54.0) 4.0(4.6) 36.0(41.4) 3 10 13 0.56 0.65
Kk/4 Karakoh 16.3(19.9) 13.9(17.0) 51.6(63.1) 1.4 16.8 18.2 0.59 0.73
Kk/3 Karakoh 38.0(45.7) 6.0(7.2) 39.1(47.1) 1 15.9 16.9 0.58 0.73
Kk/2 Karakoh 25.4(27.6) 8.1(8.8) 58.4(63.6) 2.3 5.8 8.1 0.57 0.67
Kk/1 Karakoh 27.2(29.7) 6.2(6.8) 58.1(63.5) 0.8 7.7 8.5 0.58 0.75
So/3 Sonawani 37.0(41.6) 6.0(6.7) 46.0(51.7) 0.4 10.6 11 0.61 0.75
So/2 Sonawani 42.3(45.1) 11.4(12.2) 40.1(42.7) 0.8 5.4 6.2 0.6 0.75
So/1 Sonawani 10.0(12.2) 5.0(6.1) 67.0(81.7) 1.8 16.2 18 0.61 0.75
N.B. The fi g ur es in parentheses represent maceral composition on mineral matter free basis.
bottom seam. Pyrite and other mineral matter vary from
5.2% to 18.2% in which pyrite contributes to 0.2% to
3%.
Correlations have been drawn between vitrinite and
CPT (Figure 5), exinite and CPT (Figure 6) and iner-
tinite and CPT (Figure 7). It is seen that CPT decreases
with increase of vitrinite and exinite. On the other hand,
CPT increases with increase of intertinite. Thus suscepti-
bility to spontaneous combustion of the Chirimiri coals
increases with the increase of vitrinite and exinite whereas
it decreases with increase of inertinite.
The mean reflectance (Rm%) of vitrinite varies be-
tween 0.52% and 0.61% which suggests the Chirimiri
coals to be of low rank. The rank increases from the top
Duman seam to bottom Sonawani seam in harmony with
increasing reflectance value. The maximum reflectance
(Rmax%) of vitrinite of the Chirimiri coals is correlated
to volatile matter (Figure 8) and the elemental carbon
Copyright © 2011 SciRes. IJG
D. S. PATTANAIK ET AL.341
Figure 5. Correlation between vitrinite and crossing point
temperature of Chirimiri coals.
Figure 6. Correlation between exinite and crossing point
temperature of Chirimiri coals.
Figure 7. Correlation between inertinite and crossing point
temperature of Chirimiri coals.
Figure 8. Relation between volatile matter and reflectance
(Rmax%) of vitrinite of Chirimiri coals.
content (Figure 9). The plots were found plotted close to
the curve drawn by Chandra & Chakrabarti [10] for other
Indian coals.
2.5. Infrared Studies (IR)
The infrared spectra obtained from the coal samples of
different seams of the Chirimiri coalfield were used to
interpret the variation of functional groups with reference
to spontaneous combustion. The spectra are shown in
Figure 10.
The broad absorption band between 3700 cm–1 and
3000 cm–1 is due to the intermolecular hydrogen bonded
OH group, present in the moisture content of coal. The
broad peak is more prominent in case of Duman seam
and Kaperti seam than the Karakoh and Sonawani seam.
It indicates high moisture absorbing capacity of the Du-
man and the Kaperti seam. Nandi et al. [13] have con-
cluded earlier that the amenability of a coal to self heat-
ing as indicated by lower crossing point temperature is
due to hydroxyl groups of the coal structure. Thus (OH)
content could play an active role for high susceptibility
of spontaneous combustion of the Duman and the
Kaperti seams. Main peaks are located around 3400 cm–1
in almost all samples. Hydrogen bonded NH group may
also contribute pa rtly to the intensity of the band at 3300
cm–1.
Copyright © 2011 SciRes. IJG
D. S. PATTANAIK ET AL.
Copyright © 2011 SciRes. IJG
342
Figure 9. Relation between elemental carbon and reflectance (Rmax%) of vitrinite of Chirimiri coals.
Two sharp but small peaks appear in the region be-
tween 3000 cm–1 and 2800 cm–1. Most of the coal sam-
ples show characteristic absorption at 2920 ± 10 cm–1
and 2850 ± 10 cm–1. These spectral bands indicate the
presence of aliphatic CH, CH2 and CH3 groups [14].
These aliphatic absorption bands are stronger in Duman
and Kaperti seams and less intense in Karakoh and
Sonawani seams. This type of aliphatic chains also oc-
curs at 1450 ± 10 cm–1. The intensities of these bands in
different seams vary in the same fashion as mentioned
above.
The 1600 ± 10 cm–1 absorption band corresponding to
the double bond stretching variation of aromatic C = O,
is the most spectacular among all the spectra. The coals
of Duman and Kaperti seams show stronger absorbance
than the coals of other seams. Choudhury et al. [15] es-
tablished that higher the aromatic content, the faster is
the rate of auto-oxidation; hence lower the crossing point
temperature. Thus a higher content of aromatic C = O
could be responsible for susceptibility to spontaneous
combustion of Duman and the Kaperti seams.
The peaks at 1020 ± 10 cm–1 occur due to presence of
kaolinite or clay minerals containing large amount of
kaolinite. Sharp peaks at 600 cm–1, 530 cm–1, 460 cm–1
and 340 cm–1 are also indicative of the presence of min-
eral matter.
2.6. Differential Thermal Analysis
The Differential Thermal Analysis (DTA) technique has
been proved to be useful to assess the proneness of coal
to spontaneous combustion. It is the rate of rise of the
heat evolution of coal during aerial oxidation which other-
wise controls the proneness to spontaneous combustion.
D. S. PATTANAIK ET AL.
Copyright © 2011 SciRes. IJG
343
Figure 10. Infrared spectra of Chirimiri coals.
D. S. PATTANAIK ET AL.
Copyright © 2011 SciRes. IJG
344
Chandra et al. [12] used this technique to assess the
degree of proneness to spontaneous combustion in Rani-
ganj coals. Stott & Baker [16] observed that in DTA,
initial stage of spontaneous heating of coal is due to
evaporation which leads to cooling effect, but the exo-
thermic reaction due to oxidation soon gains ground.
Banerjee & Chakraborty [17] studied DTA on coal and
found that at stage-I, the reaction is predominantly en-
dothermic due to the release of moisture, but after some-
time the reaction becomes exothermic at stage-II due to
oxidation. The rate of rise of heat evolution in stage-II
process is much lower if the coal is poorly combustible.
Banerjee [18] further observed that in DTA the degree of
cooling in stage-I is directly proportional to inherent
moisture content, but subsequent exothermic reaction
follows due to oxidative heating. Banerjee et al. [19]
further concluded that oxidation kinetics in DTA studies
facilitates air entry due to opening up of active centres in
the surface of coal. Chandra et al. [12] and Behera &
Chandra [20] applied DTA technique to evaluate the
degree of proneness to spontaneous heating of coal in
Raniganj and Ib-valley coalfields respectively.
The experimental results of the DTA of the Chirimiri
coals are shown in Table 6. The thermograms are shown
in Figure 11. The DTA reveals that phase transformation
due to dehydration of the coal samples of the Sonawani
seam and Karakoh seam numbered as So/1, So/3, Kk/2,
Kk/4 and Kk/6 showed endothermic peaks in tempera-
ture range of 104˚C to 116˚C, but the coal samples of the
Kaperti seam and the Duman seam numbered as Ka/1,
Ka/3, Du/1, Du/3 and Du/4 showed peak maxima be-
tween 100˚C and 106˚C.
A close scrutiny of the thermograms shows that there
is gradual variation in the bulging nature of these endo-
thermic peaks vis-a-vis the stratigraphic sequence. The
bulging in case of Sonawani and Karakoh is greater
compared to those of Kaperti and Duman seams. The
second endothermic peaks are due to the combustion of
volatiles or degasification. For Sonawani and Karakoh,
the peak maxima are found between 400˚C and 415˚C,
whereas for the samples of the Kaperti and the Duman,
the peak maxima are in between 390˚C and 410˚C. The
exothermic peaks due to the combustion of fixed carbon
are found in the temperature range of 455˚C to 490˚C in
the samples of Sonawani seam and the Karakoh seam
whereas for the samples of Kaperti and the Duman seams,
the peaks range from 455˚C to 495˚C.
A comparison of DTA peak temperatures and the cor-
responding crossing point temperatures is also shown in
Table 6. A graphical relation between the CPT and the
first DTA endothermic peak temperature is shown in
Figure 12.
2.7. Correlation Co-Efficient for DTA and CPT
The correlation co-efficient between two parameters
such as DTA and CPT was calculated and the best fit line
was drawn (Figure 12). The r value of these two pa-
rameters was found to be 0.9192 and the‘t’ value was
calculated by using the formula t = r


2
2
1
n
r
where t
= test for significance, r = correlation co-efficient and n
= number of samples used. The calculated t value was
found to be 6.6023 which is greater than the tabulated
value (2.4469 at 5% level of significance). This vindi-
cated that the relation between these two parameters is
significant. As the CPT increases so also the DTA endo-
thermic peak temperature.
2.8. Correlation Co-Efficient for Vitrinite and
CPT
Correlation between vitrinite and CPT has been shown in
Figure 5. The t value was calculated to be 3.0418 which
is greater than the tabulated value (2.1448), hence sig-
nificant.
Table 6. Comparison of DTA vis-a-vis CPT of the coals of the Chirimiri coalfield.
DTA - Peak Temperature (˚C)
Sample
No. Name of
coal seam Endothermic 1st Endothermic 2nd Exothermi c CPT (˚C)
Du/4 Duman 106 390 470 129
Du/3 Duman 100 390 460 125.5
Du/1 Duman 100 410 475 134
Ka/3 Kaperti 105 400 495 135
Ka/1 Kaperti 106 400 455 138
Kk/6 Karakoh 104 400 455 137
Kk/4 Karakoh 110 415 490 144
Kk/2 Karakoh 112 410 480 147
So/3 Sonawani 114 410 485 151
So/1 Sonawani 116 410 460 155
D. S. PATTANAIK ET AL.345
Figure 11. DTA thermograms of Chirimiri coals.
Figure 12. Correlation between DTA endothermic peak temperature and crossing point temperature of Chirimiri coals.
Copyright © 2011 SciRes. IJG
D. S. PATTANAIK ET AL.
Copyright © 2011 SciRes. IJG
346
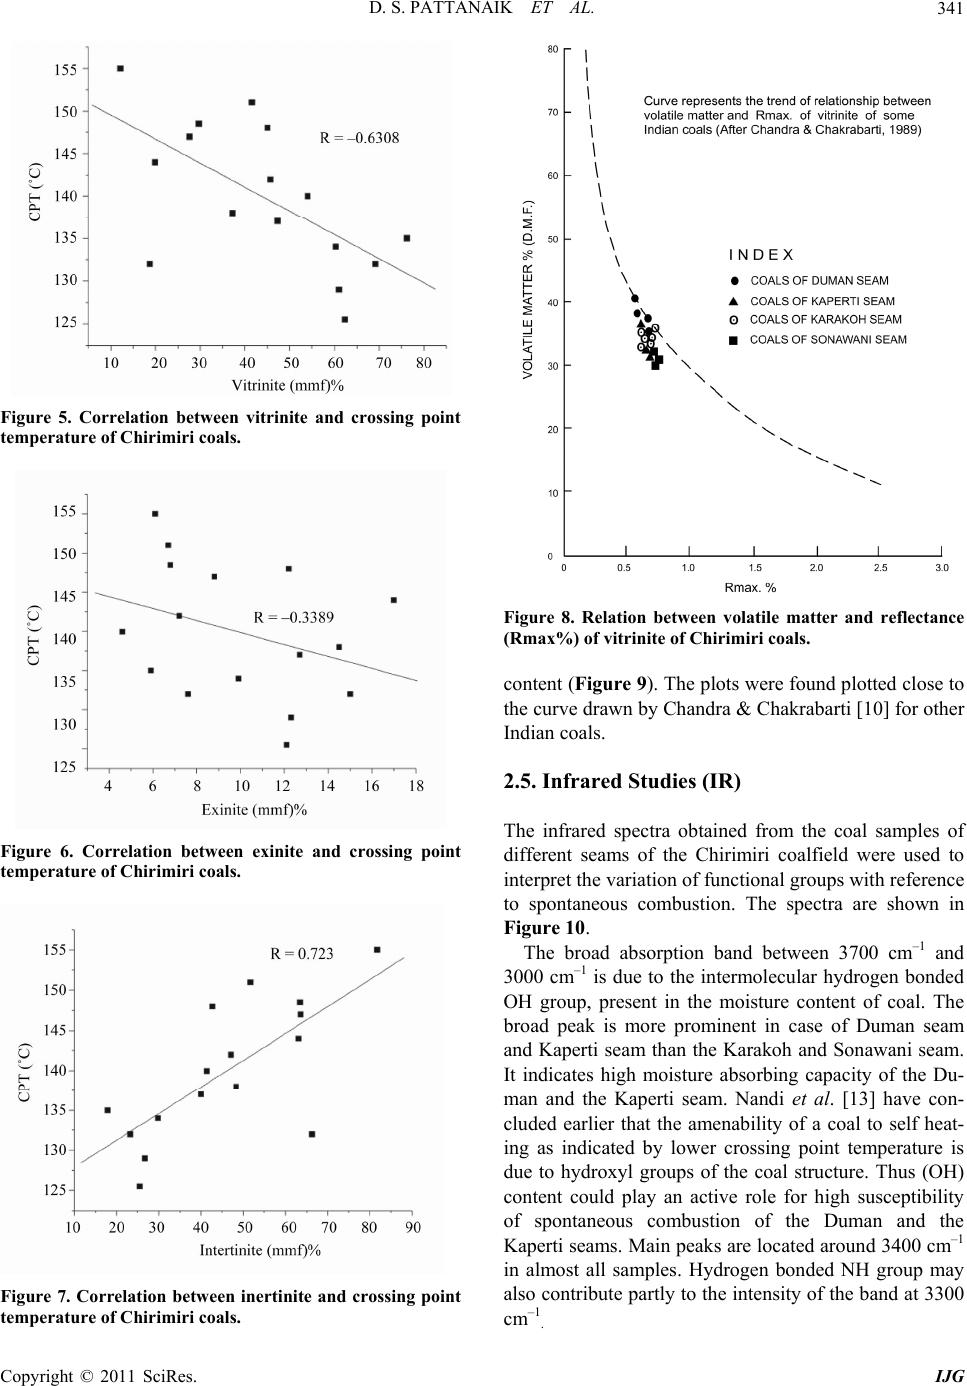
2.9. Correlation Co-Efficient for Exinite and
CPT
Correlation between exinite and CPT has been shown in
Figure 6. The calculated value of t was found to be 3.
6381 and the tabulated value for t is 2.1448, hence sig-
nificant.
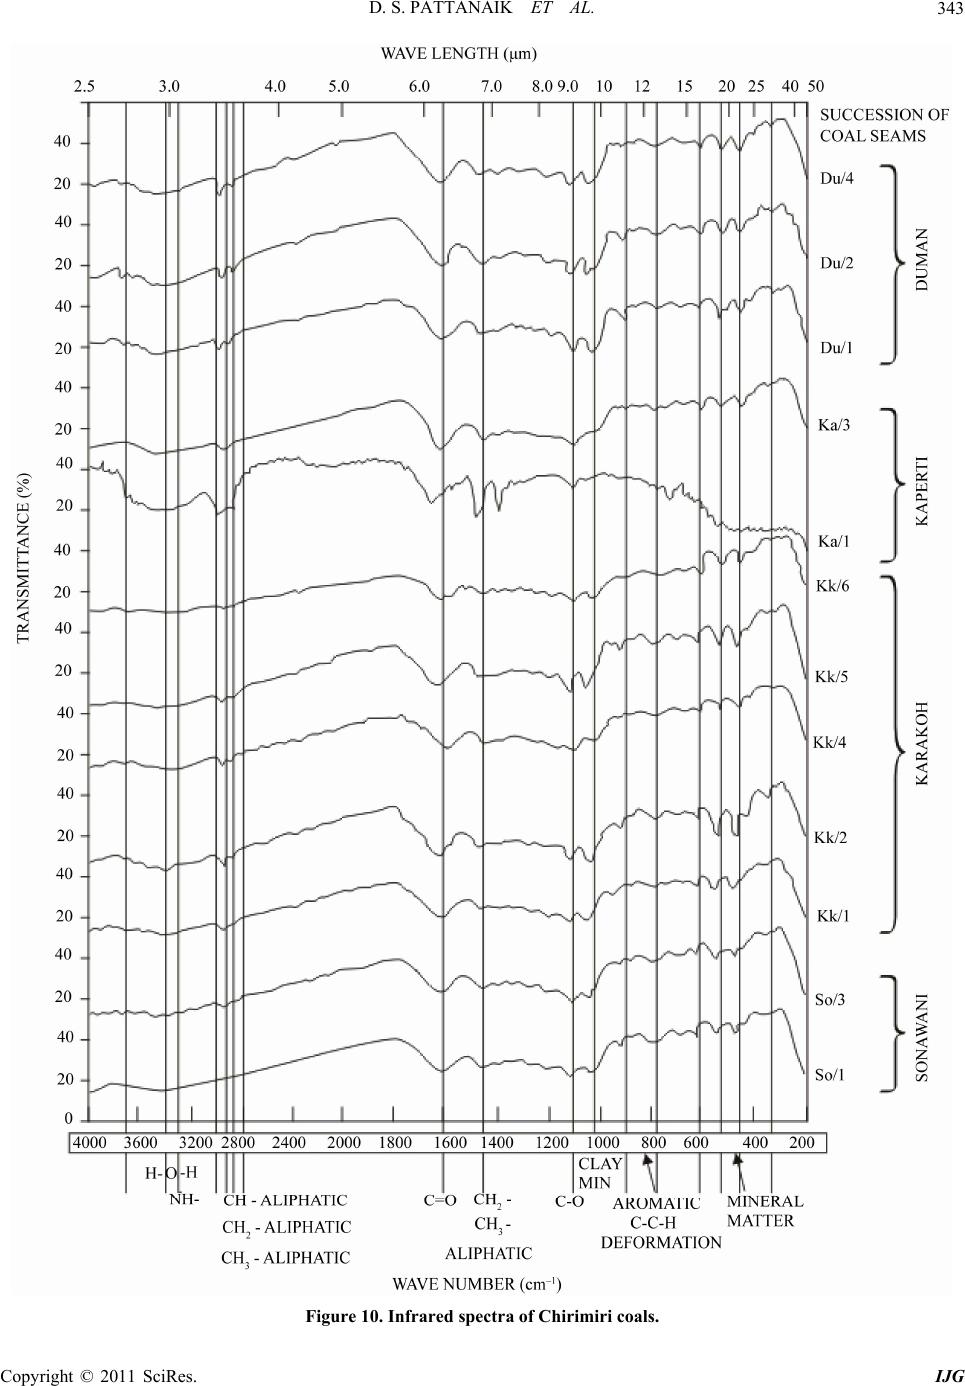
2.10. Correlation Co-Efficient for Inertinite and
CPT
Correlation between inertinite and CPT was drawn in
Figure 7. The calculated value of t was found to be
3.9157 and the tabulated value for t is 2.1448, hence sig-
nificant.
3. Conclusions
From the foregoing discussions, the following conclu-
sions are drawn.
1) Unlike other lower Gondwana coalfields, the Chiri-
miri coalfield is located in a different physiographic set
up, i.e., at an elevation of 650 m from MSL.
2) The degree of proneness to spontaneous combustion
of the coals is related to stratigraphy or rank of the coal
which was proved by the study of different parameters.
3) The study of volatile matter and crossing point tem-
perature reveal that the Chirimiri coals are moderate to
highly prone to spontaneous combustion.
4) Petrographic study proves that the degree of prone-
ness to spontaneous combustion increases with the in-
crease of vitrinite and exinite, but decreases with the
increase of inertinite content.
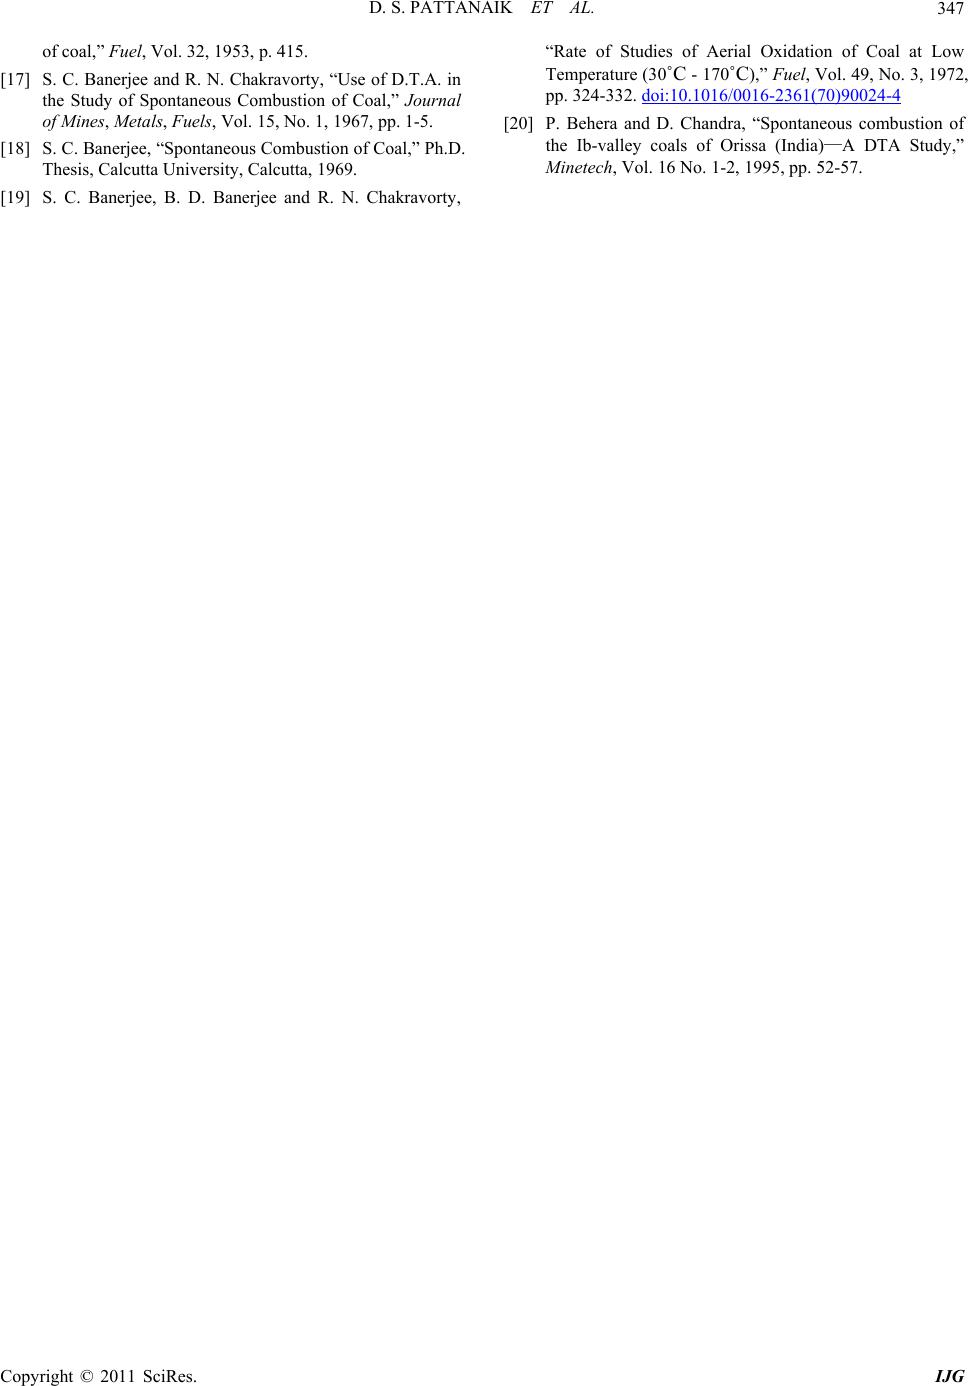
5) Infrared studies prove that the top Duman and
Kaperti seam coals show stronger absorbance than the
coals of other seams. Hence, these seams are relatively
more prone to spontaneous combustion as compared to
the bottom Karakoh and Sonawani seams.
6) The DTA studies used to assess the spontaneous
combustibility character show that the first endothermic
peak temperature range for Karakoh and Sonawani
seams is 104˚C to 116˚C whereas that for Kaperti and
Duman seams is 100˚C to 106˚C. Hence, the Kaperti and
Duman seam coals are highly prone to spontaneous
combustion.
7) Correlation co-efficients of CPT with DTA, CPT
with vitrinite, CPT with exinite and CPT with inertinite
were found to be significant. Therefore, lower the CPT,
higher is the tendency to spontaneous heating suscepti-
bility.
8) All parametrical tests suggest that the proneness to
spontaneous heating is related to the rank of coal.
4. References
[1] A. K. Singh, R. V. K. Singh, M. P. Singh and N. K. Sukla,
“Mine Fire Indices and Their Application to Indian under
Ground Mine Fires,” International Journal of Coal Ge-
ology, Vol. 69, No. 3, 2007, pp. 192-204.
doi:10.1016/j.coal.2006.04.004
[2] H. K. Mishra, “Petrographic Image Analysis—A Case
Study of Indian Permian Coals,” ICCP News, Vol. 28,
2003.
[3] D. C. Panigrahi and H. B. Sahu, “Classification of Coal
Seams with Respect to Their Spontaneous Heating Sus-
ceptibility—A Neutral Network Approach,” Geotechnical
Engineering, Vol. 22, No. 4, 2004, pp. 457-476.
doi:10.1023/B:GEGE.0000047040.70764.90
[4] A. Jain, “Assesment of Spontaneous Heating Susceptibil-
ity of Coals by Using DTA,” BTech Dissertation, NIT,
Rourkela, 2009.
[5] C.S. Raja Rao, “Chirimiri Coalfield,” Bulletin Geological
Survey of India, Vol. 45, No. 3, 1983, pp. 44-55.
[6] Y. V. S. Prasad, “A Survey of Spontaneous Combustibil-
ity of Coals of the Raniganj Coalfield,” Ph.D. Thesis, In-
dian School of Mines, Dhanbad, 1987.
[7] C. Niyogi, “Studies of SPONTANEOUS COMBUSTION
of COAL of Talcher Coalfield,” Ph.D. Thesis, Indian
School of Mines, Dhanbad, 1989.
[8] P. Behera, “Geology of the Ib-Valley Coal Field with
Special Reference to Spontaneous Combustibility of Its
Different Seams,” Ph.D. Thesis, Indian School of Mines,
Dhanbad, 1991.
[9] C. A. Seyler, “Petrology and Classification of Coal: Pts I
& II,” Proceedings of the South Wales Institute of Engi-
neer, Vol. 53, No. 4, 1938, pp. 254-327.
[10] D. Chandra and N. C. Chakrabarti, “Coalification Trends
in Indian Coals,” International Journal of Coal Geology,
Vol. 13, No. 1-4, 1989, pp. 413-435.
doi:10.1016/0166-5162(89)90102-X
[11] D. W. Van Krevelen, “Coal,” Elsevier Publishing Co.,
New York, 1961.
[12] D. Chandra, Y. V. S. Prasad, H. B. Acharya, A. K. Sam-
suddin and K. C. Banerjee, “Spontaneous Combustion of
the Coal Seams of the Raniganj CoalfieldA Thermal
Study,” Proceedings National Seminar on Coal Re-
sources of India, Varanasi,1987, pp. 206-214.
[13] D. K. Nandi, S. C. Banerjee and R. M. Chakraborty, “Ef-
fect of incombustible Material on Critical Oxidation
Temperature of Coal,” Indian Journal of Technology, Vol.
3, No. 5, 1963, pp. 160 - 162.
[14] David N. Kendall, “Applied Infrared Spectroscopy,”
Reinholl Publishing Corporation, Chapman and Hall Ltd.,
London, 1966.
[15] S. S. Choudhury, P. K. Sanyal and S. C. Banerjee,
“Auto-Oxidation and Self Heating of Coal: Its Structural
Implications,” Fuels Technology, Vol. 1, No. 3, 1982, pp.
99-105.
[16] J. B. Stott and O. J. Baker, “Differential thermal analysis
D. S. PATTANAIK ET AL.347
of coal,” Fuel, Vol. 32, 1953, p. 415.
[17] S. C. Banerjee and R. N. Chakravorty, “Use of D.T.A. in
the Study of Spontaneous Combustion of Coal,” Journal
of Mines, Metals, Fuels, Vol. 15, No. 1, 1967, pp. 1-5.
[18] S. C. Banerjee, “Spontaneous Combustion of Coal,” Ph.D.
Thesis, Calcutta University, Calcutta, 1969.
[19] S. C. Banerjee, B. D. Banerjee and R. N. Chakravorty,
“Rate of Studies of Aerial Oxidation of Coal at Low
Temperature (30˚C - 170˚C),” Fuel, Vol. 49, No. 3, 1972,
pp. 324-332. doi:10.1016/0016-2361(70)90024-4
[20] P. Behera and D. Chandra, “Spontaneous combustion of
the Ib-valley coals of Orissa (India)A DTA Study,”
Minetech, Vol. 16 No. 1-2, 1995, pp. 52-57.
Copyright © 2011 SciRes. IJG