 International Journal of Geosciences, 2011, 2, 259-266 doi:10.4236/ijg.2011.23028 Published Online August 2011 (http://www.SciRP.org/journal/ijg) Copyright © 2011 SciRes. IJG Geochemical Assessment of Impact of Mine Spoils on the Quality of Stream Sediments within the Obuasi Mines Environment, Ghana Prosper Mackenzie Nude1*, Gordon Foli2, Sandow Mark Yidana1 1Department of Earth Science, University of Ghana, Ghana, Legon-Accra, Ghana 2University for Development Studies, Navrongo Campus, Tamale, Ghana E-mail: *pmnude@ug.edu.gh Received March 28, 2011; revised June 7, 2011; accepted July 23, 2011 Abstract Stream sediment samples were analyzed for the concentrations of some trace metals in the Obuasi gold min- ing environment, Ghana. The objectives were to determine the possible impacts of mining operations in the area on sediments’ trace metal load, and the resulting effects on agriculture and livelihoods. The concentra- tions of arsenic (As), copper (Cu), lead (Pb), zinc (Zn), iron (Fe), with calcium (Ca) as reference element, were compared to their respective background concentrations to calculate the enrichment and contamination factors, and also geo-accumulation and pollution load indices of each trace metal. These were in turn com- pared to standard tables to determine the status of contamination. Q-mode hierarchical cluster analysis (HCA) was then applied to the samples for spatial classification. This study suggests probable contribution of min- ing and associated activities in the Obuasi area to the concentrations of trace metals especially arsenic, in the stream sediments. Three spatial relationships were revealed based on the concentrations of these trace metals from the Q-mode HCA. The samples presented generally high concentrations, which were more profound for samples taken closer to holding pond and tailings dams, and decreased downstream. Keywords: Enrichment Factor, Contamination Factor, Geo-Accumulation Index, Pollution Load Index, Trace Metals, Obuasi Gold Mine, Ghana 1. Introduction The Obuasi gold mine constitutes the single largest gold mine in Ghana, accounting for over 60% of the total national production. Gold being one of the major sources of foreign exchange for the country has been produced from this mine for over a century. Gold in the Obuasi area occurs mainly in quartz reefs or as sulphide ores. The former consist mostly of chalcopyrite, sphalerite, galena and gold whereas the latter consists of arseno- pyrite, pyrite, pyrrhotite and gold. In the Obuasi mining district, evidence of local conta- mination in association with gold mining activities has been noted and indications of trace metal contamination in streams, sediments, and biota abound, and obviously result from contamination from diverse sources including mining and municipal discharges [1-4]. Although such signs of contamination have been obvious overtime, the geochemical implications of these contaminations in stream sediments, as well as the severity of such con- taminations have not been previously evaluated using relevant evaluation indices. On the other hand, a tho- rough assessment of the level of contamination of the major environmental receptors such as soils, biota, water bodies, and stream sediments is critically required in order to assist environmental managers and the relevant stakeholders plan to avert any future epidemics. For example in the Obuasi area, it is common practice by the locals to undertake gardening and food crop culti- vation along banks of streams and other areas where the sediments or stream overloads might be contaminated with these trace metals and associated toxins. It is there- fore critically important that the trace metal contents of stream sediments in the local area be evaluated to deter- mine whether or not these sediments are worthy of their current patronage. Such a research would highlight possible hotspots and suggest any possible mitigation measures in order to forestall environmental damage and 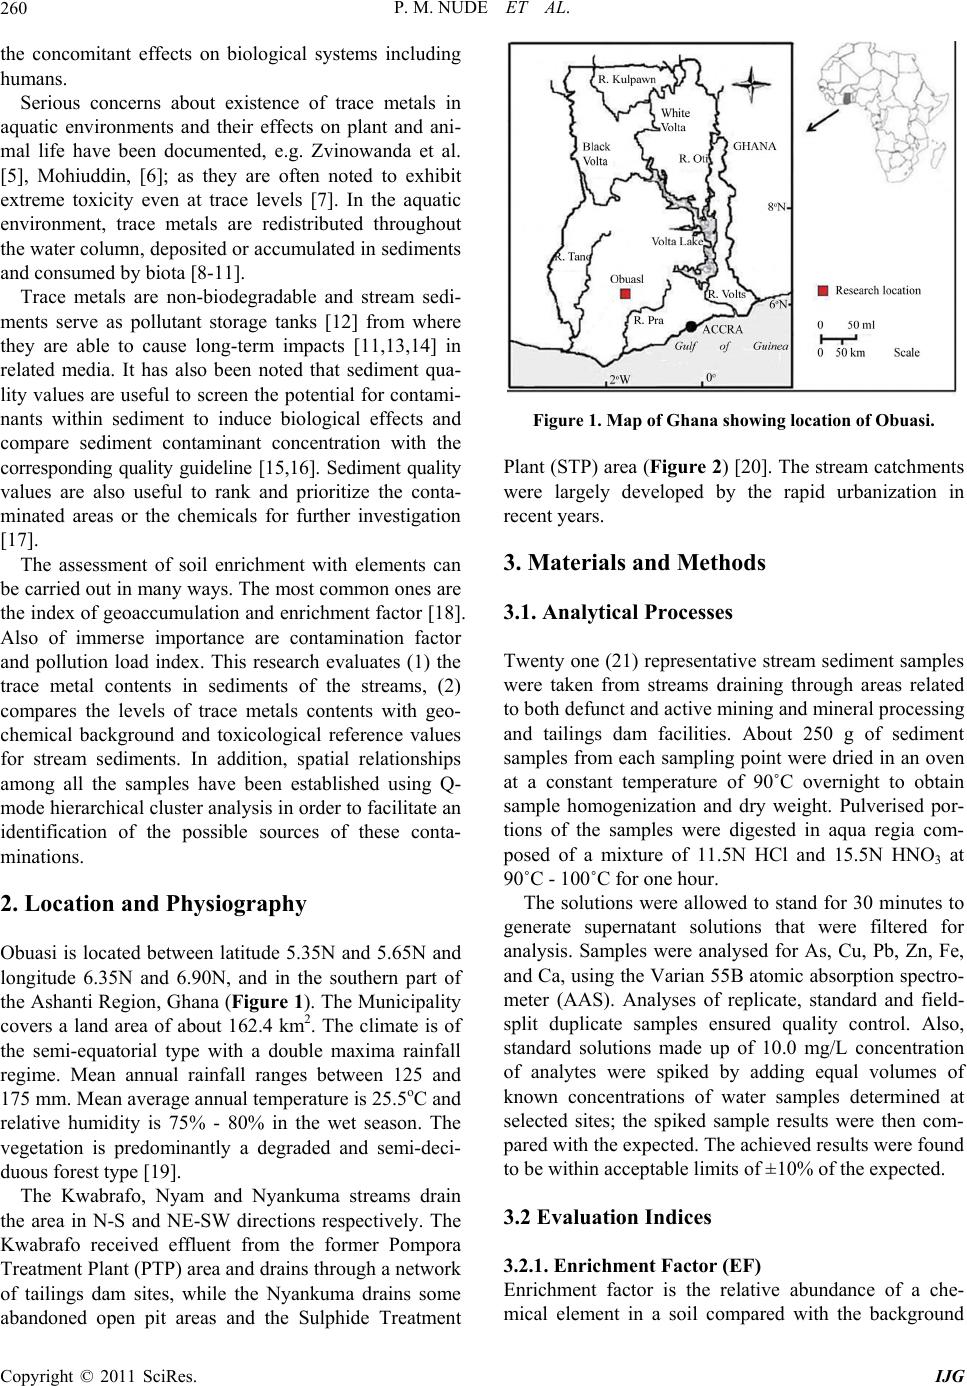 P. M. NUDE ET AL. 260 the concomitant effects on biological systems including humans. Serious concerns about existence of trace metals in aquatic environments and their effects on plant and ani- mal life have been documented, e.g. Zvinowanda et al. [5], Mohiuddin, [6]; as they are often noted to exhibit extreme toxicity even at trace levels [7]. In the aquatic environment, trace metals are redistributed throughout the water column, deposited or accumulated in sediments and consumed by biota [8-11]. Trace metals are non-biodegradable and stream sedi- ments serve as pollutant storage tanks [12] from where they are able to cause long-term impacts [11,13,14] in related media. It has also been noted that sediment qua- lity values are useful to screen the potential for contami- nants within sediment to induce biological effects and compare sediment contaminant concentration with the corresponding quality guideline [15,16]. Sediment quality values are also useful to rank and prioritize the conta- minated areas or the chemicals for further investigation [17]. The assessment of soil enrichment with elements can be carried out in many ways. The most common ones are the index of geoaccumulation and enrichment factor [18]. Also of immerse importance are contamination factor and pollution load index. This research evaluates (1) the trace metal contents in sediments of the streams, (2) compares the levels of trace metals contents with geo- chemical background and toxicological reference values for stream sediments. In addition, spatial relationships among all the samples have been established using Q- mode hierarchical cluster analysis in order to facilitate an identification of the possible sources of these conta- minations. 2. Location and Physiography Obuasi is located between latitude 5.35N and 5.65N and longitude 6.35N and 6.90N, and in the southern part of the Ashanti Region, Ghana (Figure 1). The Municipality covers a land area of about 162.4 km2. The climate is of the semi-equatorial type with a double maxima rainfall regime. Mean annual rainfall ranges between 125 and 175 mm. Mean average annual temperature is 25.5oC and relative humidity is 75% - 80% in the wet season. The vegetation is predominantly a degraded and semi-deci- duous forest type [19]. The Kwabrafo, Nyam and Nyankuma streams drain the area in N-S and NE-SW directions respectively. The Kwabrafo received effluent from the former Pompora Treatment Plant (PTP) area and drains through a network of tailings dam sites, while the Nyankuma drains some abandoned open pit areas and the Sulphide Treatment Figure 1. Map of Ghana showing location of Obuasi. Plant (STP) area (Figure 2) [20]. The stream catchments were largely developed by the rapid urbanization in recent years. 3. Materials and Methods 3.1. Analytical Processes Twenty one (21) representative stream sediment samples were taken from streams draining through areas related to both defunct and active mining and mineral processing and tailings dam facilities. About 250 g of sediment samples from each sampling point were dried in an oven at a constant temperature of 90˚C overnight to obtain sample homogenization and dry weight. Pulverised por- tions of the samples were digested in aqua regia com- posed of a mixture of 11.5N HCl and 15.5N HNO3 at 90˚C - 100˚C for one hour. The solutions were allowed to stand for 30 minutes to generate supernatant solutions that were filtered for analysis. Samples were analysed for As, Cu, Pb, Zn, Fe, and Ca, using the Varian 55B atomic absorption spectro- meter (AAS). Analyses of replicate, standard and field- split duplicate samples ensured quality control. Also, standard solutions made up of 10.0 mg/L concentration of analytes were spiked by adding equal volumes of known concentrations of water samples determined at selected sites; the spiked sample results were then com- pared with the expected. The achieved results were found to be within acceptable limits of ±10% of the expected. 3.2 Evaluation Indices 3.2.1. Enrichment Factor (EF) Enrichment factor is the relative abundance of a che- mical element in a soil compared with the background Copyright © 2011 SciRes. IJG  P. M. NUDE ET AL. Copyright © 2011 SciRes. IJG 261 Figure 2. A sketch map of parts of the Obuasi area (study area) showing the network of streams and sampled locations (After Foli and Nude [20]). [21]. It is a convenient method of measuring geoche- mical trends for comparison between areas [15]. Enrich- ment factor is also often used in the assessments of anthropogenic pollution in sediments [6]. The factor, as outlined by Loska, et al. [18] is presented in Equation 1: nn ref ref CB EF CB (1) where: n—Content (mg/kg) of the examined element in the examined environment, C ref C—Content (mg/kg) of the examined element in the reference environment, n—Content (mg/kg) of the reference element in the examined environment, B ref —Content (mg/kg) of the reference element in the reference environment. B Five contamination categories on the basis of the enrichment factor are summarized in Table 1 below: 3.2.2. Geo accumulation In dex ( eo Geo-accumulation index is also used to assess metal pol- lution in sediment. Geoaccumulation index determines contamination by comparing current metal contents with I)  P. M. NUDE ET AL. 262 Table 1. Contamination categories on the basis of enrich- ment factor. Enrichment factor (EF) Description EF < 2 Depletion to minimal enrichment 2 < EF < 5 Moderate enrichment 5 < EF < 20 Significant enrichment 20 < EF < 40 Very high enrichment EF > 40 Extremely high enrichment pre-industrial levels [18]. The index quantifies metal accumulation in sediments for classification as either po- lluted or unpolluted [22]. The geoaccumulation index Igeo is as follows (Equation (2)): 2 log 1.5 n geo n C I B (2) where n is the measured concentration of element n in the sediment and n B the geochemical background for the element n, which is either directly measured in pre-civilization sediments of the area or taken from lit- erature [6]. The constant 1.5 compensates for possible variations of the background values that are due to lithologic variations, or natural fluctuations of a given substance in the environment as well as very small an- thropogenic influences [18]. Seven grade or class of the geo-accumulation index is summarized as below [6,15, 18] (Table 2). C is 3.2.3 Pollution Load Index The pollution load index (PLI) outlined by Kumar and Edward [12] and Mouhiuddin et al., [6], has also been used in this study to measure the level of contamination in sediments. The PLI for a single site is the nth root of n number multiplying the contamination factors (CF) to- gether. The contamination factor represents the individ- ual impact of each trace metal on the sediments [22], (Equation (3)). Metal concenteation ackgroundconcenteation ofsamemetal C CF C (3) This also implies, n ref C CF C As in the EF equation (Equation 1), the contamination factor CF, also referred to as metal ratio, is based on the mean content of metals from at least five sampling sites [12, 22]. The PLI for a single site is determined using Equation (4). n n PLIforsiteCFxCF CF (4) where, CF = Contamination factor, and n = the number of contamination factors and sites, re- spectively [6]. Four categories of contamination factor have been distinguished as in Table 3. From the defini- tion for PLI, range of values and categories may be ex- pressed in terms of the contamination factor. 4. Reference Element and Background Values for Measur ed Pa r am e te rs An element is regarded as a reference element if it is of low occurrence variability and/or is presented in the en- vironment in trace amounts. The most common reference elements are Sc, Mn, Al and Fe. However it is also pos- sible to apply an element of geochemical nature whose substantial amounts occur in the environment but has no characteristic effects such as synergism or antagonism towards an examined element [18]. In the local area, Fe is perceived as having synergism with As; Fe was found to be responsible for As fixing in soils [23]. On the above basis, Ca was considered, with value quoted from Taylor and McLennan [24] and Loska et al. [18] as 30,000 mg/kg. Continental crust values as background for measured parameters such as As, Cu, Pb and Zn are 1.8 mg/kg, 55 mg/kg, 12.5 mg/kg and 70 mg/kg respectively [6], and for Fe as 35,900 mg/kg [25]. The background values are considered as geogenic con- tributions while the difference between the measured Table 2. The seven classes of the geo-accumulation index. Class Range Interpretation (Quality) 0 Igeo ≤ 0 Practically uncontaminated 1 0< Igeo < 1 Uncontaminated to moderately contaminated 2 1< Igeo < 2 Moderately contaminated 3 2< Igeo < 3 Moderately to heavily contaminated 4 3< Igeo < 4 Heavily contaminated 5 4< Igeo < 5 Heavily to very heavily (extremely) contaminated 6 Igeo ≥ 5 Very heavily (extremely) contaminated Table 3. Four categories of contamination based on the c on- tamination factors. Contamination factor Description of contamination level CF < 1 Low 1 ≤ CF < 3 Moderate 3 ≤ CF < 6 Considerable 6 ≤ CF Very high Copyright © 2011 SciRes. IJG 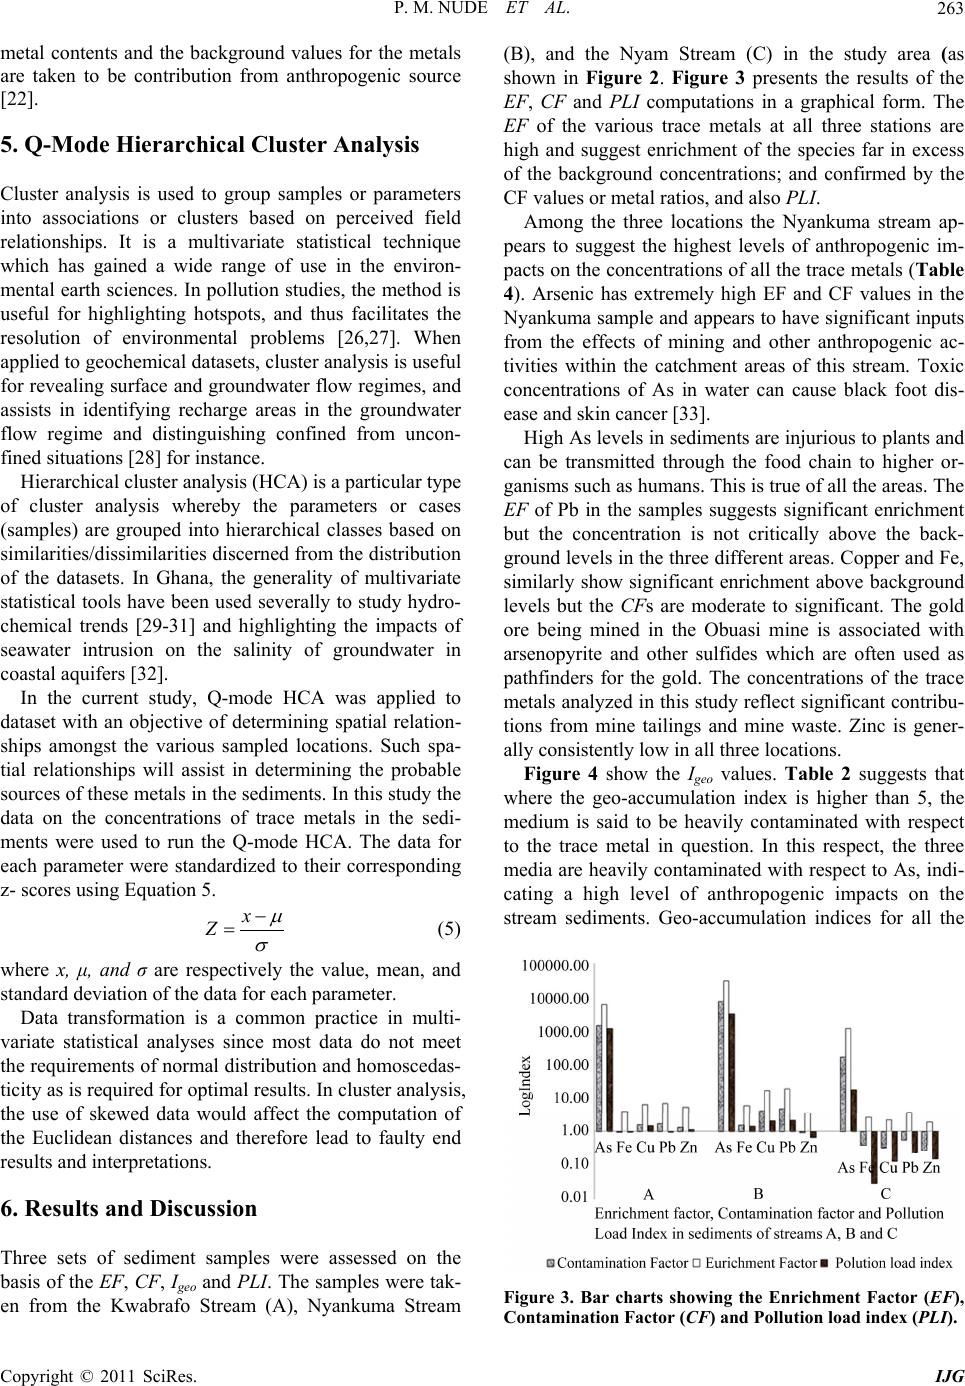 P. M. NUDE ET AL.263 metal contents and the background values for the metals are taken to be contribution from anthropogenic source [22]. 5. Q-Mode Hierarchical Cluster Analysis Cluster analysis is used to group samples or parameters into associations or clusters based on perceived field relationships. It is a multivariate statistical technique which has gained a wide range of use in the environ- mental earth sciences. In pollution studies, the method is useful for highlighting hotspots, and thus facilitates the resolution of environmental problems [26,27]. When applied to geochemical datasets, cluster analysis is useful for revealing surface and groundwater flow regimes, and assists in identifying recharge areas in the groundwater flow regime and distinguishing confined from uncon- fined situations [28] for instance. Hierarchical cluster analysis (HCA) is a particular type of cluster analysis whereby the parameters or cases (samples) are grouped into hierarchical classes based on similarities/dissimilarities discerned from the distribution of the datasets. In Ghana, the generality of multivariate statistical tools have been used severally to study hydro- chemical trends [29-31] and highlighting the impacts of seawater intrusion on the salinity of groundwater in coastal aquifers [32]. In the current study, Q-mode HCA was applied to dataset with an objective of determining spatial relation- ships amongst the various sampled locations. Such spa- tial relationships will assist in determining the probable sources of these metals in the sediments. In this study the data on the concentrations of trace metals in the sedi- ments were used to run the Q-mode HCA. The data for each parameter were standardized to their corresponding z- scores using Equation 5. x Z (5) where x, μ, and σ are respectively the value, mean, and standard deviation of the data for each parameter. Data transformation is a common practice in multi- variate statistical analyses since most data do not meet the requirements of normal distribution and homoscedas- ticity as is required for optimal results. In cluster analysis, the use of skewed data would affect the computation of the Euclidean distances and therefore lead to faulty end results and interpretations. 6. Results and Discussion Three sets of sediment samples were assessed on the basis of the EF, CF, Igeo and PLI. The samples were tak- en from the Kwabrafo Stream (A), Nyankuma Stream (B), and the Nyam Stream (C) in the study area (as shown in Figure 2. Figure 3 presents the results of the EF, CF and PL I computations in a graphical form. The EF of the various trace metals at all three stations are high and suggest enrichment of the species far in excess of the background concentrations; and confirmed by the CF values or metal ratios, and also PLI. Among the three locations the Nyankuma stream ap- pears to suggest the highest levels of anthropogenic im- pacts on the concentrations of all the trace metals (Table 4). Arsenic has extremely high EF and CF values in the Nyankuma sample and appears to have significant inputs from the effects of mining and other anthropogenic ac- tivities within the catchment areas of this stream. Toxic concentrations of As in water can cause black foot dis- ease and skin cancer [33]. High As levels in sediments are injurious to plants and can be transmitted through the food chain to higher or- ganisms such as humans. This is true of all the areas. The EF of Pb in the samples suggests significant enrichment but the concentration is not critically above the back- ground levels in the three different areas. Copper and Fe, similarly show significant enrichment above background levels but the CFs are moderate to significant. The gold ore being mined in the Obuasi mine is associated with arsenopyrite and other sulfides which are often used as pathfinders for the gold. The concentrations of the trace metals analyzed in this study reflect significant contribu- tions from mine tailings and mine waste. Zinc is gener- ally consistently low in all three locations. Figure 4 show the Igeo values. Table 2 suggests that where the geo-accumulation index is higher than 5, the medium is said to be heavily contaminated with respect to the trace metal in question. In this respect, the three media are heavily contaminated with respect to As, indi- cating a high level of anthropogenic impacts on the stream sediments. Geo-accumulation indices for all the Figure 3. Bar charts showing the Enrichment Factor (EF), Contamination Factor (CF) and Pollution load index (PLI). Copyright © 2011 SciRes. IJG 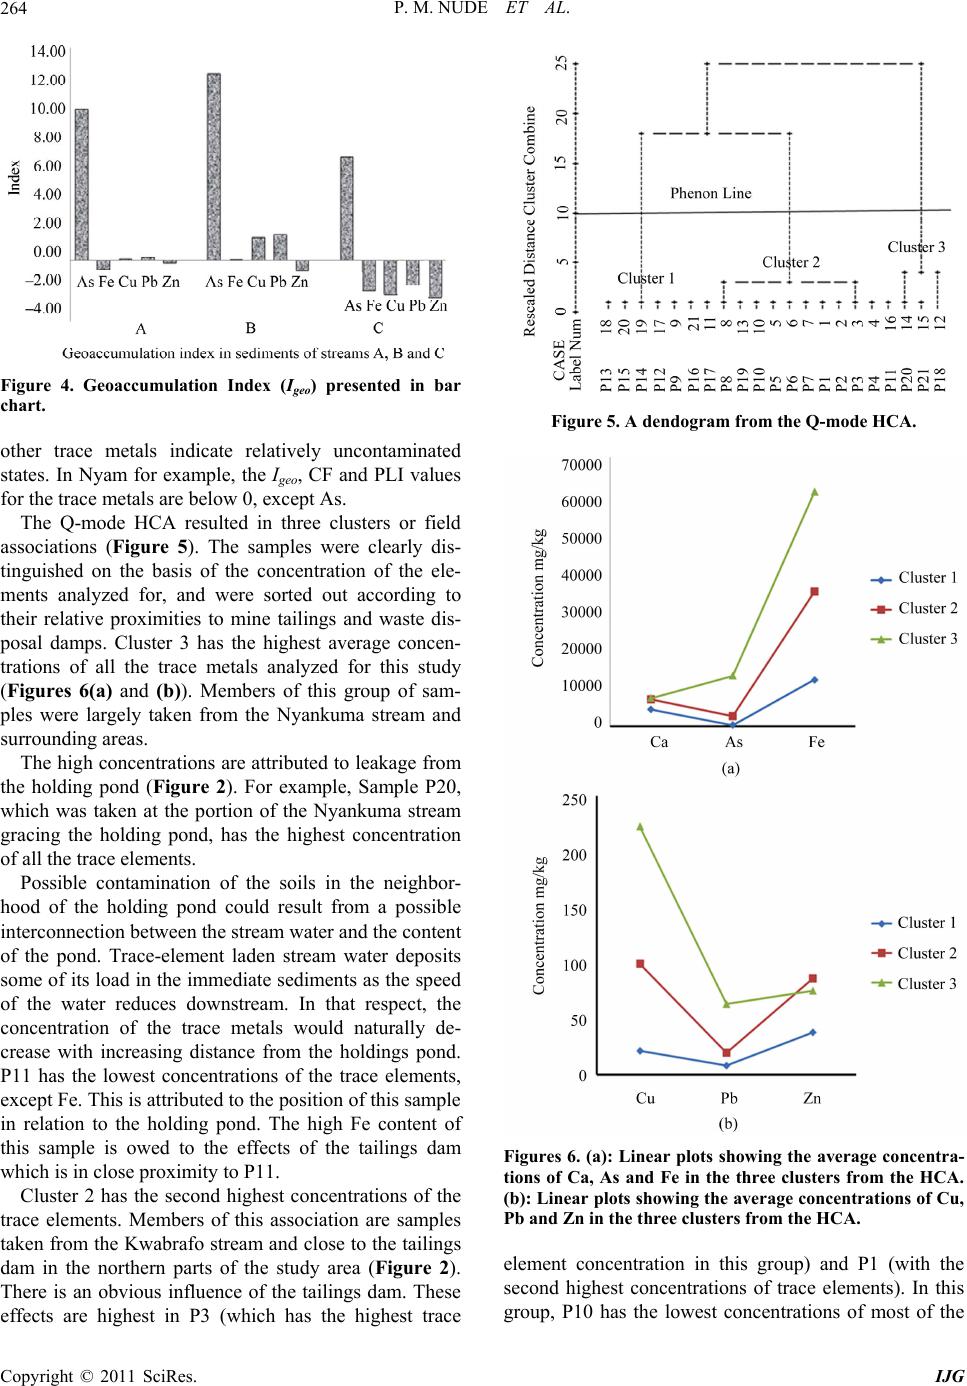 P. M. NUDE ET AL. 264 Figure 4. Geoaccumulation Index (Igeo) presented in bar chart. other trace metals indicate relatively uncontaminated states. In Nyam for example, the Igeo, CF and PLI values for the trace metals are below 0, except As. The Q-mode HCA resulted in three clusters or field associations (Figure 5). The samples were clearly dis- tinguished on the basis of the concentration of the ele- ments analyzed for, and were sorted out according to their relative proximities to mine tailings and waste dis- posal damps. Cluster 3 has the highest average concen- trations of all the trace metals analyzed for this study (Figures 6(a) and (b)). Members of this group of sam- ples were largely taken from the Nyankuma stream and surrounding areas. The high concentrations are attributed to leakage from the holding pond (Figure 2). For example, Sample P20, which was taken at the portion of the Nyankuma stream gracing the holding pond, has the highest concentration of all the trace elements. Possible contamination of the soils in the neighbor- hood of the holding pond could result from a possible interconnection between the stream water and the content of the pond. Trace-element laden stream water deposits some of its load in the immediate sediments as the speed of the water reduces downstream. In that respect, the concentration of the trace metals would naturally de- crease with increasing distance from the holdings pond. P11 has the lowest concentrations of the trace elements, except Fe. This is attributed to the position of this sample in relation to the holding pond. The high Fe content of this sample is owed to the effects of the tailings dam which is in close proximity to P11. Cluster 2 has the second highest concentrations of the trace elements. Members of this association are samples taken from the Kwabrafo stream and close to the tailings dam in the northern parts of the study area (Figure 2). There is an obvious influence of the tailings dam. These effects are highest in P3 (which has the highest trace Figure 5. A dendogram from the Q-mode HCA. Figures 6. (a): Linear plots showing the average concentra- tions of Ca, As and Fe in the three clusters from the HCA. (b): Linear plots showing the average concentrations of Cu, Pb and Zn in the three clusters from the HCA. element concentration in this group) and P1 (with the second highest concentrations of trace elements). In this group, P10 has the lowest concentrations of most of the Copyright © 2011 SciRes. IJG 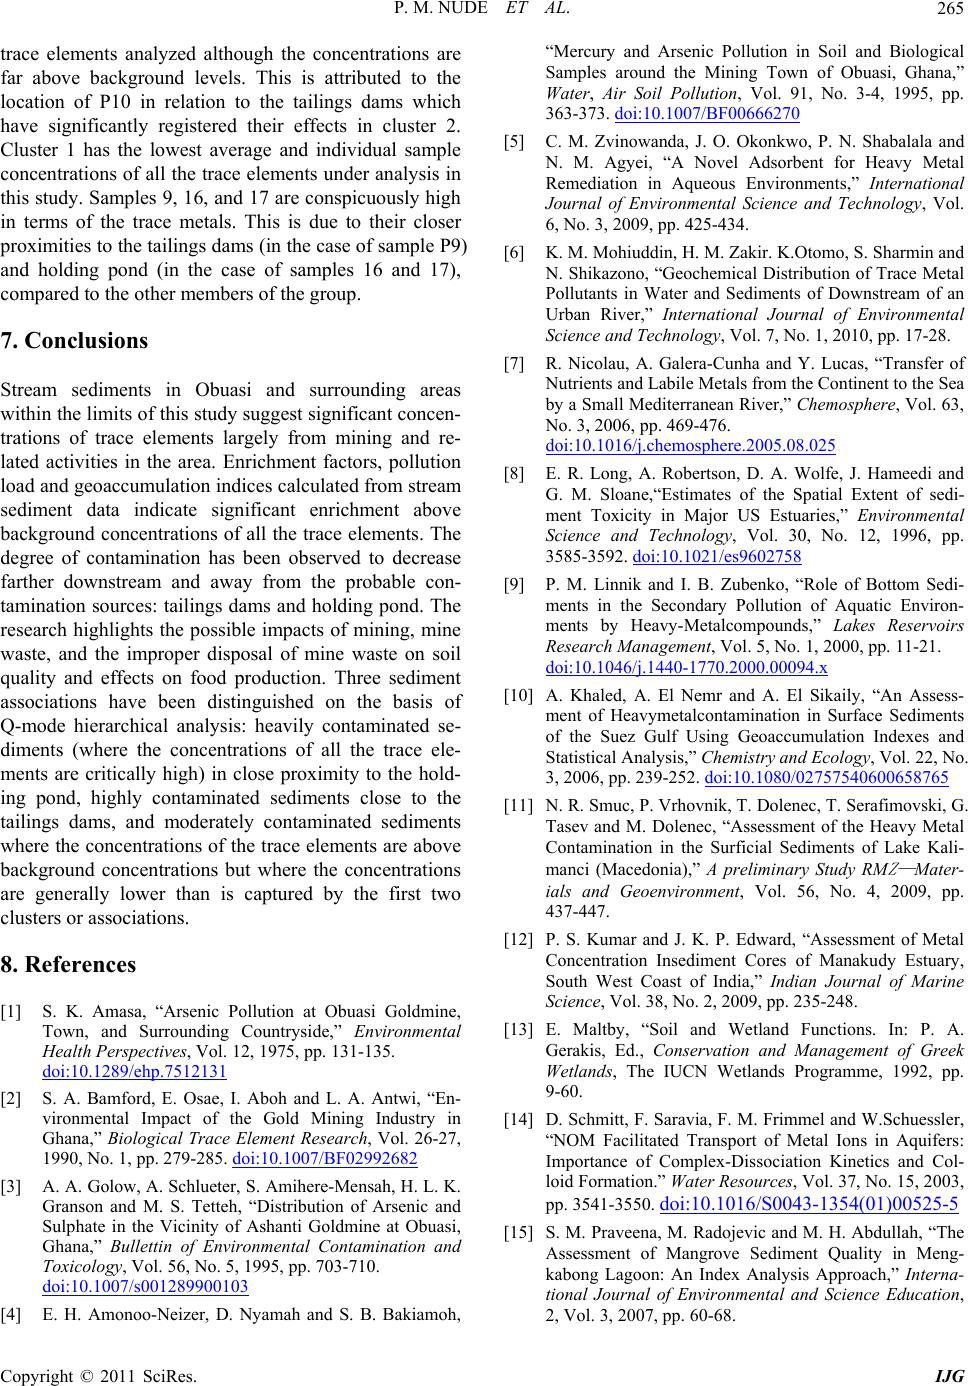 P. M. NUDE ET AL.265 trace elements analyzed although the concentrations are far above background levels. This is attributed to the location of P10 in relation to the tailings dams which have significantly registered their effects in cluster 2. Cluster 1 has the lowest average and individual sample concentrations of all the trace elements under analysis in this study. Samples 9, 16, and 17 are conspicuously high in terms of the trace metals. This is due to their closer proximities to the tailings dams (in the case of sample P9) and holding pond (in the case of samples 16 and 17), compared to the other members of the group. 7. Conclusions Stream sediments in Obuasi and surrounding areas within the limits of this study suggest significant concen- trations of trace elements largely from mining and re- lated activities in the area. Enrichment factors, pollution load and geoaccumulation indices calculated from stream sediment data indicate significant enrichment above background concentrations of all the trace elements. The degree of contamination has been observed to decrease farther downstream and away from the probable con- tamination sources: tailings dams and holding pond. The research highlights the possible impacts of mining, mine waste, and the improper disposal of mine waste on soil quality and effects on food production. Three sediment associations have been distinguished on the basis of Q-mode hierarchical analysis: heavily contaminated se- diments (where the concentrations of all the trace ele- ments are critically high) in close proximity to the hold- ing pond, highly contaminated sediments close to the tailings dams, and moderately contaminated sediments where the concentrations of the trace elements are above background concentrations but where the concentrations are generally lower than is captured by the first two clusters or associations. 8. References [1] S. K. Amasa, “Arsenic Pollution at Obuasi Goldmine, Town, and Surrounding Countryside,” Environmental Health Perspectives, Vol. 12, 1975, pp. 131-135. doi:10.1289/ehp.7512131 [2] S. A. Bamford, E. Osae, I. Aboh and L. A. Antwi, “En- vironmental Impact of the Gold Mining Industry in Ghana,” Biological Trace Element Research, Vol. 26-27, 1990, No. 1, pp. 279-285. doi:10.1007/BF02992682 [3] A. A. Golow, A. Schlueter, S. Amihere-Mensah, H. L. K. Granson and M. S. Tetteh, “Distribution of Arsenic and Sulphate in the Vicinity of Ashanti Goldmine at Obuasi, Ghana,” Bullettin of Environmental Contamination and Toxicology, Vol. 56, No. 5, 1995, pp. 703-710. doi:10.1007/s001289900103 [4] E. H. Amonoo-Neizer, D. Nyamah and S. B. Bakiamoh, “Mercury and Arsenic Pollution in Soil and Biological Samples around the Mining Town of Obuasi, Ghana,” Water, Air Soil Pollution, Vol. 91, No. 3-4, 1995, pp. 363-373. doi:10.1007/BF00666270 [5] C. M. Zvinowanda, J. O. Okonkwo, P. N. Shabalala and N. M. Agyei, “A Novel Adsorbent for Heavy Metal Remediation in Aqueous Environments,” International Journal of Environmental Science and Technology, Vol. 6, No. 3, 2009, pp. 425-434. [6] K. M. Mohiuddin, H. M. Zakir. K.Otomo, S. Sharmin and N. Shikazono, “Geochemical Distribution of Trace Metal Pollutants in Water and Sediments of Downstream of an Urban River,” International Journal of Environmental Science and Technology, Vol. 7, No. 1, 2010, pp. 17-28. [7] R. Nicolau, A. Galera-Cunha and Y. Lucas, “Transfer of Nutrients and Labile Metals from the Continent to the Sea by a Small Mediterranean River,” Chemosphere, Vol. 63, No. 3, 2006, pp. 469-476. doi:10.1016/j.chemosphere.2005.08.025 [8] E. R. Long, A. Robertson, D. A. Wolfe, J. Hameedi and G. M. Sloane,“Estimates of the Spatial Extent of sedi- ment Toxicity in Major US Estuaries,” Environmental Science and Technology, Vol. 30, No. 12, 1996, pp. 3585-3592. doi:10.1021/es9602758 [9] P. M. Linnik and I. B. Zubenko, “Role of Bottom Sedi- ments in the Secondary Pollution of Aquatic Environ- ments by Heavy-Metalcompounds,” Lakes Reservoirs Research Management, Vol. 5, No. 1, 2000, pp. 11-21. doi:10.1046/j.1440-1770.2000.00094.x [10] A. Khaled, A. El Nemr and A. El Sikaily, “An Assess- ment of Heavymetalcontamination in Surface Sediments of the Suez Gulf Using Geoaccumulation Indexes and Statistical Analysis,” Chemistry and Ecology, Vol. 22, No. 3, 2006, pp. 239-252. doi:10.1080/02757540600658765 [11] N. R. Smuc, P. Vrhovnik, T. Dolenec, T. Serafimovski, G. Tasev and M. Dolenec, “Assessment of the Heavy Metal Contamination in the Surficial Sediments of Lake Kali- manci (Macedonia),” A preliminary Study RM Z— Mater- ials and Geoenvironment, Vol. 56, No. 4, 2009, pp. 437-447. [12] P. S. Kumar and J. K. P. Edward, “Assessment of Metal Concentration Insediment Cores of Manakudy Estuary, South West Coast of India,” Indian Journal of Marine Science, Vol. 38, No. 2, 2009, pp. 235-248. [13] E. Maltby, “Soil and Wetland Functions. In: P. A. Gerakis, Ed., Conservation and Management of Greek Wetlands, The IUCN Wetlands Programme, 1992, pp. 9-60. [14] D. Schmitt, F. Saravia, F. M. Frimmel and W.Schuessler, “NOM Facilitated Transport of Metal Ions in Aquifers: Importance of Complex-Dissociation Kinetics and Col- loid Formation.” Water Resources, Vol. 37, No. 15, 2003, pp. 3541-3550. doi:10.1016/S00 43-1354(01) 00525-5 [15] S. M. Praveena, M. Radojevic and M. H. Abdullah, “The Assessment of Mangrove Sediment Quality in Meng- kabong Lagoon: An Index Analysis Approach,” Interna- tional Journal of Environmental and Science Education, 2, Vol. 3, 2007, pp. 60-68. Copyright © 2011 SciRes. IJG 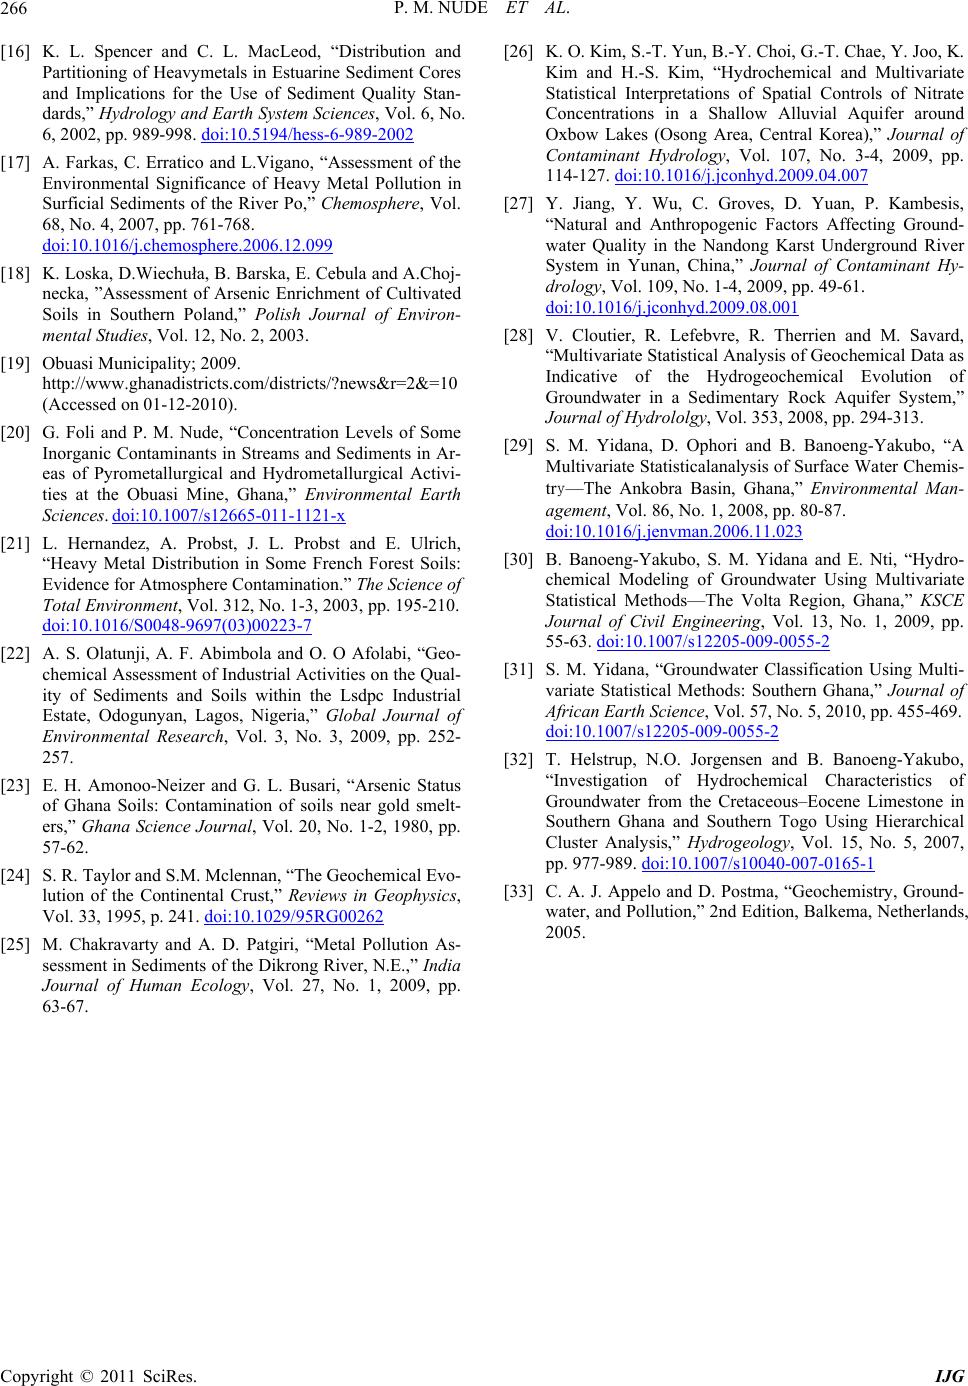 P. M. NUDE ET AL. Copyright © 2011 SciRes. IJG 266 [16] K. L. Spencer and C. L. MacLeod, “Distribution and Partitioning of Heavymetals in Estuarine Sediment Cores and Implications for the Use of Sediment Quality Stan- dards,” Hydrology and Earth System Sciences, Vol. 6, No. 6, 2002, pp. 989-998. doi:10.5194/hess-6-989-2002 [17] A. Farkas, C. Erratico and L.Vigano, “Assessment of the Environmental Significance of Heavy Metal Pollution in Surficial Sediments of the River Po,” Chemosphere, Vol. 68, No. 4, 2007, pp. 761-768. doi:10.1016/j.chemosphere.2006.12.099 [18] K. Loska, D.Wiechuła, B. Barska, E. Cebula and A.Choj- necka, ”Assessment of Arsenic Enrichment of Cultivated Soils in Southern Poland,” Polish Journal of Environ- mental Studies, Vol. 12, No. 2, 2003. [19] Obuasi Municipality; 2009. http://www.ghanadistricts.com/districts/?news&r=2&=10 (Accessed on 01-12-2010). [20] G. Foli and P. M. Nude, “Concentration Levels of Some Inorganic Contaminants in Streams and Sediments in Ar- eas of Pyrometallurgical and Hydrometallurgical Activi- ties at the Obuasi Mine, Ghana,” Environmental Earth Sciences. doi:10.1007/s12665-011-1121-x [21] L. Hernandez, A. Probst, J. L. Probst and E. Ulrich, “Heavy Metal Distribution in Some French Forest Soils: Evidence for Atmosphere Contamination.” The Science of Total Environment, Vol. 312, No. 1-3, 2003, pp. 195-210. doi:10.1016/S0048-9697(03)00223-7 [22] A. S. Olatunji, A. F. Abimbola and O. O Afolabi, “Geo- chemical Assessment of Industrial Activities on the Qual- ity of Sediments and Soils within the Lsdpc Industrial Estate, Odogunyan, Lagos, Nigeria,” Global Journal of Environmental Research, Vol. 3, No. 3, 2009, pp. 252- 257. [23] E. H. Amonoo-Neizer and G. L. Busari, “Arsenic Status of Ghana Soils: Contamination of soils near gold smelt- ers,” Ghana Science Journal, Vol. 20, No. 1-2, 1980, pp. 57-62. [24] S. R. Taylor and S.M. Mclennan, “The Geochemical Evo- lution of the Continental Crust,” Reviews in Geophysics, Vol. 33, 1995, p. 241. doi:10.1029/95RG00262 [25] M. Chakravarty and A. D. Patgiri, “Metal Pollution As- sessment in Sediments of the Dikrong River, N.E.,” India Journal of Human Ecology, Vol. 27, No. 1, 2009, pp. 63-67. [26] K. O. Kim, S.-T. Yun, B.-Y. Choi, G.-T. Chae, Y. Joo, K. Kim and H.-S. Kim, “Hydrochemical and Multivariate Statistical Interpretations of Spatial Controls of Nitrate Concentrations in a Shallow Alluvial Aquifer around Oxbow Lakes (Osong Area, Central Korea),” Journal of Contaminant Hydrology, Vol. 107, No. 3-4, 2009, pp. 114-127. doi:10.1016/j.jconhyd.2009.04.007 [27] Y. Jiang, Y. Wu, C. Groves, D. Yuan, P. Kambesis, “Natural and Anthropogenic Factors Affecting Ground- water Quality in the Nandong Karst Underground River System in Yunan, China,” Journal of Contaminant Hy- drology, Vol. 109, No. 1-4, 2009, pp. 49-61. doi:10.1016/j.jconhyd.2009.08.001 [28] V. Cloutier, R. Lefebvre, R. Therrien and M. Savard, “Multivariate Statistical Analysis of Geochemical Data as Indicative of the Hydrogeochemical Evolution of Groundwater in a Sedimentary Rock Aquifer System,” Journal of Hydrololgy, Vol. 353, 2008, pp. 294-313. [29] S. M. Yidana, D. Ophori and B. Banoeng-Yakubo, “A Multivariate Statisticalanalysis of Surface Water Chemis- try—The Ankobra Basin, Ghana,” Environmental Man- agement, Vol. 86, No. 1, 2008, pp. 80-87. doi:10.1016/j.jenvman.2006.11.023 [30] B. Banoeng-Yakubo, S. M. Yidana and E. Nti, “Hydro- chemical Modeling of Groundwater Using Multivariate Statistical Methods—The Volta Region, Ghana,” KSCE Journal of Civil Engineering, Vol. 13, No. 1, 2009, pp. 55-63. doi:10.1007/s12205-009-0055-2 [31] S. M. Yidana, “Groundwater Classification Using Multi- variate Statistical Methods: Southern Ghana,” Journal of African Earth Science, Vol. 57, No. 5, 2010, pp. 455-469. doi:10.1007/s12205-009-0055-2 [32] T. Helstrup, N.O. Jorgensen and B. Banoeng-Yakubo, “Investigation of Hydrochemical Characteristics of Groundwater from the Cretaceous–Eocene Limestone in Southern Ghana and Southern Togo Using Hierarchical Cluster Analysis,” Hydrogeology, Vol. 15, No. 5, 2007, pp. 977-989. doi:10.1007/s10040-007-0165-1 [33] C. A. J. Appelo and D. Postma, “Geochemistry, Ground- water, and Pollution,” 2nd Edition, Balkema, Netherlands, 2005.
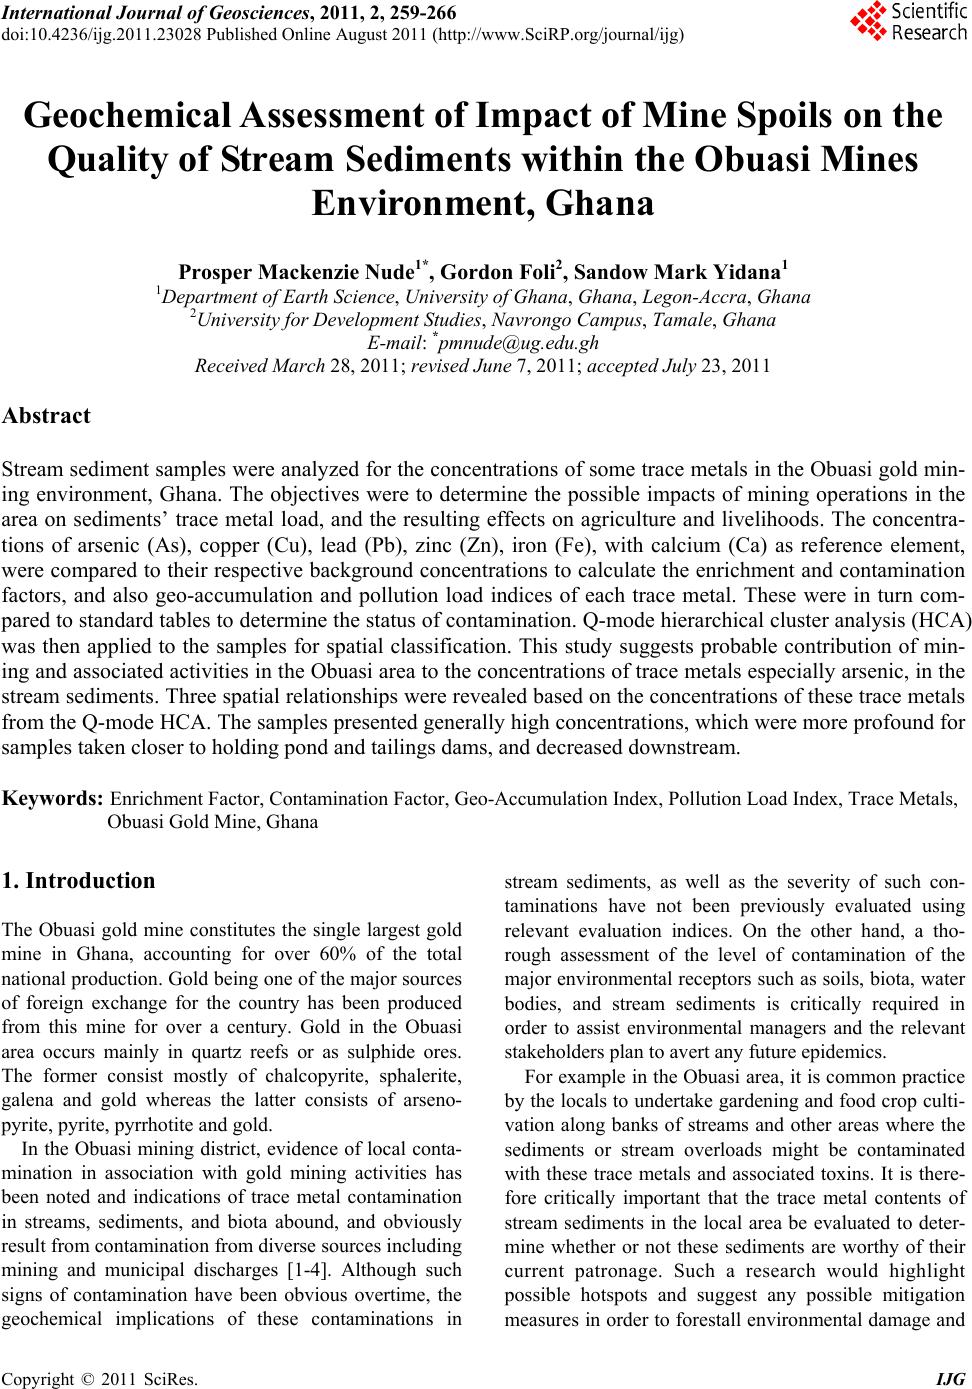
|