Paper Menu >>
Journal Menu >>
 Sequence based prediction of relative solvent accessibility using two-stage support vector regression with confidence values Sequence based prediction of relative solvent accessibility using two-stage support vector regression with confidence values 1Department of Electrical and Computer Engineering, University of Alberta, T6G 2V4, Edmonton, CANADA. * Correspondence should be addressed to Lukasz Kurgan (lkurgan@ece.ualberta.ca). tural biology due to the large and exponentially grow- ABSTRACT ing gap between the number of known protein sequences and the number of known structures. Predicted relative solvent accessibility (RSA) Despite several decades of extensive research in ter- provides useful information for prediction oftiary structure prediction, this task is still a big chal- binding sites and reconstruction of the 3D-lenge, especially for sequences that do not have a sig- structure based on a protein sequence.nificant sequence similarity with known structures Recent years observed development of sev-[1].As a result, the predictions of the solvent accessi- eral RSA prediction methods including thosebility [2] and the secondary structure [3] are that generate real values and those that pre-addressed as an intermediate step towards the predic- dict discrete states (buried vs. exposed). We tion of the tertiary structure. The relative solvent propose a novel method for real value predic-accessibility (RSA) reflects the degree to which a res- tion that aims at minimizing the prediction idue interacts with the solvent molecules. Since pro- error when compared with six existing meth-tein-protein and protein-ligand interactions occur at ods. The proposed method is based on a two-the protein surface, only the residues that have a stage Support Vector Regression (SVR) pre-large surface area exposed to the solvent can possibly dictor. The improved prediction quality is abind to the ligands and other proteins. As a result, pre- result of the developed composite sequencediction of solvent accessibility provides useful infor- representation, which includes a custom-mation for prediction of binding sites [4] and is selected subset of features from the PSI-vitally important for understanding the binding mech- BLAST profile, secondary structure pre-anism of proteins [5]. Chan and Dill pointed that the dicted with PSI-PRED, and binary code that burial of core residues is the driving force in protein indicates position of a given residue with folding, which suggests that knowledge of localiza- respect to sequence termini. Cross valida-tion of individual residues (surface vs. buried) pro- tion tests on a benchmark dataset show thatvides useful information to reconstruct the 3D- our method achieves 14.3 mean absolutestructure of proteins [6-8]. error and 0.68 correlation. We also propose aThe existing solvent accessibility prediction meth- confidence value that is associated with each ods use the protein sequence, which is converted into predicted RSA values. The confidence is com-a fixed-size feature-based representation, as an input puted based on the difference in predictions to predict the RSA for each of the residues. These from the two-stage SVR and a second two-methods can be divided into two main groups: stage Linear Regression (LR) predictor. The Real valued predictors predict RSA value (the confidence values can be used to indicate definition is given in the Materials section). The rep- the quality of the output RSA predictions.resentative existing methods are based on linear regression [9], neural network based regression [11], neural networks [12], support vector regression [10, 13, 15], and look up table [14]. In Ahmad's study, binary coding of the sequence was taken as the input features [12], while all other studies used the evolu- tionary information in the form of the PSSM profile 1. INTRODUCTIONderived with PSI-BLAST as the input features [9-11, The knowledge of three dimensional protein struc-13-15]. ture plays the key role in understanding protein'sdiscrete valued predictors classify each residue function. Computational prediction of the tertiaryinto a predefined set classes. The classes are usually protein structure is one of the central topics in struc- Keywords: Relative solvent accessibility; Support vector regression; PSI-BLAST; PSI- PRED; Secondary protein structure 11 1 Ke Chen, Michal Kurgan & Lukasz Kurgan* J. Biomedical Science and Engineering, 2008, 1, 1-9Scientific Research Publishing JBiSE Published Online May 2008 in SciRes.http://www.srpublishing.org/journal/jbise SciResCopyright ©2008 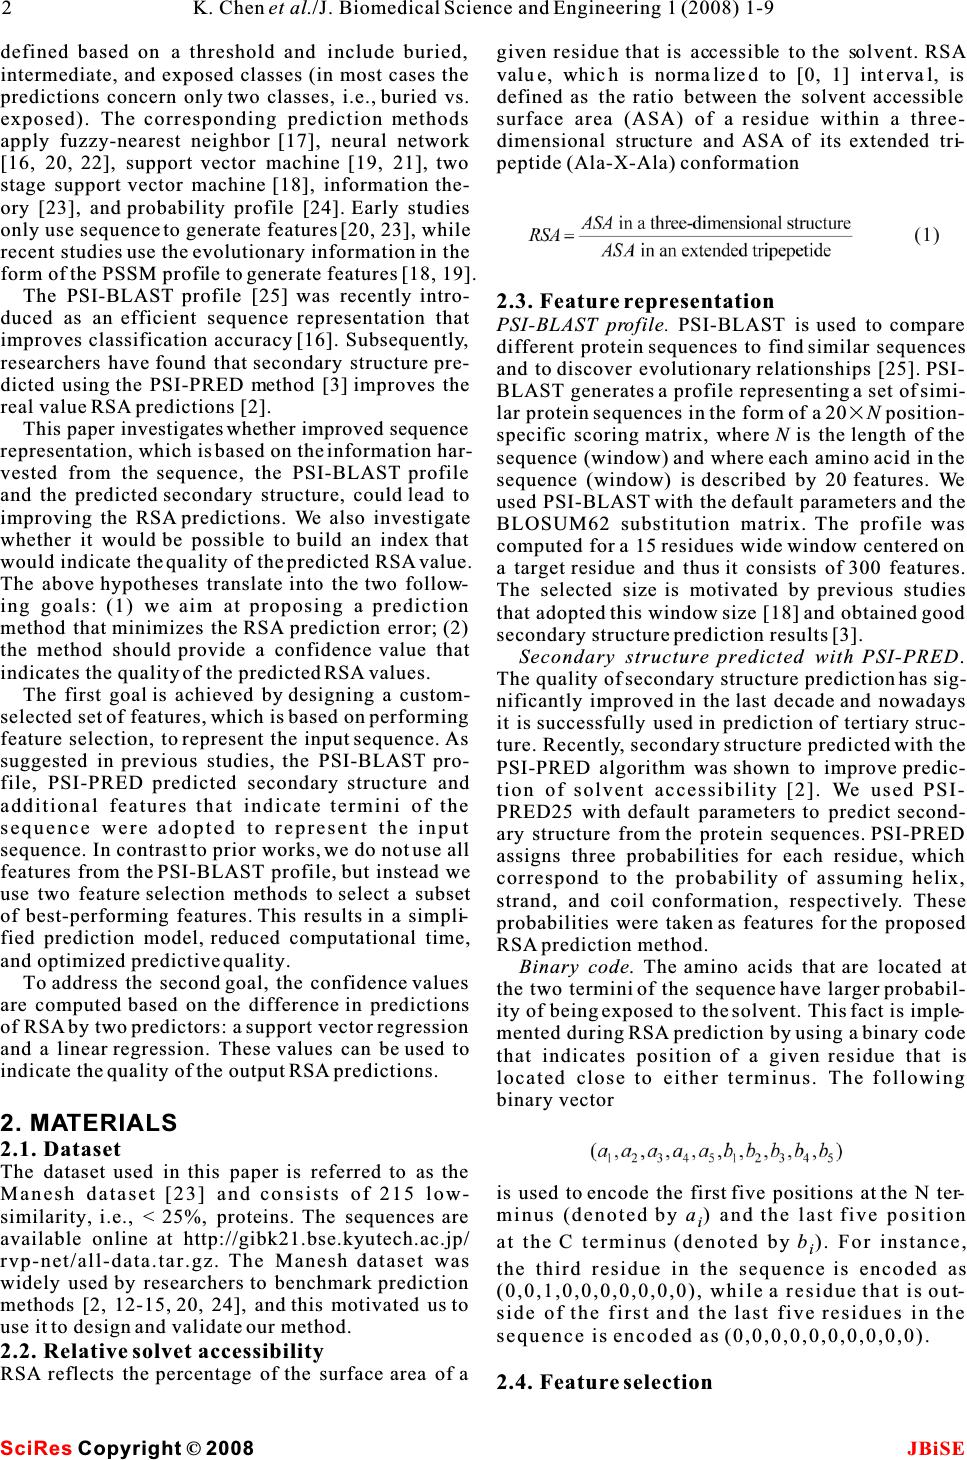 defined based on a threshold and include buried, given residue that is accessible to the solvent. RSA intermediate,andexposedclasses(inmostcasesthevalue, which is normalized to [0, 1] interval, is predictions concern only two classes, i.e., buried vs. defined as the ratio between the solvent accessible exposed). The corresponding prediction methods surface area (ASA) of a residue within a three- apply fuzzy-nearest neighbor [17], neural network dimensional structure and ASA of its extended tri- [16, 20, 22], support vector machine [19, 21], two peptide(Ala-X-Ala)conformation stage support vector machine [18], information the- ory [23], and probability profile [24]. Early studies only use sequence to generate features [20, 23], while recent studies use the evolutionary information in the form of the PSSM profile to generate features [18, 19]. The PSI-BLAST profile [25] was recently intro-2.3. Feature representation duced as an efficient sequence representation that PSI-BLAST profile. PSI-BLAST is used to compare improves classification accuracy [16]. Subsequently,different protein sequences to find similar sequences researchers have found that secondary structure pre-and to discover evolutionary relationships [25]. PSI- dicted using the PSI-PRED method [3] improves theBLAST generates a profile representing a set of simi- real value RSA predictions [2].lar protein sequences in the form of a 20Nposition- This paper investigates whether improved sequence specific scoring matrix, whereNis the length of the representation, which is based on the information har-sequence (window) and where each amino acid in the vested from the sequence, the PSI-BLAST profile sequence (window) is described by 20 features. We and the predicted secondary structure, could lead to used PSI-BLAST with the default parameters and the improving the RSA predictions. We also investigateBLOSUM62 substitution matrix. The profile was whether it would be possible to build an index that computed for a 15 residues wide window centered on would indicate the quality of the predicted RSA value. a target residue and thus it consists of 300 features. The above hypotheses translate into the two follow-The selected size is motivated by previous studies ing goals: (1) we aim at proposing a prediction that adopted this window size [18] and obtained good method that minimizes the RSA prediction error; (2) secondary structure prediction results [3]. the method should provide a confidence value that Secondary structure predicted with PSI-PRED. indicates the quality of the predicted RSA values. The quality of secondary structure prediction has sig- The first goal is achieved by designing a custom-nificantly improved in the last decade and nowadays selected set of features, which is based on performing it is successfully used in prediction of tertiary struc- feature selection, to represent the input sequence. Asture. Recently, secondary structure predicted with the suggested in previous studies, the PSI-BLAST pro-PSI-PRED algorithm was shown to improve predic- file, PSI-PRED predicted secondary structure andtion of solvent accessibility [2]. We used PSI- additional features that indicate termini of the PRED25 with default parameters to predict second- sequence were adopted to represent the input ary structure from the protein sequences. PSI-PRED sequence. In contrast to prior works, we do not use all assigns three probabilities for each residue, which features from the PSI-BLAST profile, but instead wecorrespond to the probability of assuming helix, use two feature selection methods to select a subsetstrand, and coil conformation, respectively. These of best-performing features. This results in a simpli-probabilities were taken as features for the proposed fied prediction model, reduced computational time,RSA prediction method. and optimized predictive quality.Binary code. The amino acids that are located at To address the second goal, the confidence values the two termini of the sequence have larger probabil- are computed based on the difference in predictionsity of being exposed to the solvent. This fact is imple- of RSA by two predictors: a support vector regression mented during RSA prediction by using a binary code and a linear regression. These values can be used to that indicates position of a given residue that is indicate the quality of the output RSA predictions. located close to either terminus. The following binary vector 2. MATERIALS 2.1. Dataset The dataset used in this paper is referred to as the is used to encode the first five positions at the N ter- Manesh dataset [23] and consists of 215 low- minus (denoted by a) and the last five position similarity, i.e., < 25%, proteins. The sequences are i available online at http://gibk21.bse.kyutech.ac.jp/at the C terminus (denoted byb). For instance, i rvp-net/all-data.tar.gz. The Manesh dataset was the third residue in the sequence is encoded as widely used by researchers to benchmark prediction (0,0,1,0,0,0,0,0,0,0), while a residue that is out- methods [2, 12-15, 20, 24], and this motivated us to side of the first and the last five residues in the use it to design and validate our method.sequence is encoded as (0,0,0,0,0,0,0,0,0,0). 2.2. Relative solvet accessibility RSA reflects the percentage of the surface area of a 2.4. Feature selection 2K. Chen et al./J. Biomedical Science and Engineering 1 (2008) 1-9 SciRes JBiSE Copyright © 2008 (1) 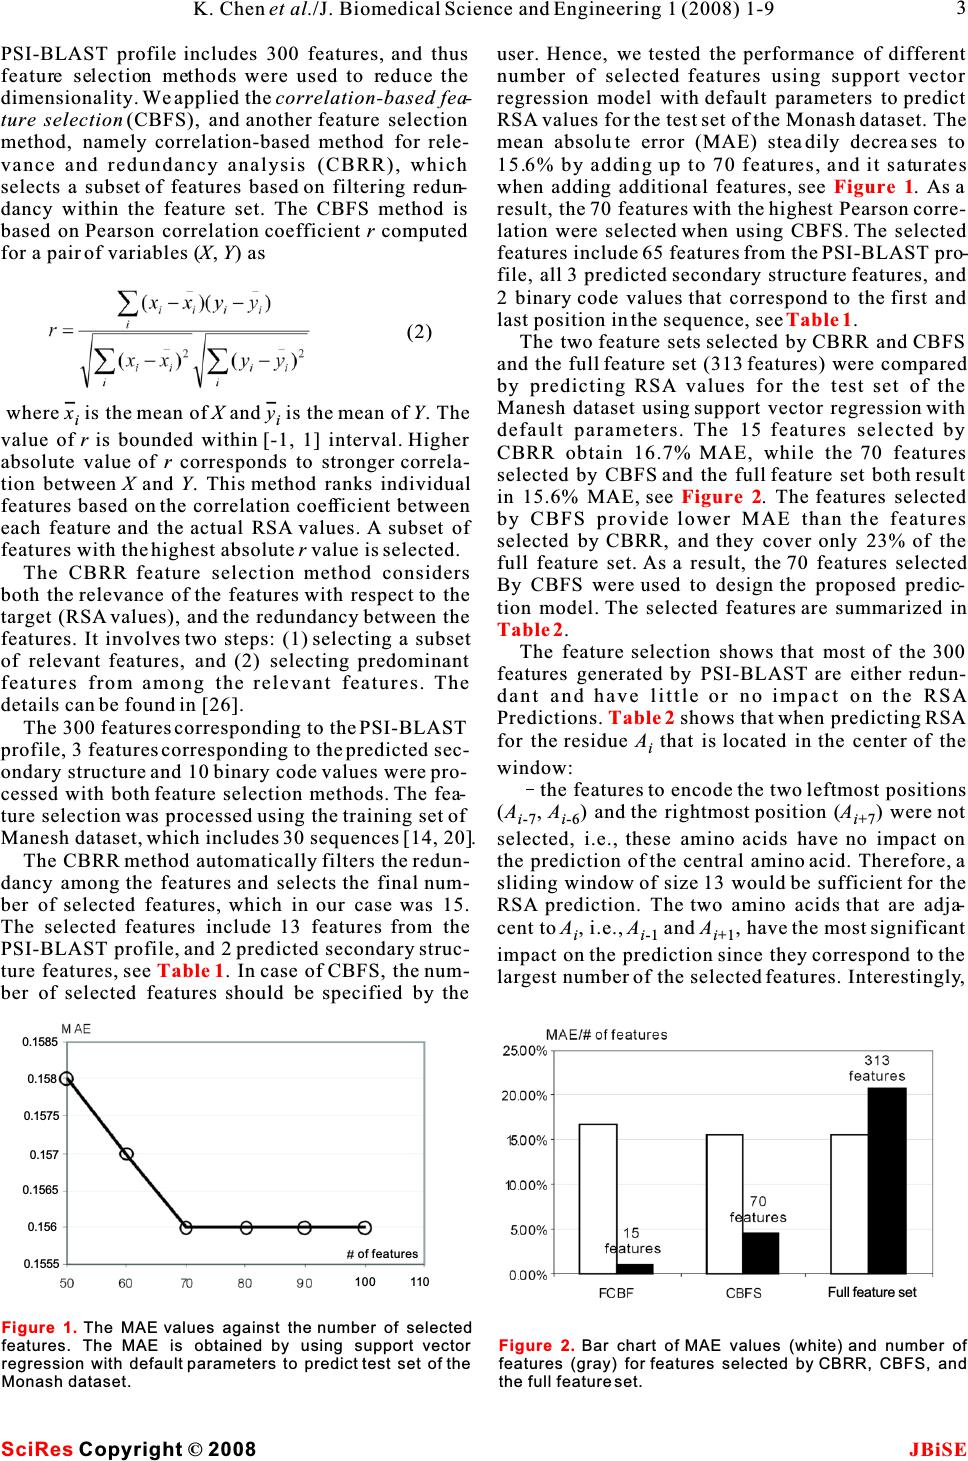 PSI-BLAST profile includes 300 features, and thus user. Hence, we tested the performance of different feature selection methods were used to reduce thenumber of selected features using support vector dimensionality. We applied thecorrelation-based fea-regression model with default parameters to predict ture selection (CBFS), and another feature selectionRSA values for the test set of the Monash dataset. The method, namely correlation-based method for rele-mean absolute error (MAE) steadily decreases to vance and redundancy analysis (CBRR), which 15.6% by adding up to 70 features, and it saturates selects a subset of features based on filtering redun-when adding additional features, see . As a dancy within thefeature set.The CBFS method isresult, the 70 features with the highest Pearson corre- based on Pearson correlation coefficient r computed lation were selected when using CBFS. The selected for a pair of variables (X,Y) asfeatures include 65 features from the PSI-BLAST pro- file, all 3 predicted secondary structure features, and 2 binary code values that correspond to the first and last position in the sequence, see. The two feature sets selected by CBRR and CBFS and the full feature set (313 features) were compared by predicting RSA values for the test set of the Manesh dataset using support vector regression with where x is the mean ofX and y is the mean ofY. The ii default parameters. The 15 features selected by value ofris bounded within [-1, 1] interval. Higher CBRR obtain 16.7% MAE, while the 70 features absolute value of r corresponds to stronger correla-selected by CBFS and the full feature set both result tion between X and Y. This method ranks individualin 15.6% MAE, see . The features selected features based on the correlation coefficient between by CBFS provide lower MAE than the features each feature and the actual RSA values. A subset ofselected by CBRR, and they cover only 23% of the features with the highest absolute r value is selected.full feature set. As a result, the 70 features selected The CBRR feature selection method considersBy CBFS were used to design the proposed predic- both the relevance of the features with respect to thetion model. The selected features are summarized in target (RSA values), and the redundancy between the features. It involves two steps: (1) selecting a subsetThe feature selection shows that most of the 300 of relevant features, and (2) selecting predominant features generated by PSI-BLAST are either redun- features from among the relevant features. The dant and have little or no impact on the RSA details can be found in [26].Predictions. shows that when predicting RSA The 300 features corresponding to the PSI-BLAST for the residue A that is located in the center of the i profile, 3 features corresponding to the predicted sec-window: ondary structure and 10 binary code values were pro-the features to encode the two leftmost positions cessed with both feature selection methods. The fea-(A,A) and the rightmost position (A) were not ture selection was processed using the training set of i-7 i-6 i+7 Manesh dataset, which includes 30 sequences [14, 20].selected, i.e., these amino acids have no impact on The CBRR method automatically filters the redun-the prediction of the central amino acid. Therefore, a dancy among the features and selects the final num-sliding window of size 13 would be sufficient for the ber of selected features, which in our case was 15. RSA prediction. The two amino acids that are adja- The selected features include 13 features from thecent to A, i.e.,Aand A, have the most significant ii-1 i+1 PSI-BLAST profile, and 2 predicted secondary struc-impact on the prediction since they correspond to the ture features, see . In case of CBFS, the num-largest number of the selected features. Interestingly, ber of selected features should be specified by the Figure 1 Table 1 Figure 2 Table 2 Table 2 Table 1 . Figure 1. The MAE values against the number of selected features. The MAE is obtained by using support vector regression with default parameters to predict test set of the Monash dataset. Figure 2. Bar chart of MAE values (white) and number of features (gray) for features selected by CBRR, CBFS, and the full feature set. 3 K. Chen et al./J. Biomedical Science and Engineering 1 (2008) 1-9 SciRes JBiSE Copyright©2008 (2) 100 110 of features 0.1585 0.158 0.1575 0.157 0.1565 0.156 0.1555 Full feature set 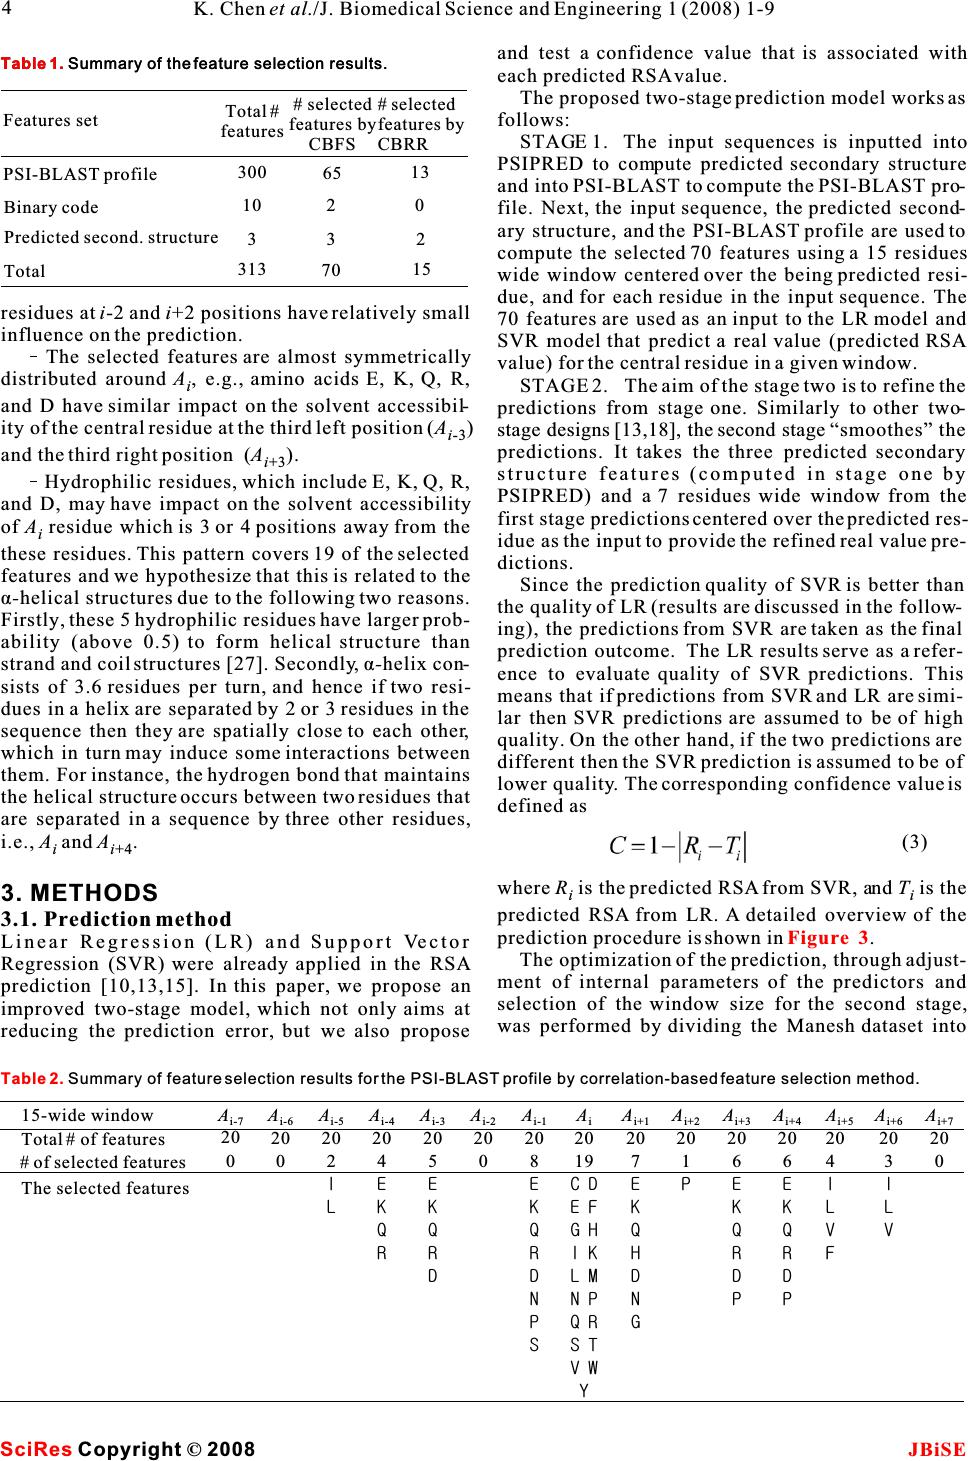 and test a confidence value that is associated with each predicted RSA value. The proposed two-stage prediction model works as follows: STAGE1.The input sequences is inputted into PSIPRED to compute predicted secondary structure and into PSI-BLAST to compute the PSI-BLAST pro- file. Next, the input sequence, the predicted second- ary structure, and the PSI-BLAST profile are used to compute the selected 70 features using a 15 residues wide window centered over the being predicted resi- due, and for each residue in the input sequence. The residues at i-2 andi+2 positions have relatively small 70 features are used as an input to the LR model and influence on the prediction.SVR model that predict a real value (predicted RSA The selected features are almost symmetricallyvalue) for the central residue in a given window. distributed aroundA, e.g., amino acids E, K, Q, R, iSTAGE 2. The aim of the stage two is to refine the and D have similar impact on the solvent accessibil-predictions from stage one. Similarly to other two- ity of the central residue at the third left position (A)stage designs [13,18], the second stage“smoothes” the i-3 predictions. It takes the three predicted secondary and the third right position (A). i+3 structure features (computed in stage one by Hydrophilic residues, which include E, K, Q, R, PSIPRED) and a 7 residues wide window from the and D, may have impact on the solvent accessibilityfirst stage predictions centered over the predicted res- of A residue which is 3 or 4 positions away from the iidue as the input to provide the refined real value pre- these residues. This pattern covers 19 of the selected dictions. features and we hypothesize that this is related to theSince the prediction quality of SVR is better than á-helical structures due to the following two reasons.the quality of LR (results are discussed in the follow- Firstly, these 5 hydrophilic residues have larger prob-ing), the predictions from SVR are taken as the final ability (above 0.5) to form helical structure than prediction outcome.The LR results serve as a refer- strand and coil structures [27]. Secondly,á-helix con-ence to evaluate quality of SVR predictions. This sists of 3.6 residues per turn, and hence if two resi-means that if predictions from SVR and LR are simi- dues in a helix are separated by 2 or 3 residues in the lar then SVR predictions are assumed to be of high sequence then they are spatially close to each other,quality. On the other hand, if the two predictions are which in turn may induce some interactions between different then the SVR prediction is assumed to be of them. For instance, the hydrogen bond that maintainslower quality. The corresponding confidence value is the helical structure occurs between two residues that defined as are separated in a sequence by three other residues, i.e., A and A. ii+4 where R is the predicted RSA from SVR, andT is the 3. METHODSii predicted RSA from LR. A detailed overview of the 3.1. Prediction methodprediction procedure is shown in . Linear Regression (LR) and Support VectorThe optimization of the prediction, through adjust- Regression (SVR) were already applied in the RSAment of internal parameters of the predictors and prediction [10,13,15]. In this paper, we propose anselection of the window size for the second stage, improved two-stage model, which not only aims at was performed by dividing the Manesh dataset into reducing the prediction error, but we also propose Figure 3 Table 1. Summary of the feature selection results. Features set PSI-BLAST profile Binary code Predicted second.structure Total Total # features 300 10 3 313 # selected features by CBFS 65 2 3 70 # selected features by CBRR 13 0 2 15 Table 2.Summary of feature selection results for the PSI-BLAST profile by correlation-based feature selection method. 15-wide window Total # of features # ofselected features The selected features Ai-7 20 0 Ai-6 20 0 Ai-5 20 2 I L Ai-4 20 4 E K Q R Ai-3 20 5 E K Q R D Ai-2 20 0 Ai-1 20 8 E K Q R D N P S Ai 20 19 C D E F G H I K L M N P Q R S T V W Y Ai+1 20 7 E K Q H D N G Ai+2 20 1 P Ai+3 20 6 E K Q R D P Ai+4 20 6 E K Q R D P Ai+5 20 4 I L V F Ai+6 20 3 I L V Ai+7 20 0 (3) Table 1. Summary of the feature selection results. 4K. Chen et al./J. Biomedical Science and Engineering 1 (2008) 1-9 SciRes JBiSE Copyright©2008 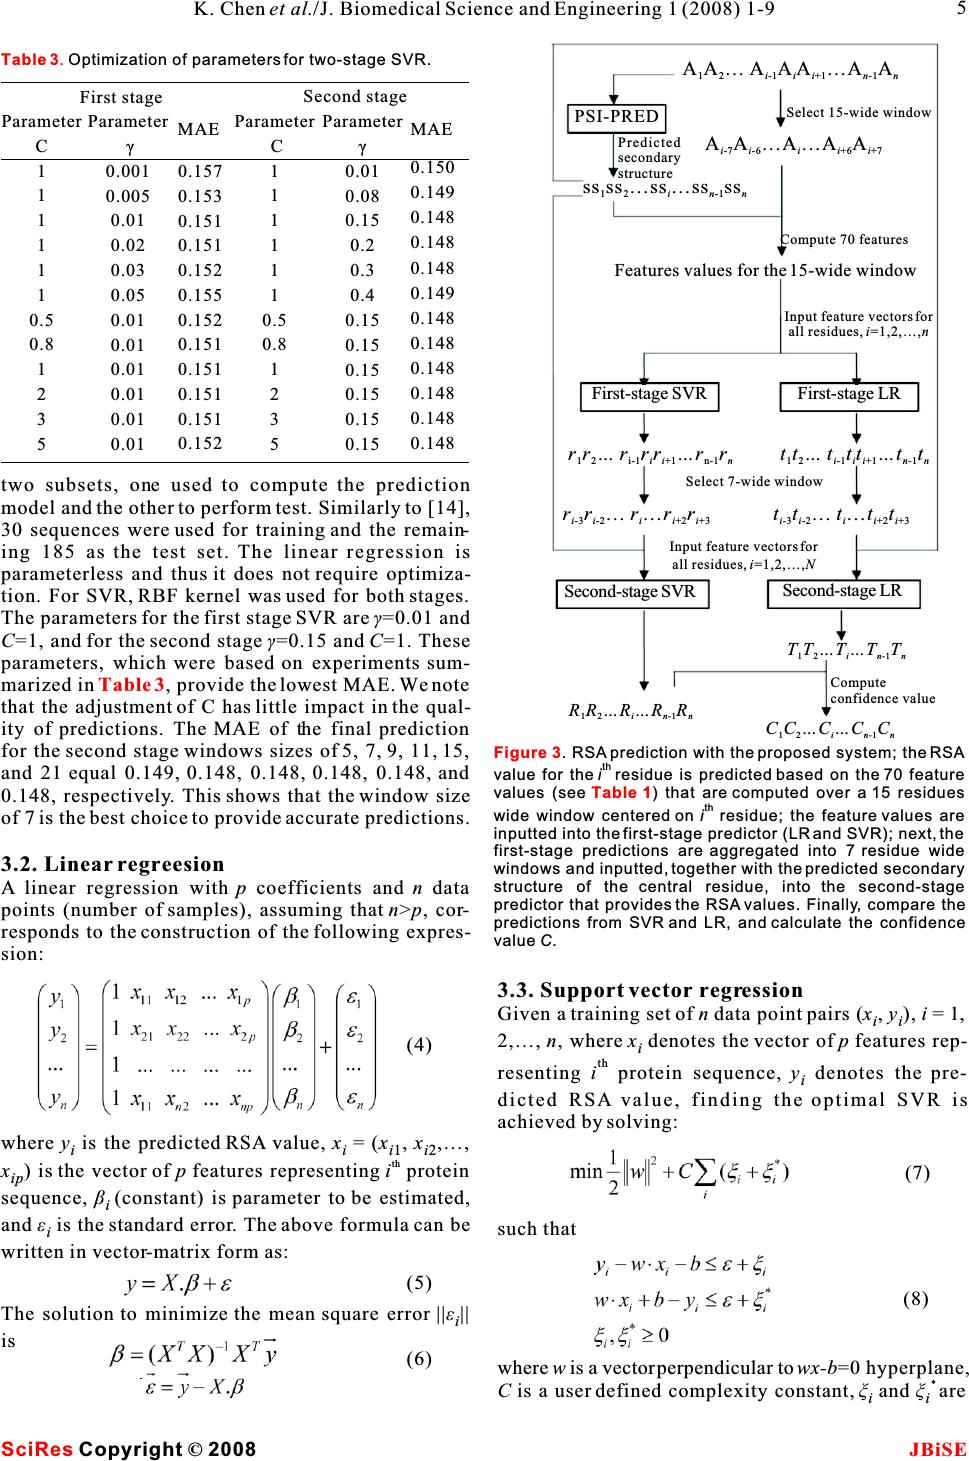 two subsets, one used to compute the prediction model and the other to perform test. Similarly to [14], 30 sequences were used for training and the remain- ing 185 as the test set. The linear regression is parameterless and thus it does not require optimiza- tion. For SVR, RBF kernel was used for both stages. The parameters for the first stage SVR areã=0.01 and C=1, and for the second stageã=0.15 andC=1. These parameters, which were based on experiments sum- marized in , provide the lowest MAE. We note that the adjustment of C has little impact in the qual- ity of predictions. The MAE of the final prediction for the second stage windows sizes of 5, 7, 9, 11, 15, and 21 equal 0.149, 0.148, 0.148, 0.148, 0.148, and 0.148, respectively. This shows that the window size of 7 is the best choice to provide accurate predictions. 3.2. Linear regreesion A linear regression withp coefficients andn data points (number of samples), assuming thatn>p, cor- responds to the construction of the following expres- sion: 3.3. Support vector regression Given a training set of n data point pairs (x,y), i = 1, ii 2,…,n, wherex denotes the vector ofp features rep- i th resenting i protein sequence, y denotes the pre- i dicted RSA value, finding the optimal SVR is achieved by solving: where y is the predicted RSA value, x = (x,x,…, iii1i2 th x) is the vector of p features representingi protein ip sequence, â(constant) is parameter to be estimated, i and å is the standard error. The above formula can besuch that i written in vector-matrix form as: The solution to minimize the mean square error ||å|| i is where w is a vector perpendicular to wx-b=0 hyperplane, * C is a user defined complexity constant,î and îare ii Table 3 First stageSecond stage MAE 0.150 0.149 0.148 0.148 0.148 0.149 0.148 0.148 0.148 0.148 0.148 0.148 Parameter C 1 1 1 1 1 1 0.5 0.8 1 2 3 5 Parameter C 1 1 1 1 1 1 0.5 0.8 1 2 3 5 MAE 0.157 0.153 0.151 0.151 0.152 0.155 0.152 0.151 0.151 0.151 0.151 0.152 Parameter ã 0.001 0.005 0.01 0.02 0.03 0.05 0.01 0.01 0.01 0.01 0.01 0.01 Parameter ã 0.01 0.08 0.15 0.2 0.3 0.4 0.15 0.15 0.15 0.15 0.15 0.15 Table 3.Optimization of parameters for two-stage SVR. Figure 3 Table 1 . RSA prediction with the proposed system; the RSA th value for theiresidue is predicted based on the 70 feature values (see ) that are computed over a 15 residues th wide window centered on i residue; the feature values are inputted into the first-stage predictor (LR and SVR); next, the first-stage predictions are aggregated into 7 residue wide windows and inputted, together with the predicted secondary structure of the central residue, into the second-stage predictor that provides the RSA values. Finally, compare the predictions from SVR and LR, and calculate the confidence value C. (5) (6) (7) (8) 5 K. Chen et al./J. Biomedical Science and Engineering 1 (2008) 1-9 SciRes JBiSE Copyright©2008 (4) AA…AAA …A A 12 i-1 ii+1 n-1 n PSI-PRED Select 15-wide window AA…A…A A i-7 i-6 ii+6 i+7 Predicted secondary structure ss ss …ss…ssss 12 in-1 n Compute 70 features Features values for the 15-wide window Input feature vectors for all residues, i=1,2,…,n First-stage SVRFirst-stage LR rr…rrr …r r 12 i-1ii+1n-1ntt…ttt …t t 12 i-1ii+1 n-1n Select 7-wide window rr…r…rr i-3 i-2 ii+2 i+3 tt…t…tt i-3i-2 ii+2 i+3 Input feature vectors for all residues, i=1,2,…,N Second-stage SVRSecond-stage LR TT…T…T T 12 in-1 n Compute confidence value RR…R …RR 12 in-1n CC…C …CC 12 in-1 n 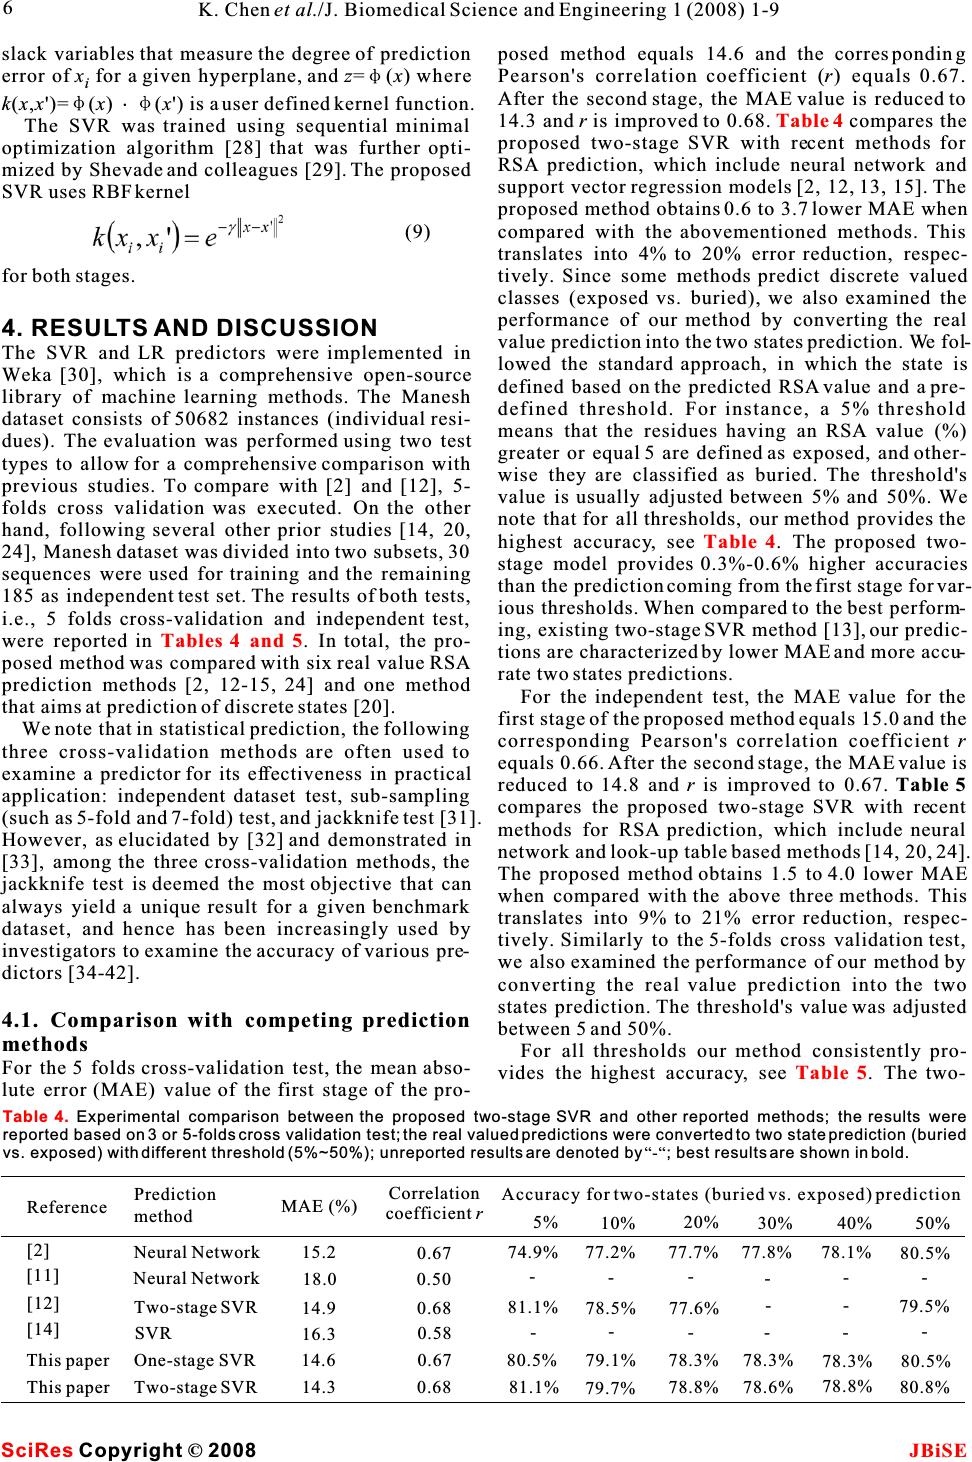 slack variables that measure the degree of predictionposedmethodequals14.6andthecorresponding error ofx for a given hyperplane, and z=(x)wherePearson's correlation coefficient (r) equals 0.67. iAfter the second stage, the MAE value is reduced to k(x,x')=(x)(x') is a user defined kernel function.14.3 andr is improved to 0.68. compares the The SVR was trained using sequential minimal proposed two-stage SVR with recent methods for optimization algorithm [28] that was further opti-RSA prediction, which include neural network and mized by Shevade and colleagues [29]. The proposedsupport vector regression models [2, 12, 13, 15]. The SVR uses RBF kernel proposed method obtains 0.6 to 3.7 lower MAE when compared with the abovementioned methods. This translates into 4% to 20% error reduction, respec- for both stages.tively. Since some methods predict discrete valued classes (exposed vs. buried), we also examined the performance of our method by converting the real 4. RESULTSAND DISCUSSIONvalue prediction into the two states prediction. We fol- The SVR and LR predictors were implemented in lowed the standard approach, in which the state is Weka [30], which is a comprehensive open-sourcedefined based on the predicted RSA value and a pre- library of machine learning methods. The Manesh defined threshold. For instance, a 5% threshold dataset consists of 50682 instances (individual resi-means that the residues having an RSA value (%) dues). The evaluation was performed using two testgreater or equal 5 are defined as exposed, and other- types to allow for a comprehensive comparison with wise they are classified as buried. The threshold's previous studies. To compare with [2] and [12], 5-value is usually adjusted between 5% and 50%. We folds cross validation was executed. On the other note that for all thresholds, our method provides the hand, following several other prior studies [14, 20,highest accuracy, see. The proposed two- 24], Manesh dataset was divided into two subsets, 30stage model provides 0.3%-0.6% higher accuracies sequences were used for training and the remainingthan the prediction coming from the first stage for var- 185 as independent test set. The results of both tests, ious thresholds. When compared to the best perform- i.e., 5 folds cross-validation and independent test, ing, existing two-stage SVR method [13], our predic- were reported in . In total, the pro-tions are characterized by lower MAE and more accu- posed method was compared with six real value RSArate two states predictions. prediction methods [2, 12-15, 24] and one methodFor the independent test, the MAE value for the that aims at prediction of discrete states [20].first stage of the proposed method equals 15.0 and the We note that in statistical prediction, the following corresponding Pearson's correlation coefficientr three cross-validation methods are often used to equals 0.66. After the second stage, the MAE value is examine a predictor for its effectiveness in practicalreduced to 14.8 andr is improved to 0.67.Table 5 application: independent dataset test, sub-sampling compares the proposed two-stage SVR with recent (such as 5-fold and 7-fold) test, and jackknife test [31].methods for RSA prediction, which include neural However, as elucidated by [32] and demonstrated innetwork and look-up table based methods [14, 20, 24]. [33], among the three cross-validation methods, the The proposed method obtains 1.5 to 4.0 lower MAE jackknife test is deemed the most objective that canwhen compared with the above three methods. This always yield a unique result for a given benchmark translates into 9% to 21% error reduction, respec- dataset, and hence has been increasingly used bytively. Similarly to the 5-folds cross validation test, investigators to examine the accuracy of various pre-we also examined the performance of our method by dictors [34-42].converting the real value prediction into the two states prediction. The threshold's value was adjusted 4.1. Comparison with competing prediction between 5 and 50%. methods For all thresholds our method consistently pro- For the 5 folds cross-validation test, the mean abso-vides the highest accuracy, see. The two- lute error (MAE) value of the first stage of the pro- Table 4 Table 4 Tables 4 and 5 Table 5 Table 4. Experimental comparison between the proposed two-stage SVR and other reported methods; the results were reported based on 3 or 5-folds cross validation test; the real valued predictions were converted to two state prediction (buried vs. exposed) with different threshold (5%~50%); unreported results are denoted by “-“; best results are shown in bold. Reference [2] [11] [12] [14] This paper This paper Prediction method Neural Network Neural Network Two-stage SVR SVR One-stage SVR Two-stage SVR MAE (%) 15.2 18.0 14.9 16.3 14.6 14.3 Correlation coefficient r 0.67 0.50 0.68 0.58 0.67 0.68 5% 74.9% - 81.1% - 80.5% 81.1% 20% 77.7% - 77.6% - 78.3% 78.8% 10% 77.2% - 78.5% - 79.1% 79.7% 30% 77.8% - - - 78.3% 78.6% 40% 78.1% - - - 78.3% 78.8% 50% 80.5% - 79.5% - 80.5% 80.8% Accuracy for two-states (buried vs. exposed) prediction 6K. Chen et al./J. Biomedical Science and Engineering 1 (2008) 1-9 SciRes JBiSE Copyright©2008 (9) 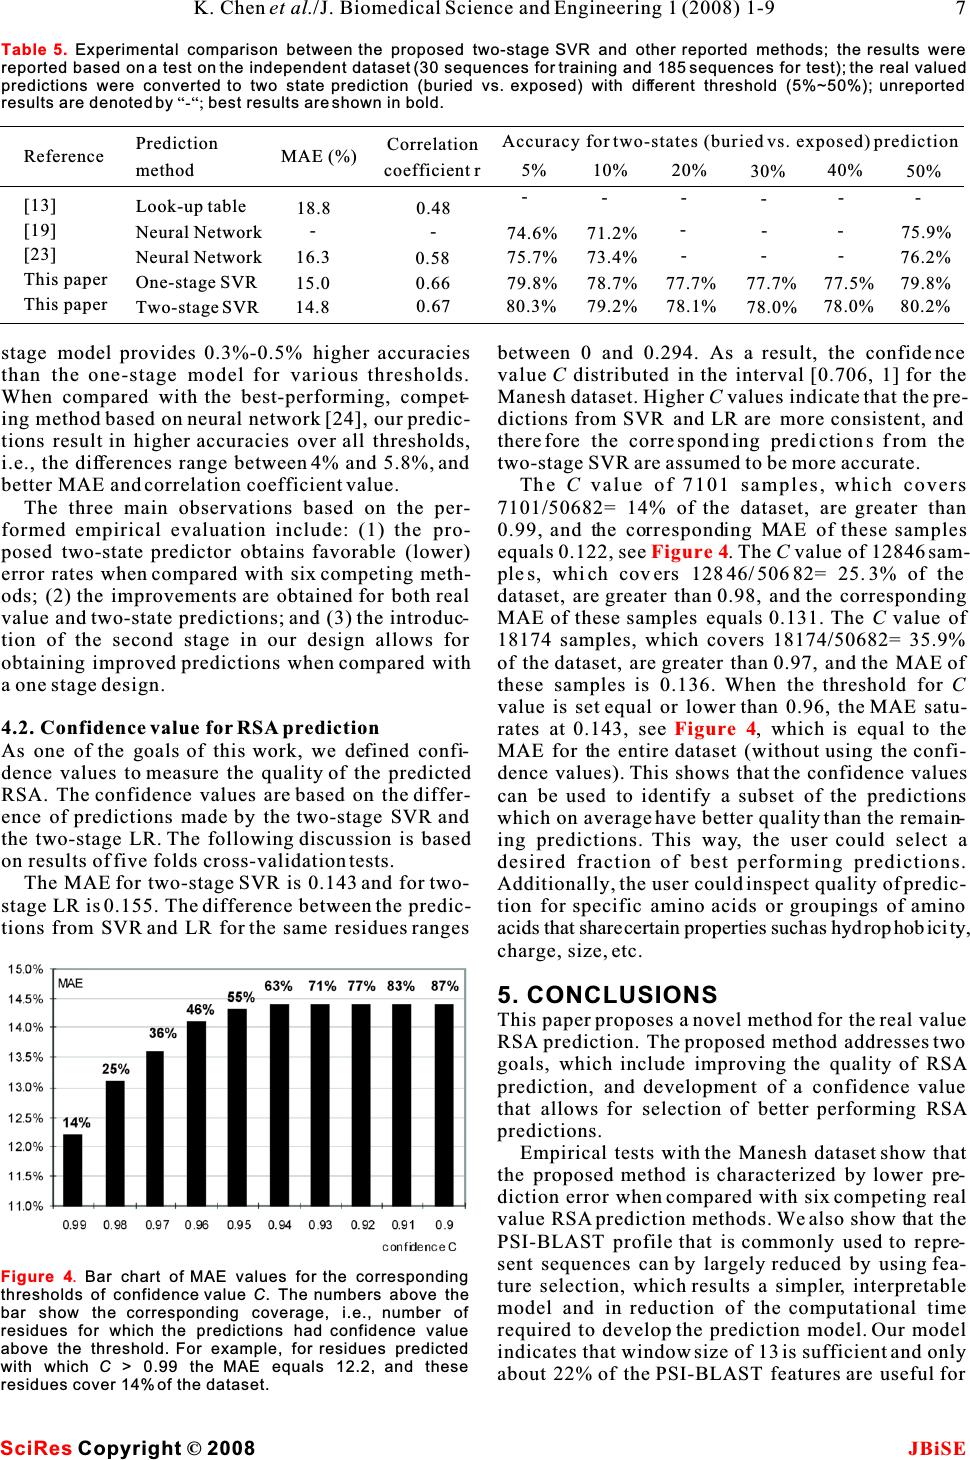 stage model provides 0.3%-0.5% higher accuracies between 0 and 0.294. As a result, the confidence than the one-stage model for various thresholds. valueC distributed in the interval [0.706, 1] for the When compared with the best-performing, compet-Maneshdataset.HigherC values indicate that the pre- ing method based on neural network [24], our predic-dictions from SVR and LR are more consistent, and tions result in higher accuracies over all thresholds,thereforethecorrespondingpredictions fromthe i.e., the differences range between 4% and 5.8%, and two-stageSVRareassumedtobemoreaccurate. better MAE and correlation coefficient value.TheC value of 7101 samples, which covers The three main observations based on the per-7101/50682= 14% of the dataset, are greater than formed empirical evaluation include: (1) the pro-0.99, and the corresponding MAE of these samples posed two-state predictor obtains favorable (lower)equals0.122,see.TheCvalue of 12846 sam- error rates when compared with six competing meth-ples,whichcovers12846/50682=25.3%ofthe ods; (2) the improvements are obtained for both real dataset, are greater than 0.98, and the corresponding value and two-state predictions; and (3) the introduc-MAE of these samples equals 0.131. The C value of tion of the second stage in our design allows for 18174samples,whichcovers18174/50682=35.9% obtaining improved predictions when compared withof the dataset, are greater than 0.97, and the MAE of aonestagedesign.these samples is 0.136. When the threshold forC value is set equal or lower than 0.96, the MAE satu- 4.2. Confidence value for RSA predictionrates at 0.143, see, which is equal to the As one of the goals of this work, we defined confi-MAE for the entire dataset (without using the confi- dence values to measure the quality of the predicteddence values). This shows that the confidence values RSA. The confidence values are based on the differ-can be used to identify a subset of the predictions ence of predictions made by the two-stage SVR and which on average have better quality than the remain- the two-stage LR. The following discussion is baseding predictions. This way, the user could select a on results of five folds cross-validation tests. desired fraction of best performing predictions. The MAE for two-stage SVR is 0.143 and for two-Additionally, the user could inspect quality of predic- stage LR is 0.155. The difference between the predic-tion for specific amino acids or groupings of amino tions from SVR and LR for the same residues ranges acids that share certain properties such as hydrophobicity, charge, size, etc. 5. CONCLUSIONS This paper proposes a novel method for the real value RSA prediction. The proposed method addresses two goals, which include improving the quality of RSA prediction, and development of a confidence value that allows for selection of better performing RSA predictions. Empirical tests with the Manesh dataset show that the proposed method is characterized by lower pre- diction error when compared with six competing real value RSA prediction methods. We also show that the PSI-BLAST profile that is commonly used to repre- sent sequences can by largely reduced by using fea- ture selection, which results a simpler, interpretable model and in reduction of the computational time required to develop the prediction model. Our model indicates that window size of 13 is sufficient and only about 22% of the PSI-BLAST features are useful for Figure 4 Figure 4 Table 5. Experimental comparison between the proposed two-stage SVR and other reported methods; the results were reported based on a test on the independent dataset (30 sequences for training and 185 sequences for test); the real valued predictions were converted to two state prediction (buried vs. exposed) with different threshold (5%~50%); unreported results are denoted by “-“; best results are shown in bold. Reference [13] [19] [23] This paper This paper Prediction method Look-up table Neural Network Neural Network One-stage SVR Two-stage SVR MAE (%) 18.8 - 16.3 15.0 14.8 Correlation coefficient r 0.48 - 0.58 0.66 0.67 Accuracy for two-states (buried vs. exposed) prediction 5% - 74.6% 75.7% 79.8% 80.3% 10% - 71.2% 73.4% 78.7% 79.2% 20% - - - 77.7% 78.1% 30% - - - 77.7% 78.0% 40% - - - 77.5% 78.0% 50% - 75.9% 76.2% 79.8% 80.2% Figure 4. Bar chart of MAE values for the corresponding thresholds of confidence value C. The numbers above the bar show the corresponding coverage, i.e., number of residues for which the predictions had confidence value above the threshold. For example, for residues predicted with which C > 0.99 the MAE equals 12.2, and these residues cover 14% of the dataset. 7 K. Chen et al./J. Biomedical Science and Engineering 1 (2008) 1-9 SciRes JBiSE Copyright©2008 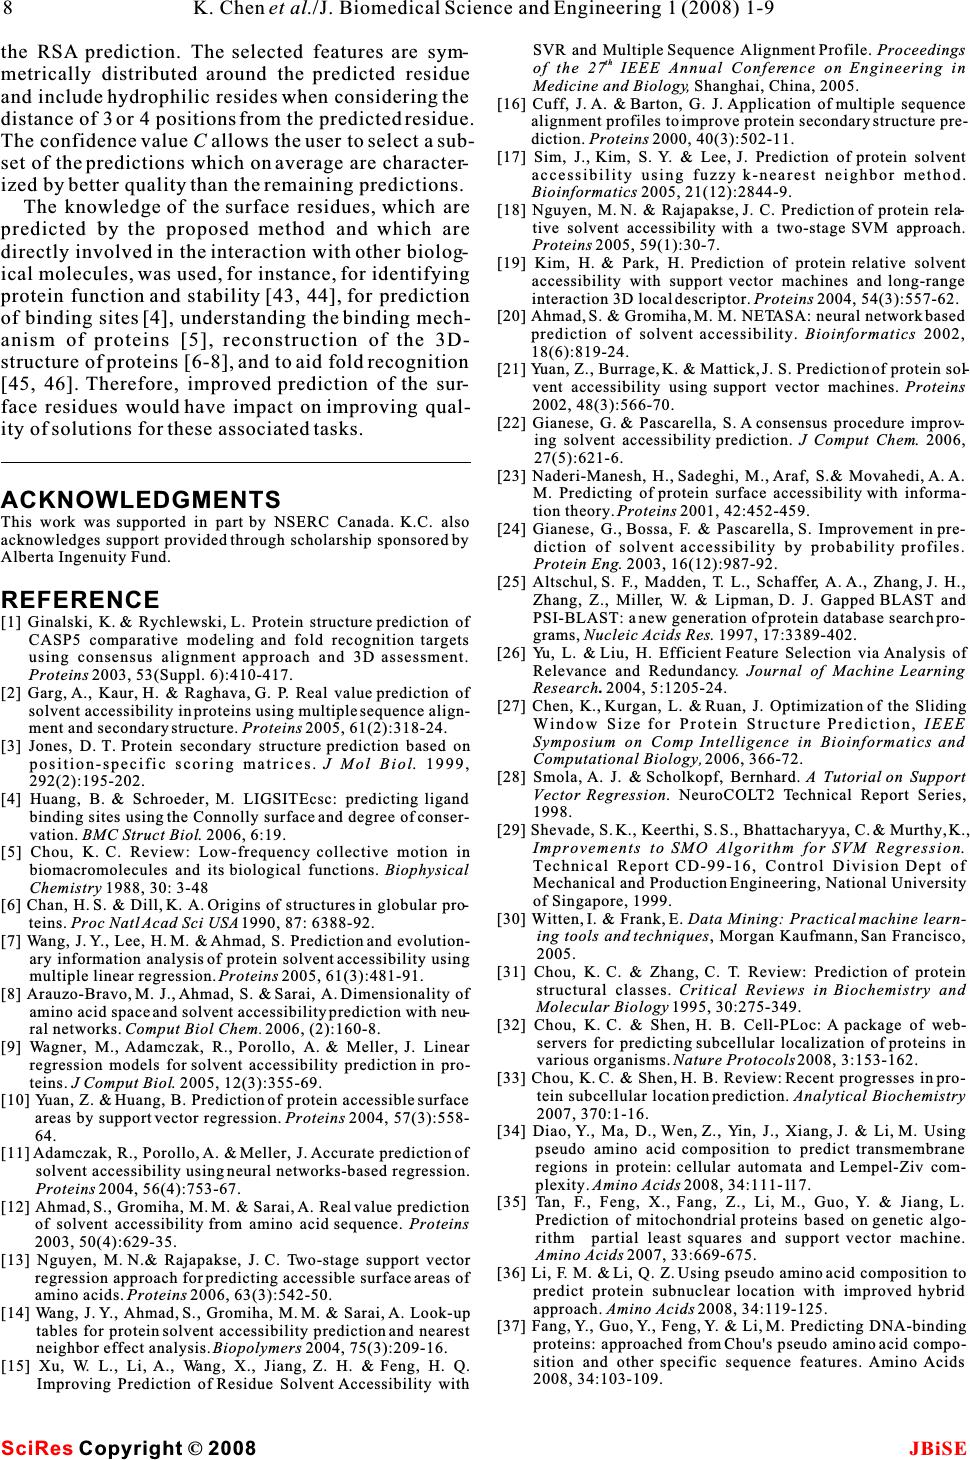 SVR and Multiple Sequence Alignment Profile. Proceedings the RSA prediction. The selected features are sym-th of the 27 IEEE Annual Conference onEngineering in metrically distributed around the predicted residueMedicine and Biology, Shanghai, China, 2005. and include hydrophilic resides when considering the [16] Cuff, J. A. & Barton, G. J. Application of multiple sequence distance of 3 or 4 positions from the predicted residue. alignment profiles to improve protein secondary structure pre- diction. Proteins 2000, 40(3):502-11. The confidence value C allows the user to select a sub-[17] Sim, J., Kim, S. Y. & Lee, J. Prediction of protein solvent set of the predictions which on average are character-accessibility using fuzzy k-nearest neighbor method. ized by better quality than the remaining predictions.Bioinformatics 2005, 21(12):2844-9. The knowledge of the surface residues, which are[18] Nguyen, M. N. & Rajapakse, J. C. Prediction of protein rela- tive solvent accessibility with a two-stage SVM approach. predicted by the proposed method and which areProteins 2005, 59(1):30-7. directly involved in the interaction with other biolog-[19] Kim, H. & Park, H. Prediction of protein relative solvent ical molecules, was used, for instance, for identifyingaccessibility with support vector machines and long-range protein function and stability [43, 44], for predictioninteraction 3D local descriptor. Proteins 2004, 54(3):557-62. [20] Ahmad, S. & Gromiha, M. M. NETASA: neural network based of binding sites [4], understanding the binding mech-prediction of solvent accessibility. Bioinformatics 2002, anism of proteins [5], reconstruction of the 3D-18(6):819-24. structure of proteins [6-8], and to aid fold recognition [21] Yuan, Z., Burrage, K. & Mattick, J. S. Prediction of protein sol- [45, 46]. Therefore, improved prediction of the sur-vent accessibility using support vector machines.Proteins 2002, 48(3):566-70. face residues would have impact on improving qual-[22] Gianese, G. & Pascarella, S. A consensus procedure improv- ity of solutions for these associated tasks.ing solvent accessibility prediction. J Comput Chem. 2006, 27(5):621-6. [23] Naderi-Manesh, H., Sadeghi, M., Araf, S.& Movahedi, A. A. M. Predicting of protein surface accessibility with informa- ACKNOWLEDGMENTS tion theory.Proteins 2001, 42:452-459. This work was supported in part by NSERC Canada. K.C. also [24] Gianese, G., Bossa, F. & Pascarella, S. Improvement in pre- acknowledges support provided through scholarship sponsored by diction of solvent accessibility by probability profiles. Alberta Ingenuity Fund.Protein Eng. 2003, 16(12):987-92. [25] Altschul, S. F., Madden, T. L., Schaffer, A. A., Zhang, J. H., Zhang, Z., Miller, W. & Lipman, D. J. Gapped BLAST and REFERENCE PSI-BLAST: a new generation of protein database search pro- [1] Ginalski, K. & Rychlewski, L. Protein structure prediction of grams,Nucleic Acids Res. 1997, 17:3389-402. CASP5 comparative modeling and fold recognition targets [26] Yu, L. & Liu, H. Efficient Feature Selection via Analysis of using consensus alignment approach and 3D assessment. Relevance and Redundancy.Journal of Machine Learning Proteins 2003, 53(Suppl. 6):410-417.Research.2004, 5:1205-24. [2] Garg, A., Kaur, H. & Raghava, G. P. Real value prediction of [27] Chen, K., Kurgan, L. & Ruan, J. Optimization of the Sliding solvent accessibility in proteins using multiple sequence align-Window Size for Protein Structure Prediction, IEEE ment and secondary structure. Proteins 2005, 61(2):318-24.Symposium on Comp Intelligence in Bioinformatics and [3] Jones, D. T. Protein secondary structure prediction based onComputational Biology, 2006, 366-72. position-specific scoring matrices.J Mol Biol. 1999, [28] Smola, A. J. & Scholkopf, Bernhard. A Tutorial on Support 292(2):195-202. Vector Regression. NeuroCOLT2 Technical Report Series, [4] Huang, B. & Schroeder, M. LIGSITEcsc: predicting ligand 1998. binding sites using the Connolly surface and degree of conser-[29] Shevade, S. K., Keerthi, S. S., Bhattacharyya, C. & Murthy, K., vation. BMC Struct Biol. 2006, 6:19.Improvements to SMO Algorithm for SVM Regression. [5] Chou, K. C. Review: Low-frequency collective motion inTechnical Report CD-99-16, Control Division Dept of biomacromolecules and its biological functions. Biophysical Mechanical and Production Engineering, National University Chemistry 1988, 30: 3-48of Singapore, 1999. [6] Chan, H. S. & Dill, K. A. Origins of structures in globular pro-[30] Witten, I. & Frank, E. Data Mining: Practical machine learn- teins.Proc Natl Acad Sci USA 1990, 87: 6388-92.ing tools and techniques, Morgan Kaufmann, San Francisco, [7] Wang, J. Y., Lee, H. M. & Ahmad, S. Prediction and evolution-2005. ary information analysis of protein solvent accessibility using [31] Chou, K. C. & Zhang, C. T. Review: Prediction of protein multiple linear regression.Proteins 2005, 61(3):481-91.structural classes. Critical Reviews in Biochemistry and [8] Arauzo-Bravo, M. J., Ahmad, S. & Sarai, A. Dimensionality of Molecular Biology 1995, 30:275-349. amino acid space and solvent accessibility prediction with neu-[32] Chou, K. C. & Shen, H. B. Cell-PLoc: A package of web- ral networks. Comput Biol Chem. 2006, (2):160-8.servers for predicting subcellular localization of proteins in [9] Wagner, M., Adamczak, R., Porollo, A. & Meller, J. Linear various organisms. Nature Protocols 2008, 3:153-162. regression models for solvent accessibility prediction in pro-[33] Chou, K. C. & Shen, H. B. Review: Recent progresses in pro- teins. J Comput Biol. 2005, 12(3):355-69.tein subcellular location prediction. Analytical Biochemistry [10] Yuan, Z. & Huang, B. Prediction of protein accessible surface 2007, 370:1-16. areas by support vector regression. Proteins 2004, 57(3):558-[34] Diao, Y., Ma, D., Wen, Z., Yin, J., Xiang, J. & Li, M. Using 64. pseudo amino acid composition to predict transmembrane [11]Adamczak, R., Porollo, A. & Meller, J. Accurate prediction of regions in protein: cellular automata and Lempel-Ziv com- solvent accessibility using neural networks-based regression.plexity. Amino Acids 2008, 34:111-117. Proteins 2004, 56(4):753-67.[35] Tan, F., Feng, X., Fang, Z., Li, M., Guo, Y. & Jiang, L. [12] Ahmad, S., Gromiha, M. M. & Sarai, A. Real value prediction Prediction of mitochondrial proteins based on genetic algo- of solvent accessibility from amino acid sequence. Proteins rithm partial least squares and support vector machine. 2003, 50(4):629-35.Amino Acids 2007, 33:669-675. [13] Nguyen, M. N.& Rajapakse, J. C. Two-stage support vector[36] Li, F. M. & Li, Q. Z. Using pseudo amino acid composition to regression approach for predicting accessible surface areas of predict protein subnuclear location with improved hybrid amino acids. Proteins 2006, 63(3):542-50.approach. Amino Acids 2008, 34:119-125. [14] Wang, J. Y., Ahmad, S., Gromiha, M. M. & Sarai, A. Look-up[37] Fang, Y., Guo, Y., Feng, Y. & Li, M. Predicting DNA-binding tables for protein solvent accessibility prediction and nearest proteins: approached from Chou's pseudo amino acid compo- neighbor effect analysis.Biopolymers 2004, 75(3):209-16. sition and other specific sequence features. Amino Acids [15] Xu, W. L., Li, A., Wang, X., Jiang, Z. H. & Feng, H. Q.2008, 34:103-109. Improving Prediction of Residue Solvent Accessibility with 8K. Chen et al./J. Biomedical Science and Engineering 1 (2008) 1-9 SciRes JBiSE Copyright©2008  [38] Zhang, S. W., Zhang, Y. L., Yang, H. F., Zhao, C. H. & Pan, Q. [42]Nanni,L.&Lumini, A. Geneticprogrammingforcreating Using the concept of Chou's pseudo amino acid compositionChou'spseudoaminoacidbasedfeaturesforsubmitochondria to predict protein subcellular localization: an approach by localization.Amino Acids 2008, DOI 10.1007/s00726-00007- incorporating evolutionary information and von Neumann00016-00723. entropies. Amino Acids2007,DOI10.1007/s00726-00007-[43] Eisenberg, D. & McLachlan, A. D. Solvation energy in protein 00010-00729.folding and binding.Nature 1986, 319:199-203. [39] Shi, J. Y., Zhang, S. W., Pan, Q. & Zhou, G. P. Using Pseudo[44] Gromiha, M. M., Motohisa, O., Hidetoshi, K., Hatsuho, U. & AminoAcidCompositiontoPredictProteinSubcellularAkinori, S. Role of structural and sequence information in the Location: Approachedwith Amino AcidCompositionprediction of protein stability changes, comparison between Distribution.Amino Acids 2007, DOI 10.1007/s00726-buried and partially buried mutations. Protein Engineering 00007-00623-z.1999, 12(7):549-555. [40] Zhou, X. B., Chen, C., Li, Z. C. & Zou, X. Y. Improved predic-[45] Cheng, J. & Baldi, P. A machine learning information retrieval tion of subcellular location for apoptosis proteins by the dual-approachtoproteinfoldrecognition.Bioinformatics 2006, layer support vector machine. Amino Acids 2007, DOI 22(12):1456-63. 10.1007/s00726-00007-00608-y.[46] Liu, S., Zhang, C., Liang, S. & Zhou, Y. Fold recognition by [41] Nanni, L. & Lumini,A. Combing Ontologies and Dipeptideconcurrent use of solvent accessibility and residue depth. composition for predicting DNA-binding proteins. Amino Proteins 2007, 68:636-645. Acids2008, DOI 10.1007/s00726-00007-00018-00721. 9 K. Chen et al./J. Biomedical Science and Engineering 1 (2008) 1-9 SciRes JBiSE Copyright©2008 |