Technology and Investment
Vol.3 No.3(2012), Article ID:22079,6 pages DOI:10.4236/ti.2012.33023
Empirical Research on the Relationship between Scientific Innovation and Economic Growth in Beijing
University of Science and Technology of China, Hefei, China
Email: songwei@ustc.edu.cn
Received June 19, 2012; revised July 19, 2012; accepted July 26, 2012
Keywords: Scientific Innovation; Economic Growth; VAR Model; Beijing
ABSTRACT
This paper will build up a model about the dynamic relationship between scientific innovation and economic growth in Beijing, with VAR model (Vector Autoregressive Model), and choose the quantity of patent applications, sum of business transactions in the market of technologies and the foreign direct investment as its indicators of science and technology output, GDP as its indicator of economic growth, which finally uses variance decomposition analysis. The research shows that there is a long-term equilibrium relationship between scientific innovation and economic growth, and both have interactivity which means that scientific innovation promotes economic growth and economic growth boosts the scientific innovation.
1. Introduction
Since China’s reform and opening-up, the wealth of society has been increasing rapidly and the industrial structure has been more rational. The comprehensive national strength comes to the forefront of the world. One of the reasons why China can make such great achievements is the scientific progress and innovation. Beijing, as China’s political, cultural and international exchange center, reflects its importance. The economic development theory also shows that scientific innovation is the source of economic growth. Today, the fierce international competition sets a higher request to the Beijing’s economic development. Beijing need more fully integrate and use the scientific innovation resources. In the process of building up the well-off society and innovative country, the demand for scientific innovation is increasing and then Beijing’s scientific development connotation will be further enriched. In this context, to study the inner link of scientific innovation and economic growth and its dynamic equilibrium relationship has a significant reference for Beijing to make a scientific development plan.
The research on the relationship between science & technology and economic growth has a long history at home and abroad. The New Growth Theory represented by Romer, Robert Lucas, Gary Beeker and Xiaokai Yang [1-3], believe that the advance in science and technology is the most important motive to enhance the economic growth and social development. In the study of development economics, people recognized the great role that technology spillover plays to promote the economic development in the developing countries. Caves studied the effects of FDI technology spillover in Canada and Australia, which found out that the technology spillover brought by the foreign investment by both countries has a long-term equilibrium relationship with economic development [4]. In 1993, when Bloom storm studied on the effect of foreign investment in to the manufacturing capability of enterprises in Mexico, he found that the manufacturing capability of these enterprises was compatible with that of foreign companies [5]. Along with the development of times, the influence of scientific progress on economic growth is becoming more and more obvious, and the study on the relationship of these two is becoming deeper. Based on the theory of physics field, Xianwei Yang and Li Yan built up Tran slog Production Function Model to reflect scientific progress, so as to study the interactive relationship between scientific investment and economic growth [6]. Based on DEA (Data envelopment analysis) theory, Zhi Xu and Ping Shi built up a evaluating indicator system on China’s scientific input and output, and the result of study shows that the output of China’s investment in scientific lowly contributes to the economic growth, and there is no distinct correlation between the efficiency of scientific investment and the rate economic growth [7]. Zhijian Zhao built up the econometrics model by studying the dependence relations of scientific investment and economic growth in China, and then figured out the pulling effect of scientific investment to economic growth [8].
Based on the research above, this paper constructs interpretation model of scientific innovation and economic growth as Figure 1.
In this model, it show that foreign direct investment, quantity of patent application and sum of business transaction in the market of technologies as the indicators of scientific innovation will well represent its scientific innovation capability. Meanwhile, scientific innovation and economic growth have interactivity, which means scientific innovation promotes economic growth, and economic growth boosts scientific innovation. With the continuous improvement of contribution rate of scientific innovation to economic growth, the government will place great importance on the scientific investment to strength the scientific innovation, and then the economic can grow at a faster pace, which will have a virtuous circle between scientific innovation and economic growth.
Based on this model, this paper represents empirical research on the above indicators of scientific innovation and economic growth by using the relevant data from 1991 to 2010 in Beijing with VAR model, and then tests the interactive relationship among the variables. Meanwhile, the influence of variables will be also analyzed by using a few methods in VAR such as impulse response function and variance decomposition.
2. Scientific Innovation and Economic Growth in Beijing
During 2006-2010, the GDP in Beijing increased by an average annual growth of 14.4%, from 811.78 billion RMB in 2006 to 1377.79 billion RMB in 2010 (Figure 2), which indicates its great economic growth. In the last three years, the growth of GDP flattens out gradually after a steep fall.
In 2010, there are 260,000 research and development personnel with an increase of 2.8% over the previous year. Meanwhile, the quantity of patent applications and authorizations which has issued in Beijing reached up to 57,000 and 34,000 respectively, with an increase of 14.1% and 46.2%, in which there are 33,000 invention patent applications and 11,000 invention patent authorizations. And in the year of 2010, there are 50,847 technical contracts which have been signed, increasing by

Figure 1. Interpretation model of scientific innovation and economic growth.

Figure 2. Statistical graph of GDP and annual growth in Beijing.
1.8%. The sum of business transaction in the market of technologies was 50.56 billion RMB, increasing by 11.6%. All of information shows the high level of innovation, management, protection and application of Beijing in the era of patent.
3. VAR Model Constructing and Indicators’ Data Processing
VAR model was put forward by Sims in 1980 [9], which does not need to be in the strict accordance with any economic theory. In each equation of this model, endogenous variables regress all the lagged values of them, so as to estimate their dynamic relationship. VAR model has many merits, for instance, it does not impose any restraints on the parameters, and does not include any current variables in the explanatory variables, for which VAR model is welcomed by the scholars who study the dynamic time series data.
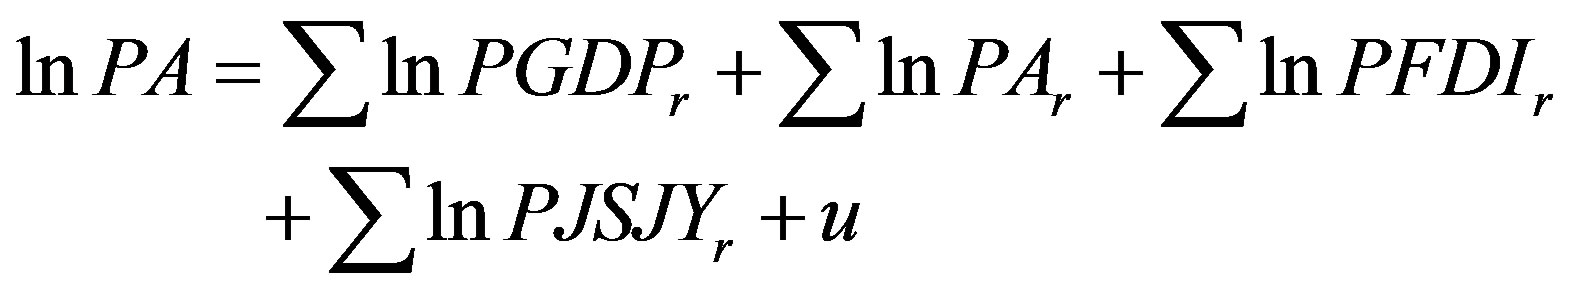
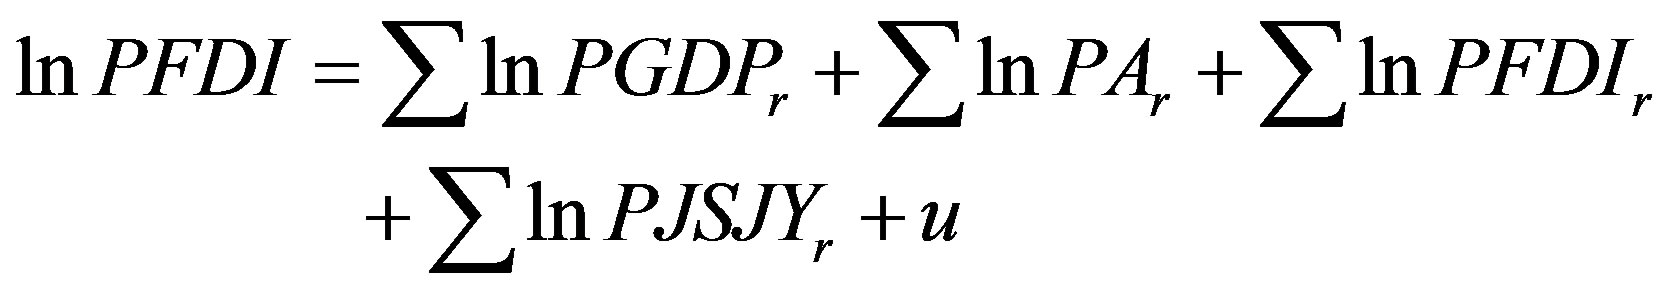
In this paper, VAR model has been established as follows:
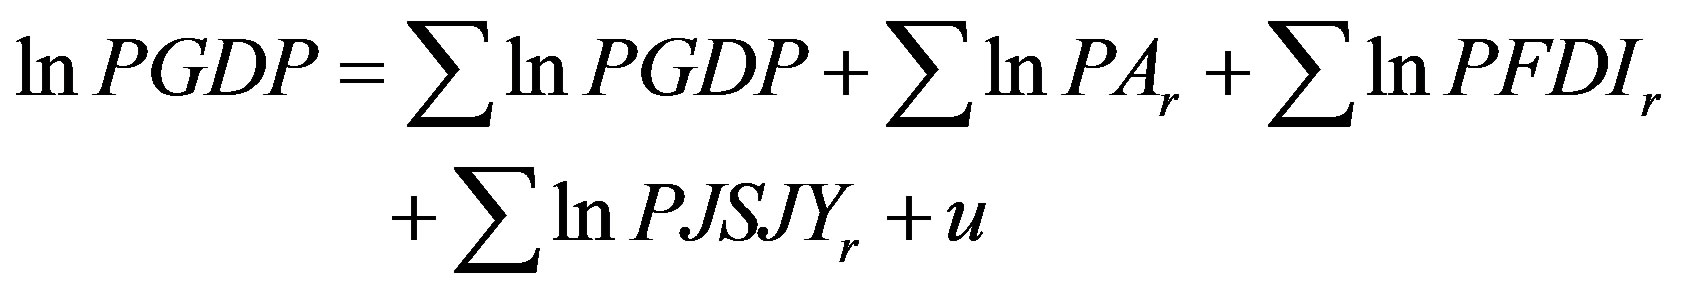 (1)
(1)
 (2)
(2)
 (3)
(3)
 (4)
(4)
lnPGDP: the economic growth index;
lnPA: the quantum index of patent applications;
lnPFDI: the foreign direct investment index;
lnPJSJY: index of the sum of business transaction in the market of technologies.
r = 1, 2, 3, ; u is the stochastic error, which is called as pulse value in VAR.
The data from 1991 to 2010 comes from the statistical yearbook in Beijing (the data from 1991 to 2010 are in Appendix 1). The value of P is the price index in the current year which is calculated based on the fixed price in 1978. Then the paper revises the price indexes in the initial data. Meanwhile, the data in the year of 1991 is selected as the standard for data normalization, and then four groups of data from 1991 to 2010 including lnPGDP, lnPA, lnPFDI and lnPJSJY can be obtained by processing the standardized data with the method of logarithm.
4. Empirical Analysis
4.1. Stationary Test
The economic growth index, the quantum index of patent applications, index of the sum of business transaction in the market of technologies, and the foreign direct investment index are all time series data, which significantly change with time. So it is necessary to test whether the variables are stationary before establishing the model. The paper carries out the stationary test for lnPGDP, lnPA, lnPFDI and lnPJSJY, as well as their first-order differential variable DlnPGDP, DlnPA, DlnPFDI and DlnPJSJY with the test method of ADF by DickeyFuller. And the result shows that the time series lnPGDP, lnPA, lnPFDI and lnPJSJY are non-stationary, but their differential variables DlnPGDP, DlnPA, DlnPFDI and DlnPJSJY are stationary series, when the level of significance is under 10%.
4.2. Co-Integration Test
The unit root test result of each series tells us that lnPGDP, lnPA, lnPFDI and lnPJSJY are all first-order integrated series, and there may be a kind of co-integration relationship among them. The paper uses Johansen Test theory to judge whether the co-integration relationship exists or not. If the co-integration relationship exists, the VAR model should be established to reflect the short-term and long-term relationship among the variables, and the lag order should be consistent with that of co-integration test. Unconstraint VAR model is built up to get the optimal lag order of co-integration relationship, and when selecting the second-order lag based on the comprehensive comparison among the statistics including FPE, SC, AIC, HQ, etc., the effect of model is the best. When Johansen co-integration test is conducted at this time, the result indicates 3 co-integrating vectors at the 0.05 level. Test of co-integration test as Table 1.
According to the calculation, the co-integration relationship among the three variables is as follows:
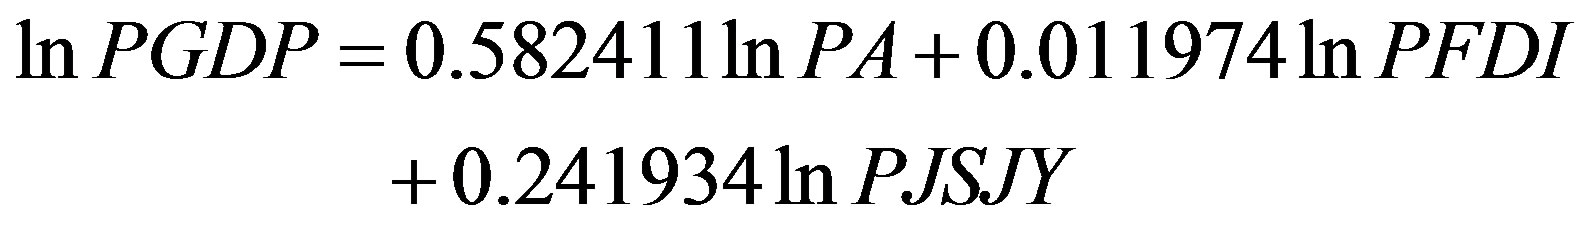
Based on the co-integration relationship, there is a long-term equilibrium relationship from 1991 to 2010 in Beijing among the economic growth index, the quantum index of patent application, the index of sum of business transaction in the market of technologies and foreign direct investment index. Moreover, the coefficient of
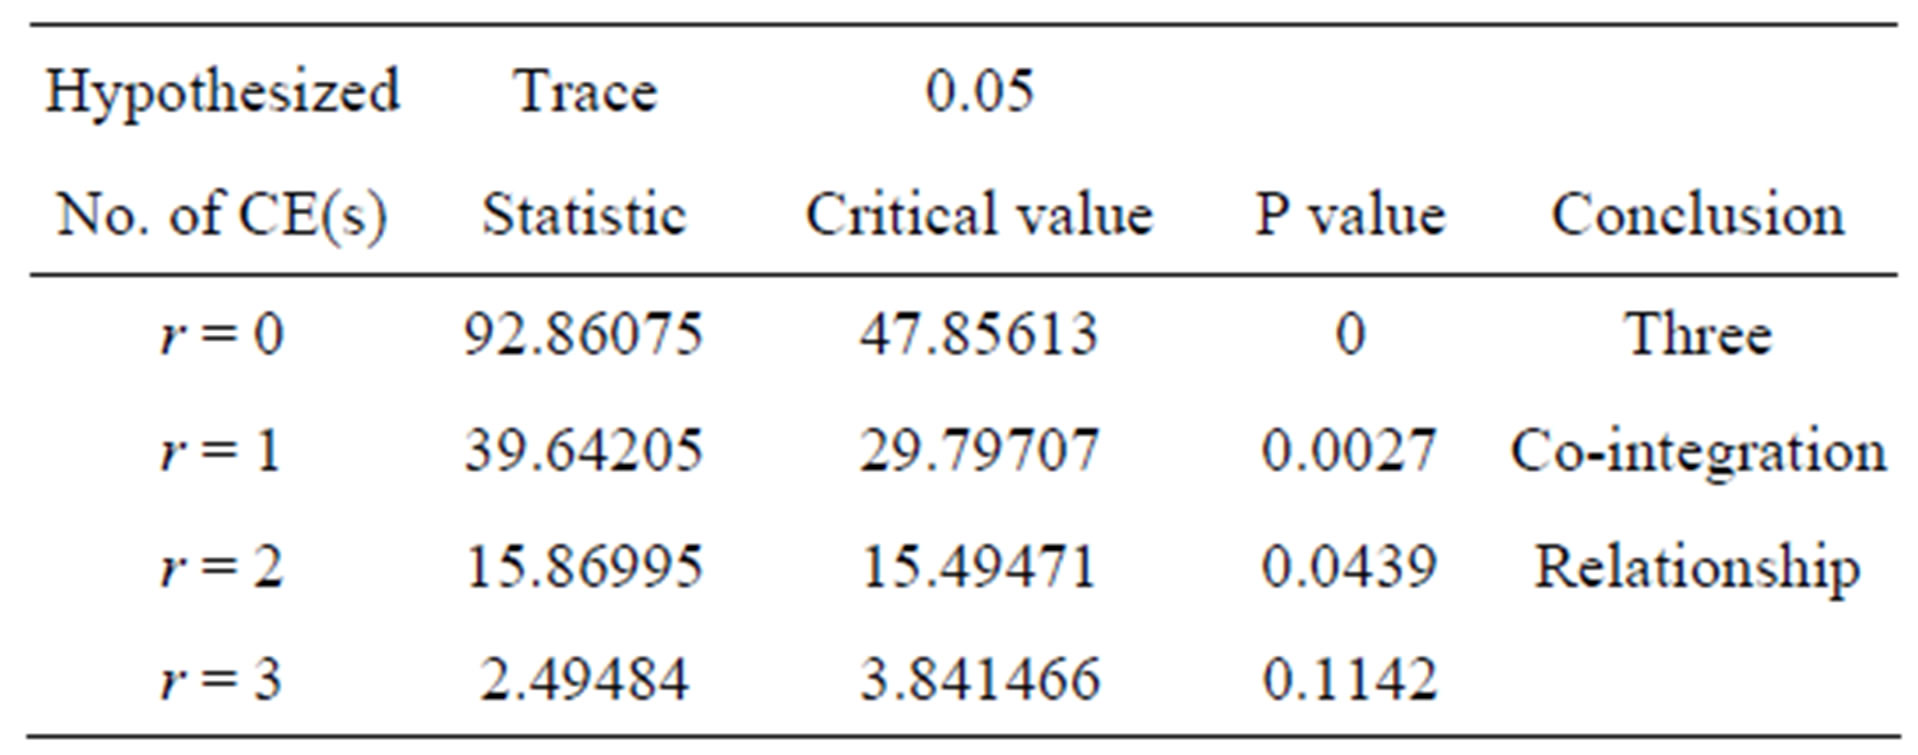
Table 1. Result of co-integration test.
the indexes are all positive values, thus in the long run, the economic growth is in positive correlation with three variables. According to the co-integration equation, the value of patent application index achieves the maximum of 0.582411, followed by the business transaction in the market of technologies and foreign direct investment. 58.2% of the patent output has influenced the economic growth index, which reflects that patent plays an important role in promoting the economic growth.
4.3. Regression Analysis
The second order VAR model is established as follows by using the Eviews software to analyze the data (Table 2).
VAR model of economic growth index as follows:
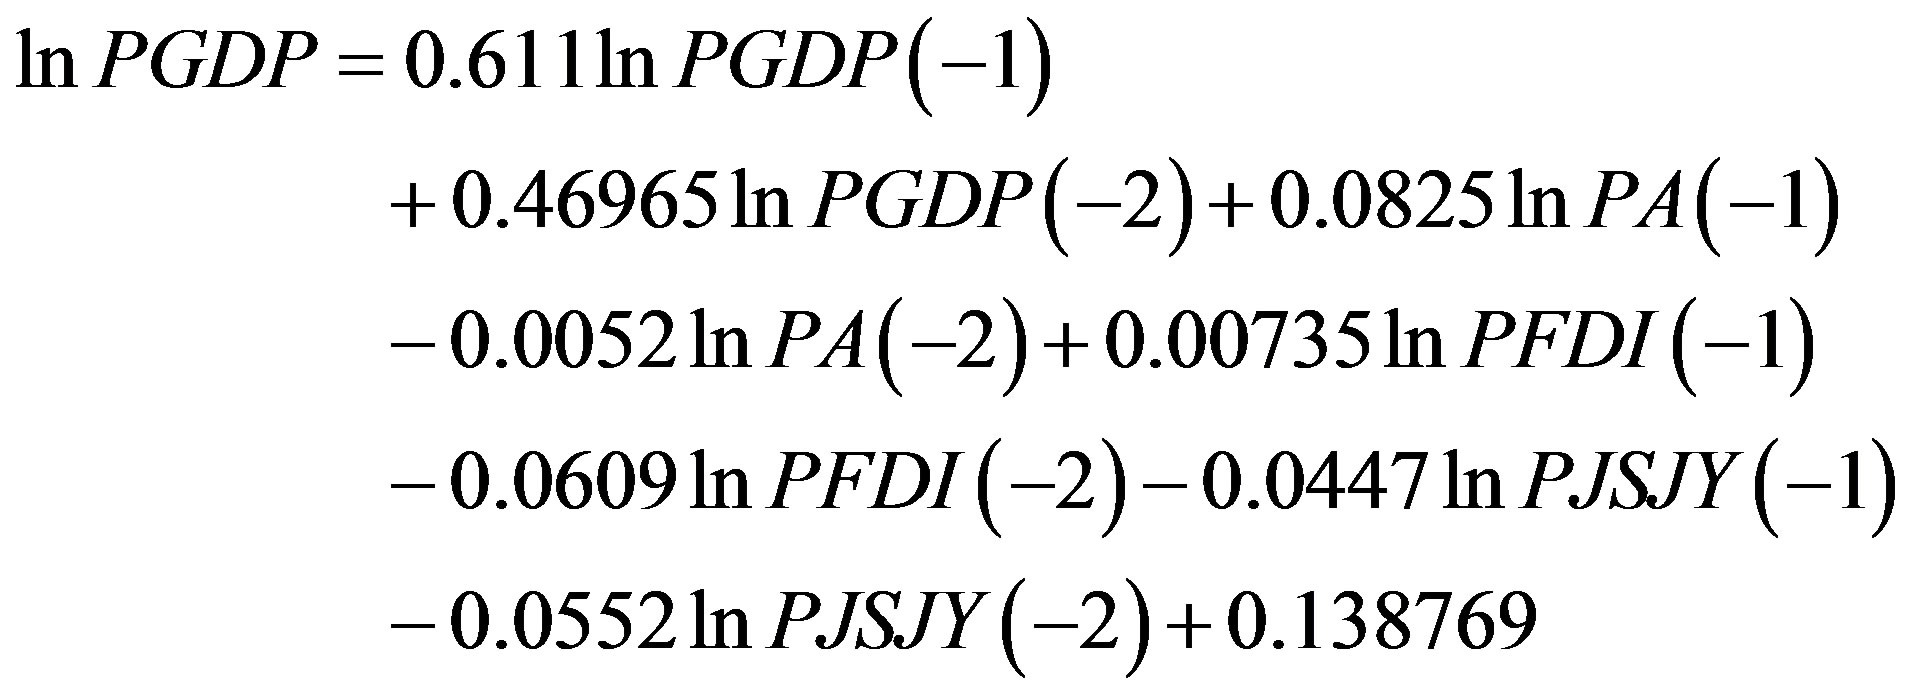
From the short-time variation of economic growth, in addition to the influence on themselves, the influence rate of patent output, transaction in the market of technologies and foreign direct investment on the current economic growth is 8.25%, 4.47% and 0.735%, which shows the influence is not remarkable. That means the economic growth significantly relies on the long-term equilibrium relationship. But the influence coefficient of economic growth to other variables, indicating that economic growth has a greater demand for scientific innovation, and this kind of demand encourages the patent output, foreign direct investment and technologies transaction. All these information validates the interactivity in the above interpretation model.
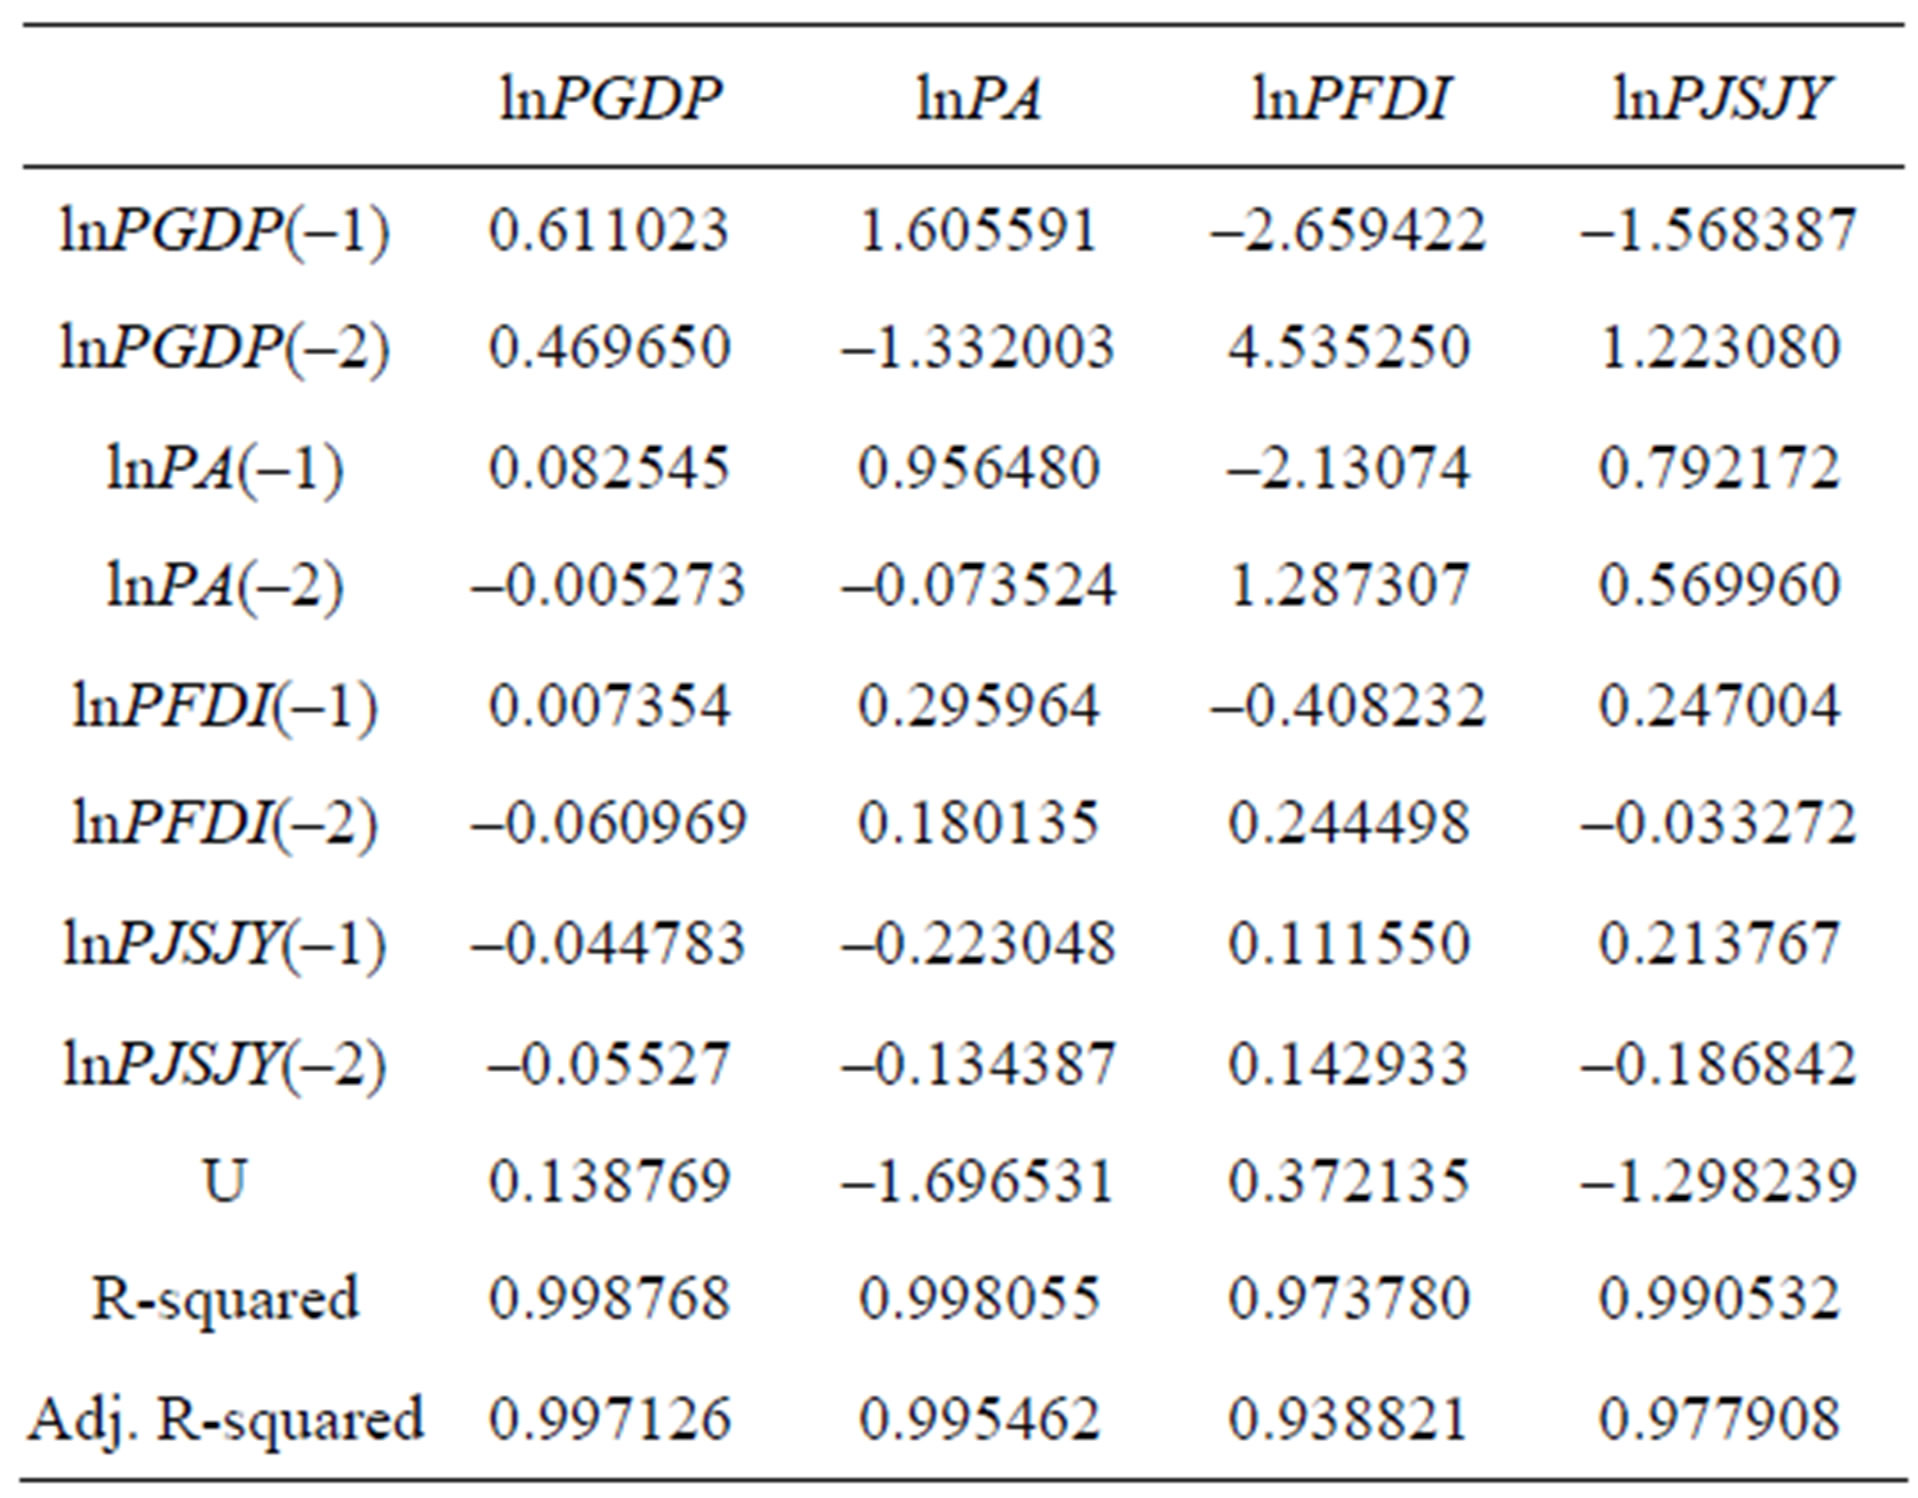
Table 2. Vector autoregression estimates.
AR test method is generally used for VAR model testing, which means that the model is stationary when all the reciprocals of root model in VAR model is less than 1. Otherwise, the model is non-stationary and the result is invalid. The location mapping of each characteristic root has been made (Figure 3), and it can be seen that all the characteristic roots are within the unit circle, which shows that the model in this paper is stationary and the result is valid.
4.4. Variance Decomposition Analysis
The result of variance decomposition analysis indicates that the amount of information each variable contributes to the other variables in the VAR model, and determines how much of the forecast error variance of each of variables can be explained by exogenous shocks to the other variables.
From Figure 4, in the short-term, it can be seen that the impacts of the patent output and foreign direct investment on the variation in economic growth both show a positive correlation, and the contribution rates of the influence are around 5% and 10% respectively. The impact of transaction in the technology market on the variation in economic growth is not notable. The economic growth has a growing impact on the variation in patent output, reaching up to 60% in the sixth period, and the economic growth also has a growing impact on the variations in the foreign direct investment and transactions in the technology market. The influence rate of patent output on the transaction in the technology market maintains a level of 5% approximately, and the influence of patent output on the foreign direct investment is more significant, reaching up to 70% during the first two periods, and then decreases a little. The effect of foreign direct investment on transaction in the technology market is the most significant at first, which is up to 78%, and then decreases
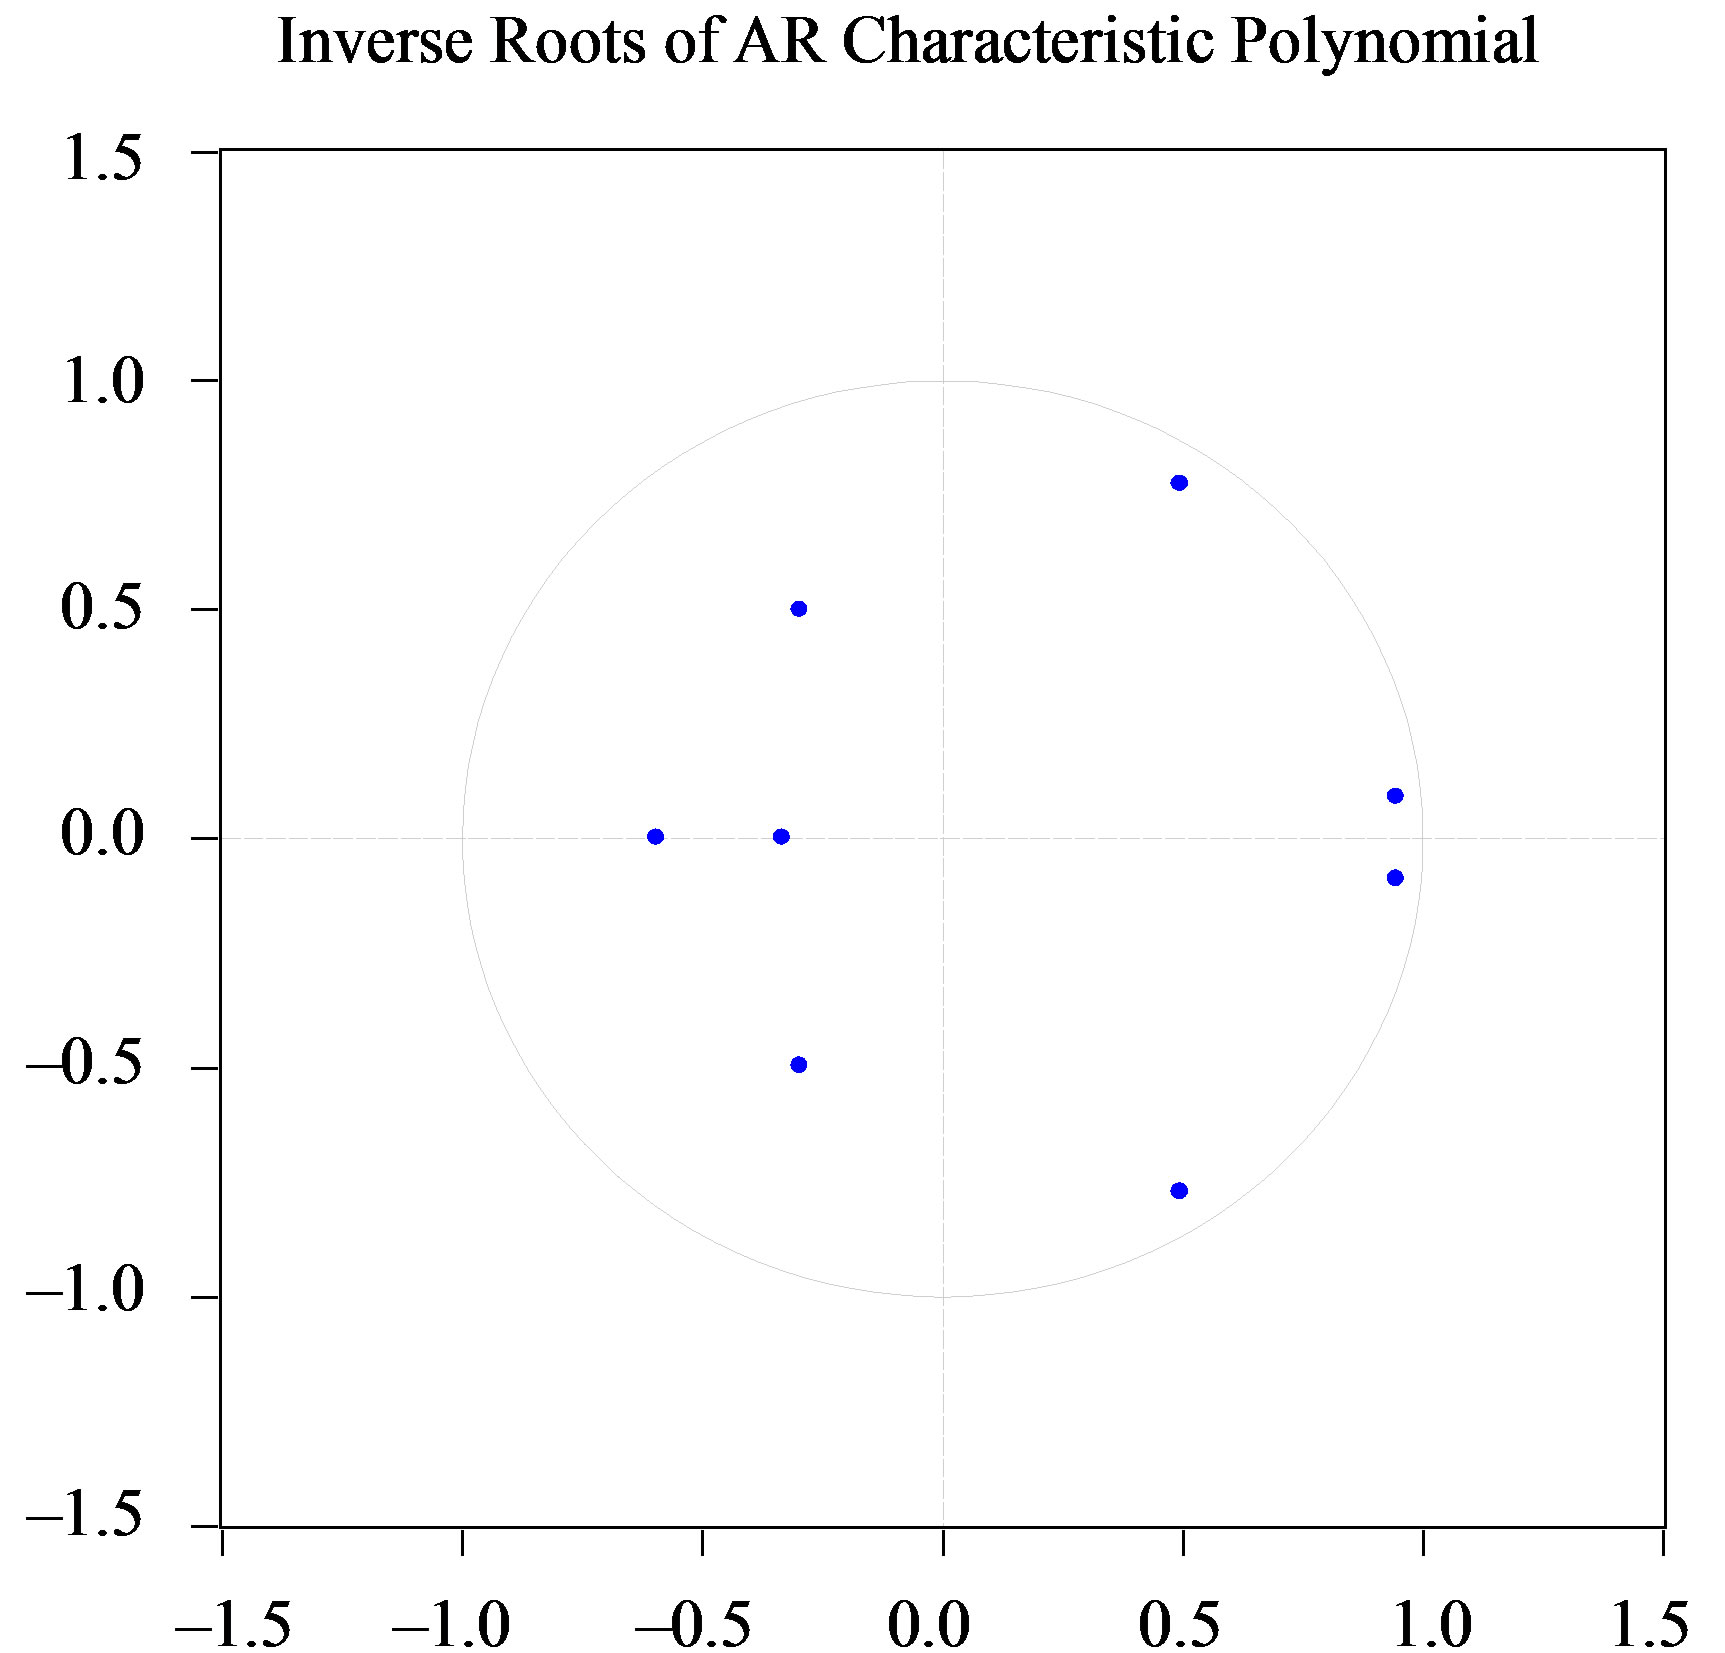
Figure 3. AR test chart.
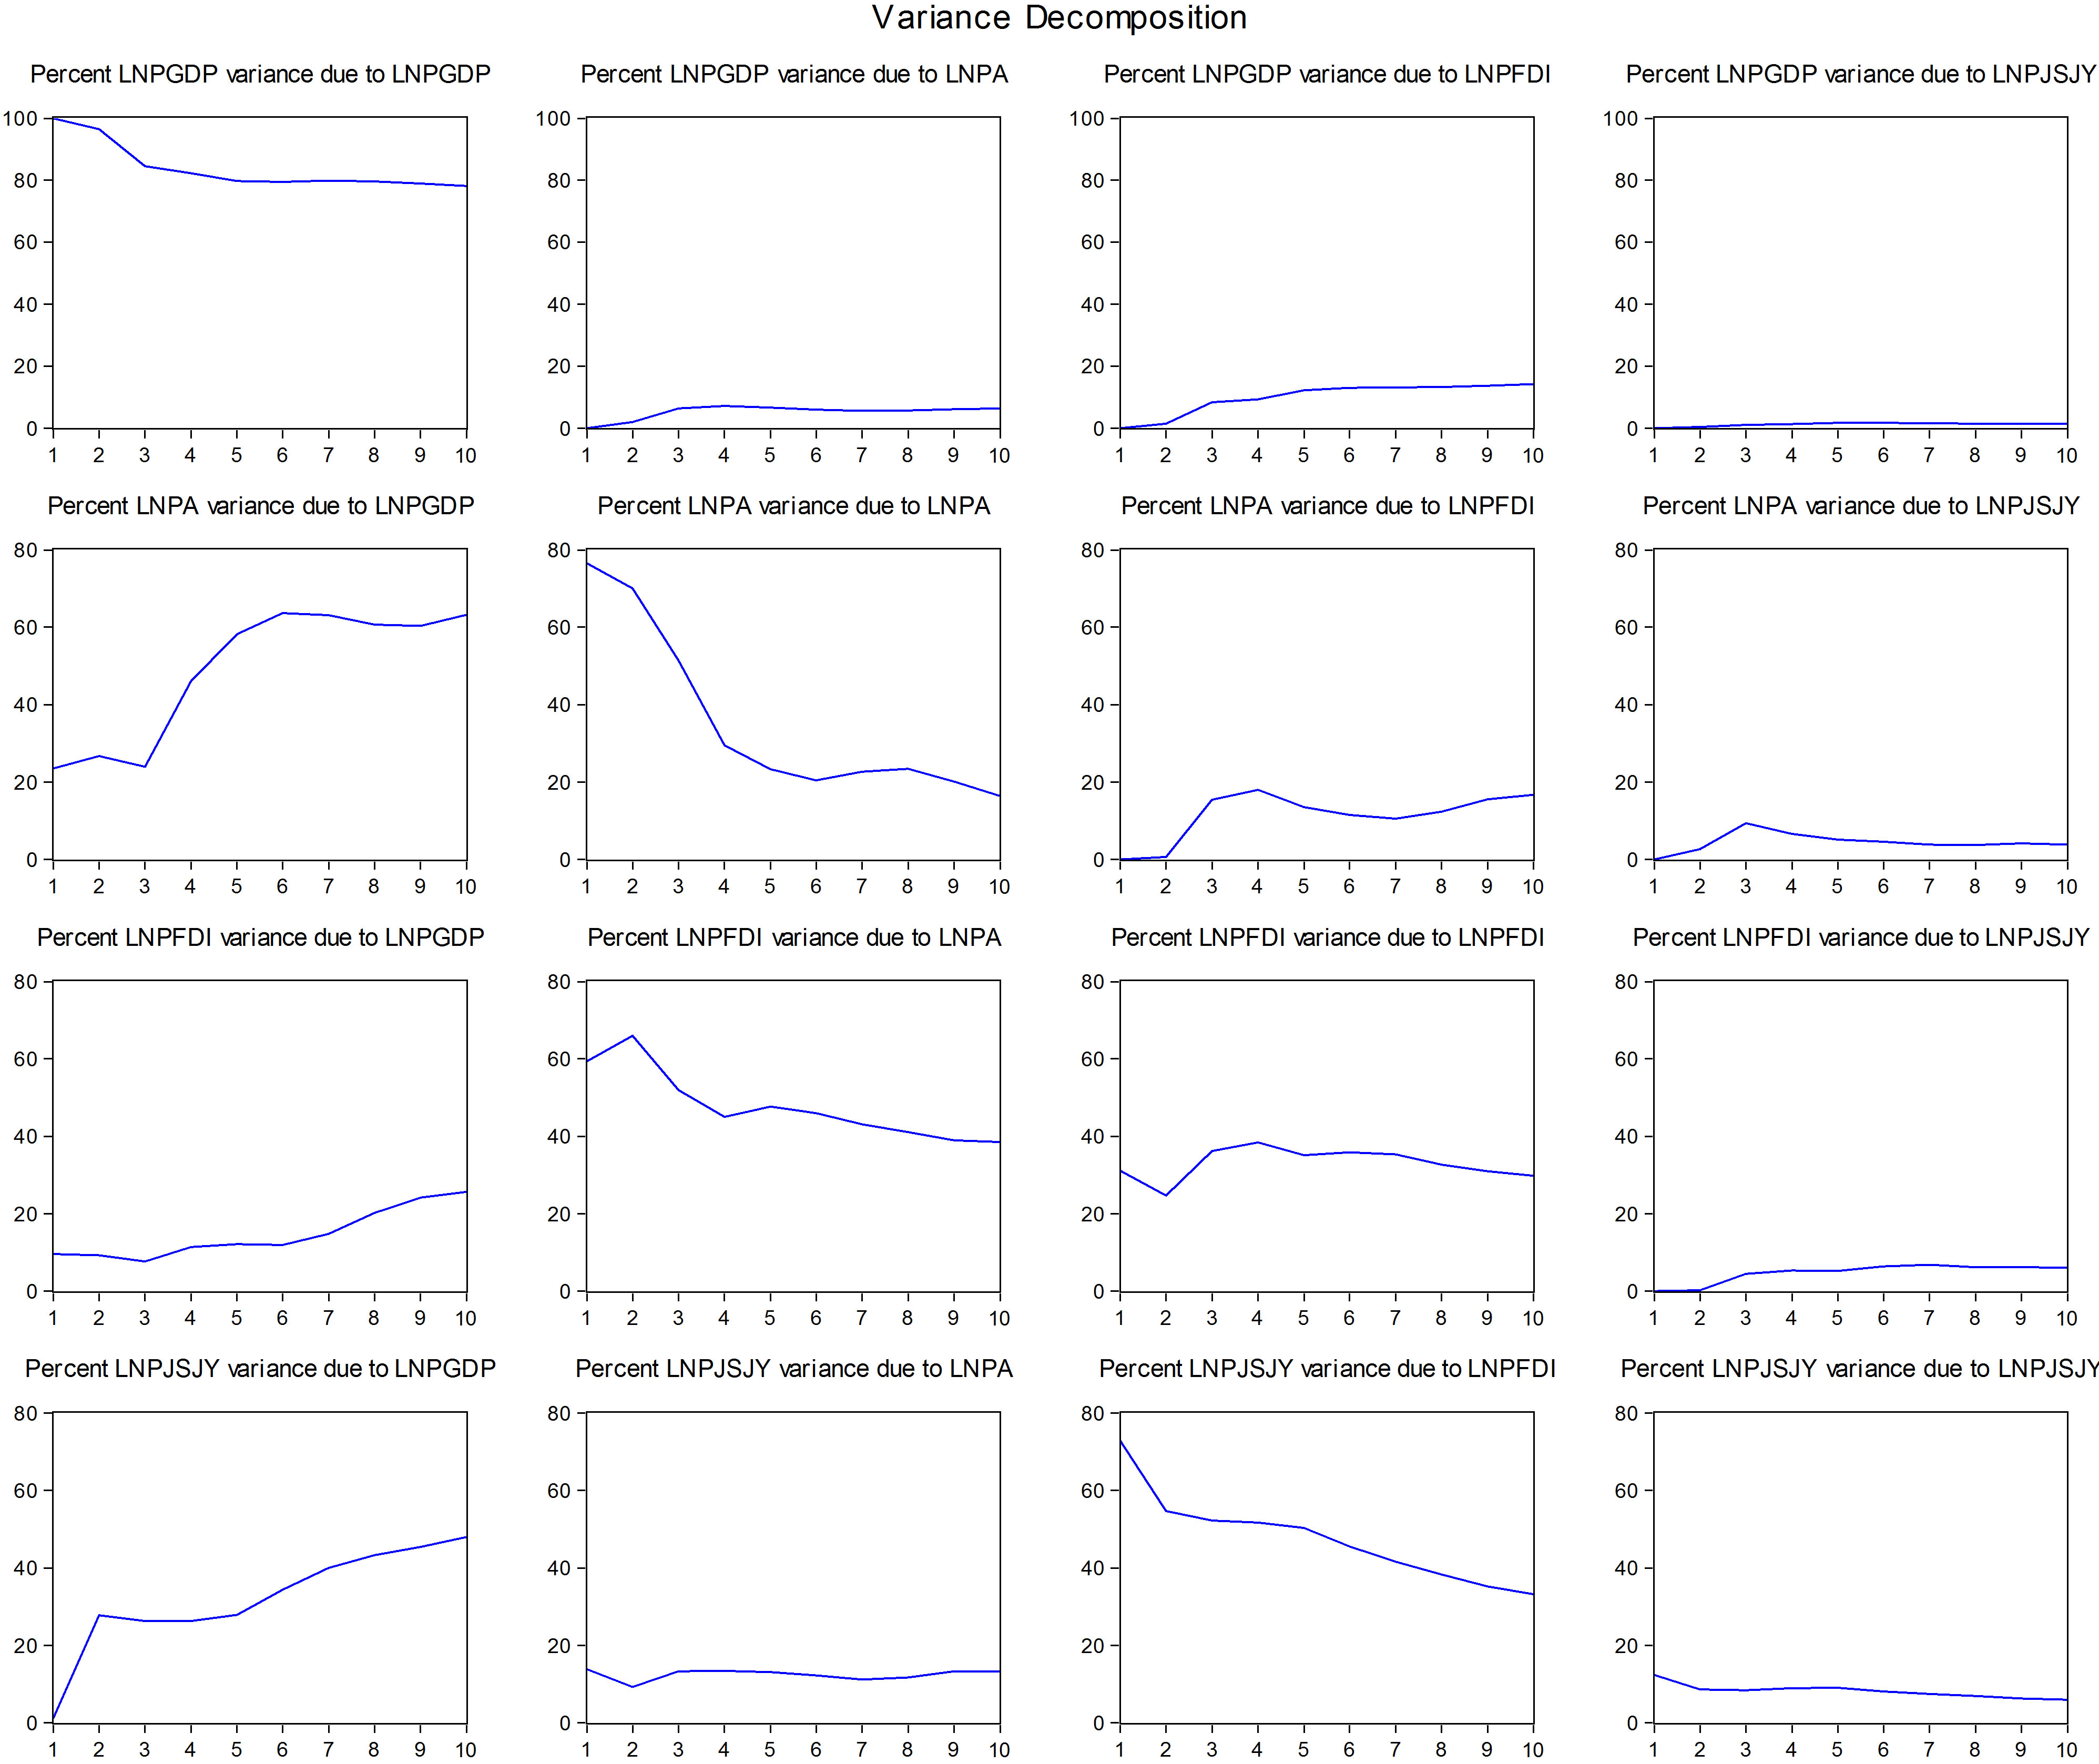
Figure 4. Variance decomposition analysis.
with period. The impact of foreign direct investment on patent output is not remarkable at first, and stabilizes at around 20% from the fourth period, while the impacts of transaction in the technology market on patent output and foreign direct investment are not so remarkable with less than 5% influence rate. The analysis can be concluded that the contribution rates of economic growth in the current period on the quantum index of patent applications, the foreign direct investment index and index of transaction in the technologies market are higher, while the contribution rates of quantum index of patent applications, the foreign direct investment index and index of transaction in the technologies market on the economic growth is lower and even unremarkable. This result is consistent with that of VAR estimates.
5. Conclusion
From the above tests and analysis, we can include the VAR estimates can be well consistent with the interpretation model. As the important indicator of innovation efforts, the patent plays a vital role in the economic growth in Beijing. On the one hand, the patent as the index for the technological development, innovated and improved the technologies, leading to the increase of productivity and the economic growth, on the other hand, the patent system protects the benefits of the inventors and the social interest, which can effectively encourage the innovation, and promote the economic growth. Besides, the foreign direct investment index and index of transaction in the technologies market as the other two indicators of scientific innovation still need a long period to promote the economic growth. Anyway, there is a long-term equilibrium relationship between scientific innovation and economic growth in Beijing. Scientific innovation represented by patent output, foreign direct investment and technologies transaction promotes the economic growth, and the economic growth increases the demand for science and technology, and boosts the scientific innovation, which will have a virtuous circle between scientific innovation and economic growth in Beijing.
6. Acknowledgements
This research was supported in part by the key program of Anhui Natural Science Foundation (11040606M22) and the Research Project on Scientific Innovation by Anhui Natural Science Foundation (1208085MG124).
REFERENCES
- P. M. Romer, “Increasing Returns and Long-Run Growth,” Journal of Political Economy, Vol. 94, No. 5, 1986, pp. 1002-1037. doi:10.1086/261420
- R. E. Lucas Jr., “On the Mechanics of Economic Development,” Journal of monetary Economy, Vol. 22, No. 1, 1988, pp. 3-42. doi:10.1016/0304-3932(88)90168-7
- X. K. Yang and J. Boriand, “A Microeconomic Mechanism for Economic Growth,” Journal of Political Economy, Vol. 99, No. 3, 1991, pp. 460-482. doi:10.1086/261762
- R. E. Cave, “Multinational Firm, Competition and Productivity in Host-country Market,” Economica, Vol. 41, No. 162, 1974, pp. 176-193. doi:10.2307/2553765
- M. Blomstorm, “foreign Direct Invest and Spillover Efficiency in an Underdeveloped Economy: Evidence Form in the Mexico,” Word Development, Vol. 11, No. 6, 1983, pp. 493-501. doi:10.1016/0305-750X(83)90016-5
- X. W. Yang, L. Yan and L. H. Liu, “The Research on Scientific Progress and Economic growth Based on the Theory of Physics,” Statistics and Decision, Vol. 9, No. 16, 2005, pp. 19-22.
- Z. Xu and P. Shi, “An Assessment of the Relative Efficiency of Investment in S & T-Positive Analysis Based on DEA,” Studies in Science of Science, Vol. 23, No.4, 2008, pp. 68-70.
- Z. J. Xu, “The Evidence Analysis about the Promotive Effect of Scientific and Technical Investment on the GDP in China,” Mathematics in Economics, Vol. 25, No. 1, 2008, pp. 58-63.
- C. A. Sims, “1980 macroeconomics and Reality,” Econometrica, Vol. 48, No. 1, 1980, pp. 1-48. doi:10.2307/1912017
Appendix: The Date from 1991 to 2010 in Beijing
