Technology and Investment
Vol.3 No.2(2012), Article ID:19395,8 pages DOI:10.4236/ti.2012.32014
Value Investing in Thailand: Evidence from the Use of PEG
School of Business, National Institute of Development Administration, Bangkok, Thailand
Email: paiboon43@hotmail.com
Received January 18, 2012; revised February 18, 2012; accepted February 25, 2012
Keywords: Value Investing; PEG; the Stock Exchange of Thailand
ABSTRACT
Value investing has gained popularity as a number of researches showed that various investment strategies based on this concept could generate significantly higher returns than the market. Investment using PEG as a selection rule was developed from the strategy based on P/E ratio. A test was conducted in this study to evaluate whether the investment strategy based on PEG ratio could be applied to the investments in the Stock Exchange of Thailand. Using the data from 1999-2010, the results showed that PEG ratio was effective in generating higher returns than the stock exchange’s total return index throughout the analysis of 12-year research data.
1. Introduction
Value investing has been widely accepted today as seen from success stories of both local and foreign investors who employed this principle. Value investing was derived from the concept of Benjamin Graham, the father of security analysis based on fundamental factors. It was described in Graham’s The Intelligent Investor published in 1949 [1]. Apart from the proof of success confirmed by a large number of investors throughout a period of time, value investing is in itself a reasonable and easy-tounderstand principle and has therefore been rapidly communicated to and accepted widely by the public.
The approach of value investing makes use of fundamental analysis, a rational analysis of securities based on an understanding of the business in which to invest. Value investing is thus related to the analysis of company’s performance which covers the financial statement study, the management transparency consideration, the analysis of competitiveness compared to that of the company’s competitors, and the use of various financial ratios including the ratios relating to market value of the company, such as price to earnings (P/E) ratio, price to book (P/B) ratio and a fair value assessment of the company.
One of the most popular financial ratios is the P/E ratio; whereby consideration focuses on stocks with low P/E ratio, which reflected that such stocks had a price lower than their fair value (undervalued) when compared to earnings per share which could be achieved. However, the method of stock selection based on low P/E ratio has been questioned with regard to how many businesses encountering trouble are included. This leads to the approach where the company’s growth is incorporated in the analysis, resulting in the price/earnings to growth (PEG) ratio.
PEG ratio is a refinement of P/E ratio due to the argument that buying stocks with a low P/E ratio, or the so-called valued stocks; or selecting stocks with high growth rate and also with a high P/E ratio, or the socalled growth stocks; might result in stocks that were not suitable for investment. The use of PEG ratio is therefore a combination of value investing and growth investing concepts because it is a criterion which considers the stock price as compared to profit, along with the growth rate of the profit.
Due to the fact that in recent years there has been an increasing interest in PEG ratio and while the study of the efficiency of PEG ratio in Thailand is still limited, this research therefore focuses on the selection of stocks in the Stock Exchange of Thailand through the use of PEG ratio based on stock information disclosed to the public to test whether this approach can generate higher returns than the average return of the stock exchan.
This report proceeds as follow. In the next section, previous related literatures are reviewed and summarized. Then the research methodology and data used are discussed. Empirical results found in the study are then presented and analyzed. Lastly, conclusion, implications, and limitations together with suggestion for further study are discussed.
2. Literature Review
In the past years, scholars focused their interest on the situation where the price of stocks traded in the market was not consistent with fundamental information, and studied the causes of this irregularity; such as Schatzberg and Vora [2], Robichek and Bogue [3], Banz [4], Reinganum [5] and Fama and French [6]; who all emphasized on the return based on investment strategy which employed price ratios for consideration such as P/DPS, P/E, P/B, etc. Major proportion of the studies reported that investing in stocks which had low value of these ratios yielded better returns than average; and value stocks1 yielded better returns than growth stocks2. Grinblatt and Titman [7] Gomes Kogan and Zhang [8] explained that it was because growth stocks usually had high furtive risk and their price also reflected future growth. These stocks would be able to generate high returns during the market upturn, but might cause massive damage during the market downturn.
However, Fama and French [9] and Petkova and Zhang [10] had proposed their research outputs which argued against the aforementioned risk perspective. They reported that value stocks had higher risk than growth stocks and due to higher risk premium, their prices were thus lower. Lakonishok, Shleifer and Vishny [11] provided a different rationale for value premium that growth stocks had high steady growth and were assessed by investors that they would be growing as usual in the future, while in fact competitive business environment made it difficult to remain steady as before. On the other hand, value stocks had low growth in the past; so they had a chance to flip the situation and experience higher growth in the future than expected.
Due to the conflict of perspectives on price and growth opportunity between growth stocks and value stocks, the PEG ratio became more widely discussed. However, academic work on PEG ratio was not much available. Holt [12] conducted a study on returns from growth stocks selected based on P/E ratio as compared to other securities, while Malkiel [13] proposed methods for growth stock valuation as compared to non-growth stocks.
Sun [14] studied the relationship between PEG ratio and rate of returns and found that the return of portfolio investment with high or low PEG ratio were less than those of portfolio investment with average PEG ratio. This experiment outcome cast doubt on low PEG investment strategy including the efficiency of PEG in security selection. However, Easton [15] reached a different conclusion from that of Sun [14]; he presented a model for assessing expected profitability and growth of returns employing PEG-based ranking, and a discovery that the return being estimated correlated significantly with the level of the PEG ratio. He concluded that PEG ratio was a reasonable first-line tool for the assessment of expected returns. Subsequent study of Easton [16] also followed the same direction. Estrada [17] selected stocks in the U.S. stock markets during 1975-2002 using P/E, PEG, and PERG3 ratios.
In Thailand, study of value investment strategies is still limited. Hemwachirawarakorn and Intara [18] conducted a study on value investing in Thailand during the 2004-2008 by selecting stocks to include in a portfolio based on the P/E, P/B and dividend yield ratios. The result showed that this approach could generate higher returns than the market. Supattarakul and Jongjaroenkamol [19] conducted a research on factors affecting the P/E and P/B ratios in the Stock Exchange of Thailand during 1996-2008 by using the approach of residual income model to describe events. It was found that the level of shareholders’ future return (future return on equity or FROE) was related to P/B ratio, and the rate of growth of future net profit (future earnings growth or FEG) was related to P/E ratio; where both FROE and FEG were the variables which represented the rate of future growth of a company, which reflected back to stock price.
Sareewiwatthana [20] studied the stock selection methodology for investing in the Stock Exchange of Thailand during 1996-2010 based on basic financial ratios such as P/E, P/B, ROE, etc., and found that the investment strategy based on these ratios could generate returns which significantly exceeded the market average. In addition, Maneesilasan [21] conducted a study on growth at a reasonable price (GARP) investment strategy by selecting stocks based on PEG ratio with the assumption that the rate of growth of profit generated by a company one year later was equal to the rate of change in average earnings per share of the last 3 years. The study result also showed that this strategy could generate higher returns than the market.
3. Data and Methodology
3.1. Concept of Stock Price Valuation Based on P/E and PEG Ratios
Price to earnings ratio (P/E) is a ratio between the stock’s market price and earnings per share a company generated in the past year. This ratio shows how appropriate the current stock price is, comparing to earnings per share. If all stocks in the market offer fixed income at all times, the most interesting stock will be the one with lowest P/E ratio, which should mean the shortest payback period. Moreover, P/E ratio also reflects the view of investors toward a company in the future; how many times the net profit that the company is capable of generating the investors are willing to invest their money in. The formula used for calculating the ratio is as follows:
Price = Price per share;
EPS = Earnings per share4.
Concept of improving the efficiency of P/E ratio through the use of PEG ratio.
PEG ratio was developed from P/E ratio by dividing the P/E ratio by the long-term earnings growth rate. Over the past decade, the PEG ratio has become a popular tool for screening stocks. The PEG ratio depended on the measurement of value using the original P/E ratio and the growth rate of the future profit. The PEG ratio can be calculated as follows:
P/E = Price to Earnings Ratio;
g = Growth rate.
3.2. Research Data
This study utilizes data from the stock information of the Stock Exchange of Thailand during 1999-2010, totaling 12 years, whereby the closing price at the end of February was used as the starting price of the year, and the closing price at the end of February of the next year was used as the ending price of the year in order to align with the announcement of annual results of the listed companies. Earnings per share figure of the year which was announced within February of the next year was used as the earnings per share figure for calculating P/E ratio. The growth rate, g, was calculated based on earnings per share of the past 3 years, and this figure was further used as proxy of the growth rate of future earnings per share. The PEG ratio was thereafter calculated.
3.3. Research Methodology
This study employed the concept of value investing, whereby PEG ratio was used for stock screening. The concept was based on the hypothesis that stocks with low P/E ratio could generate higher returns than those with high P/E ratio while growth rate of earnings per share (g) was used as a tool to control risk. The PEG ratio could help filter out stocks of companies experiencing problems from the group with low P/E ratio and leave only the stocks which considered undervalued.
Stock selection for portfolio construction in this study focused first on stocks with lowest PEG ratio as they were most attractive for investment, with regard to the profit generated by the company, to the opportunity for future growth of the company, and to its capability of screening out stocks of businesses operating at loss. Four patterns of portfolio holdings are constructed, namely:
• Portfolio A: Investing in all stocks with PEG ratio greater than 0 and up to 1;
• Portfolio B: Investing in 30 stocks with the lowest PEG ratio which was greater than 0;
• Portfolio C: Investing in 20 stocks with the lowest PEG ratio which was greater than 0; and
• Portfolio D: Investing in 10 stocks with the lowest PEG ratio which was greater than 0.
Each investment was to be evaluated during the same period, i.e., during 1999-2010 by measuring the rate of return and the risk in the form of standard deviation of the portfolio returns, and then comparing the returns with the total return index of the Stock Exchange of Thailand (SET TRI), based on the following test hypothesis:
 ;
; .
.
µp = average annual rate of return of the portfolio, the stocks of which were selected through the use of PEG ratio;
µm = average annual rate of return of total return index of the Stock Exchange of Thailand.
The test was conducted to determine whether the selection of stocks through the use of PEG ratio was capable of generating significantly higher returns than those of stock exchange’s total return index investing.
4. Results
4.1. Portfolio A: All Stocks with PEG Greater than 0 and Not Exceeding 1
Table 1 shows the returns of Portfolio A, which con-
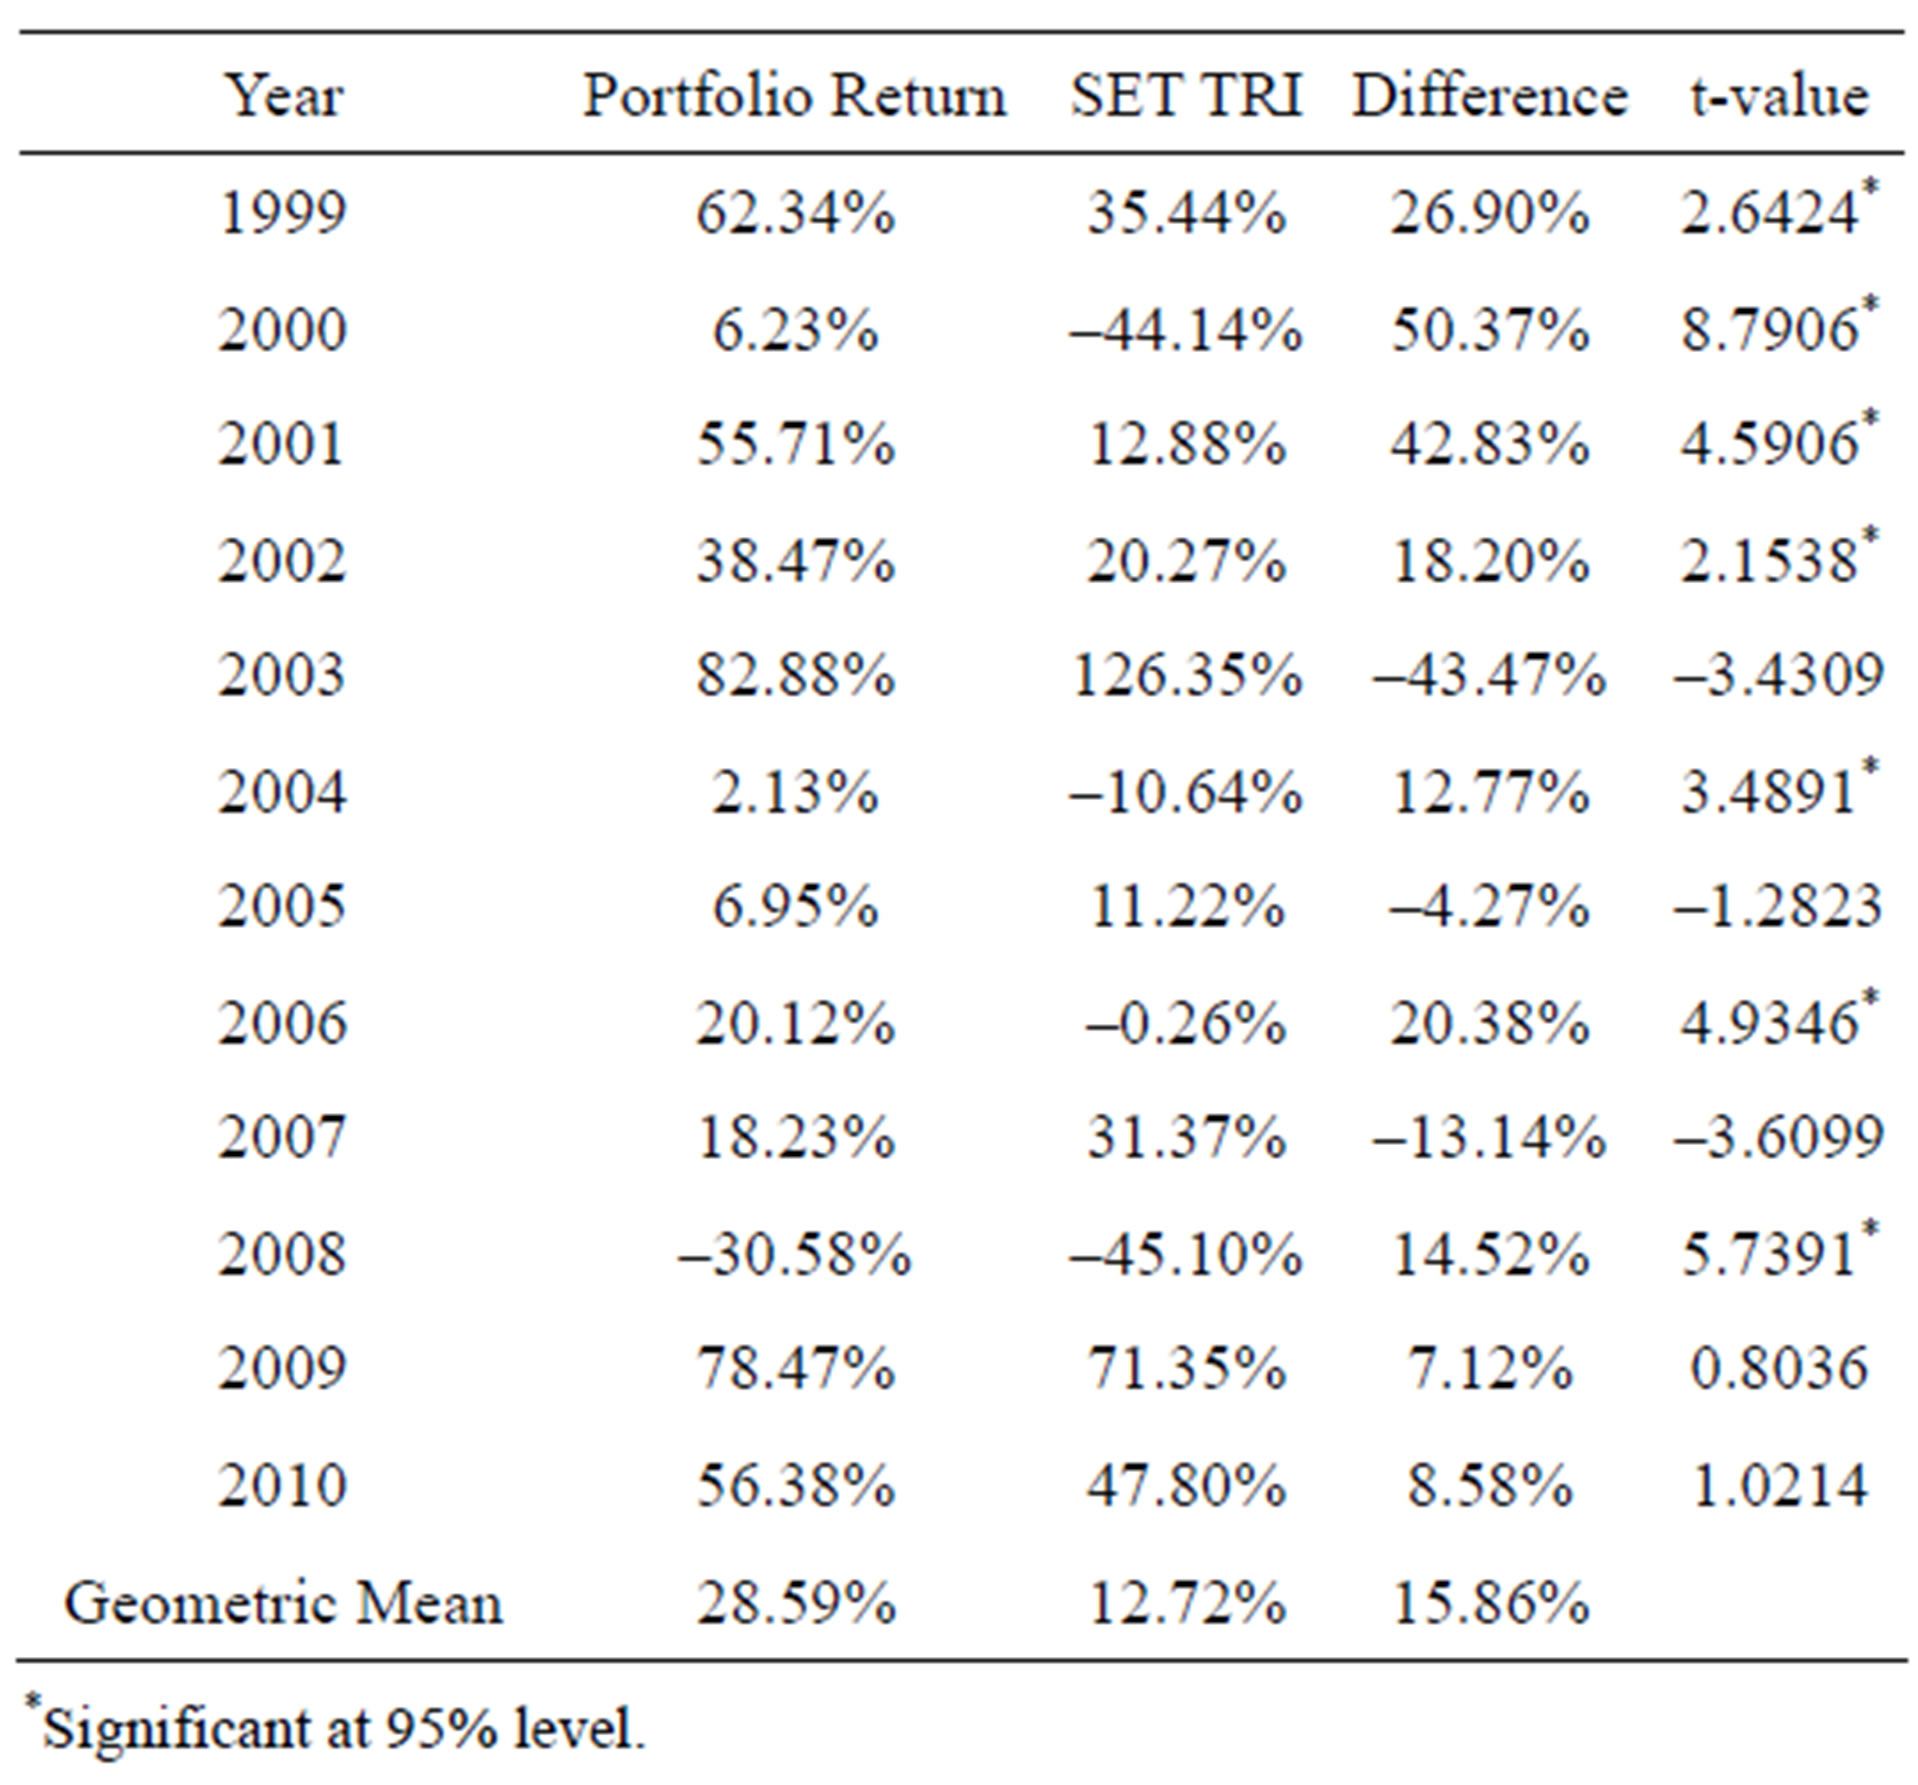
Table 1. Portfolio A’s returns compared to the market average.
sisted of all stocks with a PEG ratio greater than 0 and not exceeding 1 compared to the returns from the stock exchange’s total return index. Combined returns of Portfolio A consisting of capital gain yield and dividend yield were compared to the SET TRI. It was found that during the period tested, Portfolio A generated higher returns than the SET TRI in 9 out of 12 years, where significant difference was detected in 7 years out of the 9 years. This proved that Portfolio A could generate higher returns than those of the average in the long run, whereby the compound average of Portfolio A returns was 28.59% per annum and the compound average of the SET TRI was 12.72% per annum, corresponding to 15.86% difference.
Figure 1 shows the comparative added value of an investment in Portfolio A where it was assumed that initial investment was 1 million Baht in the beginning of 1999 (end of 1998) for a period of 12 years. At the end of 2010, Portfolio A had a value of 20,437,102 Baht while investment in the stock exchange was valued at 4,209,448 Baht.
Table 2 shows the risk-adjusted returns of Portfolio A by calculating the Sharpe ratio5 of Portfolio A and com-
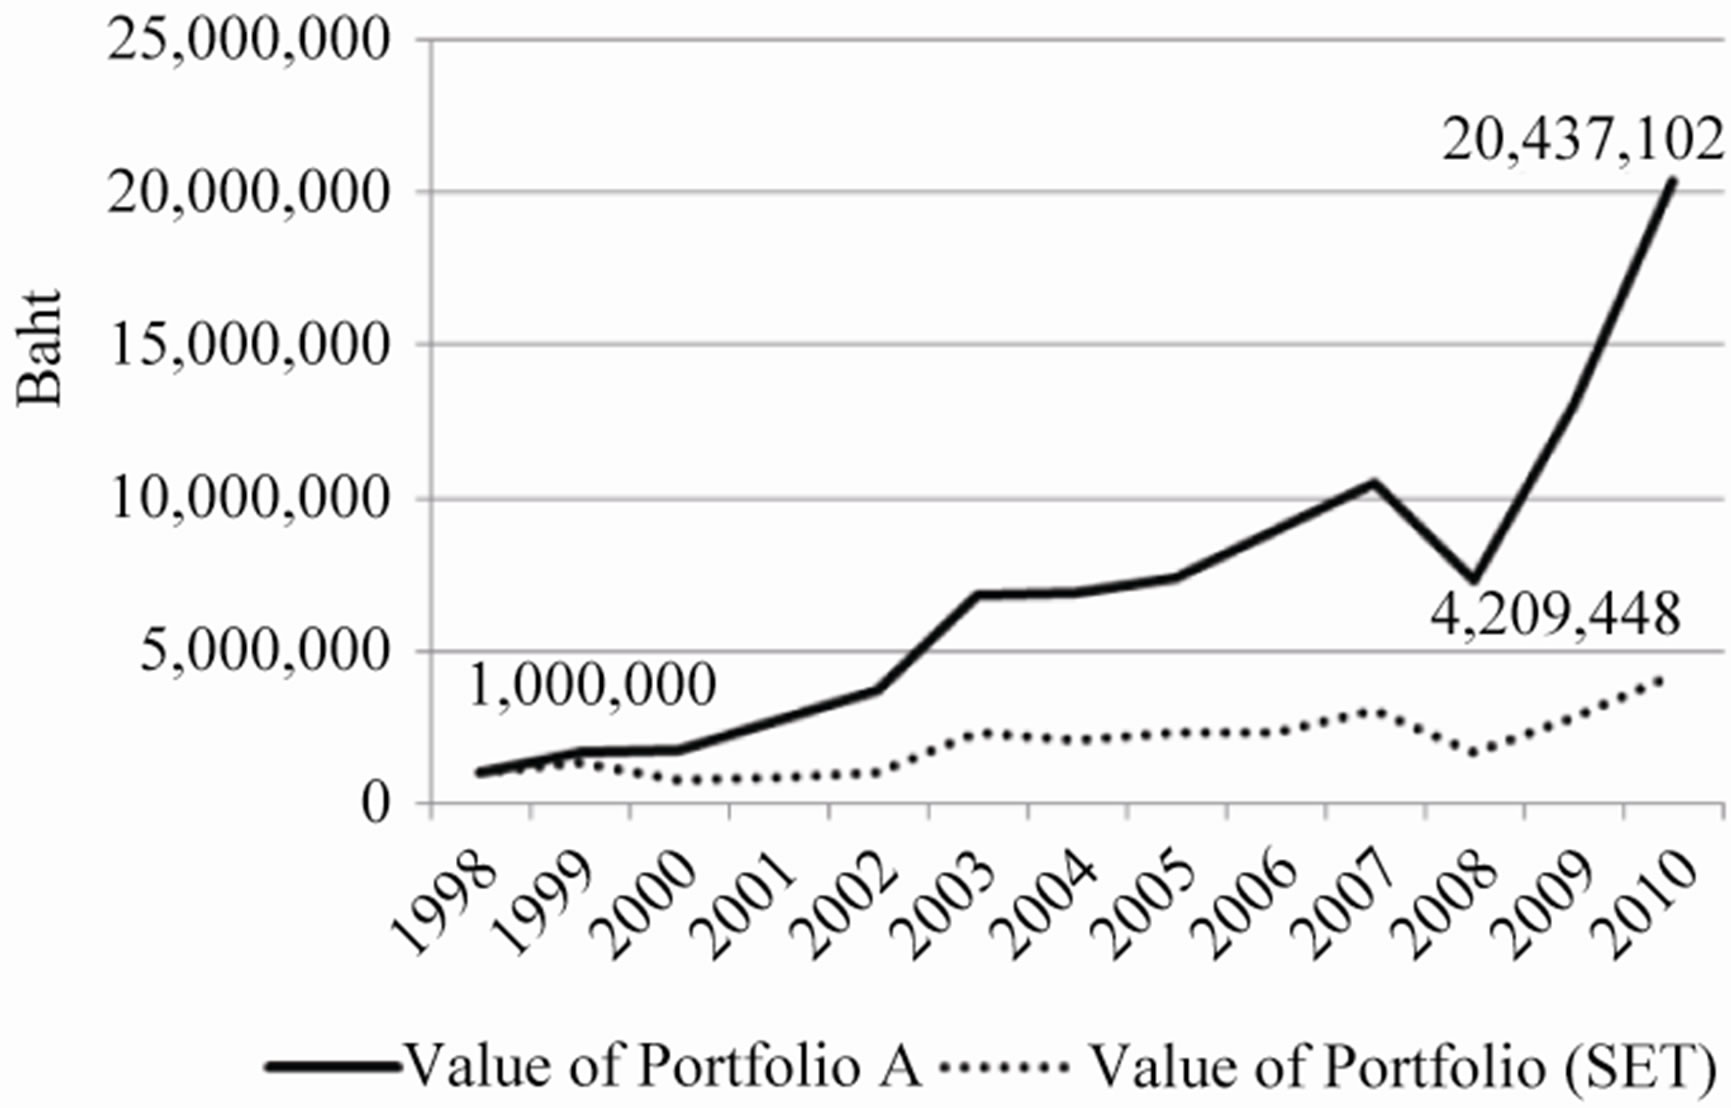
Figure 1. Portfolio values comparison.
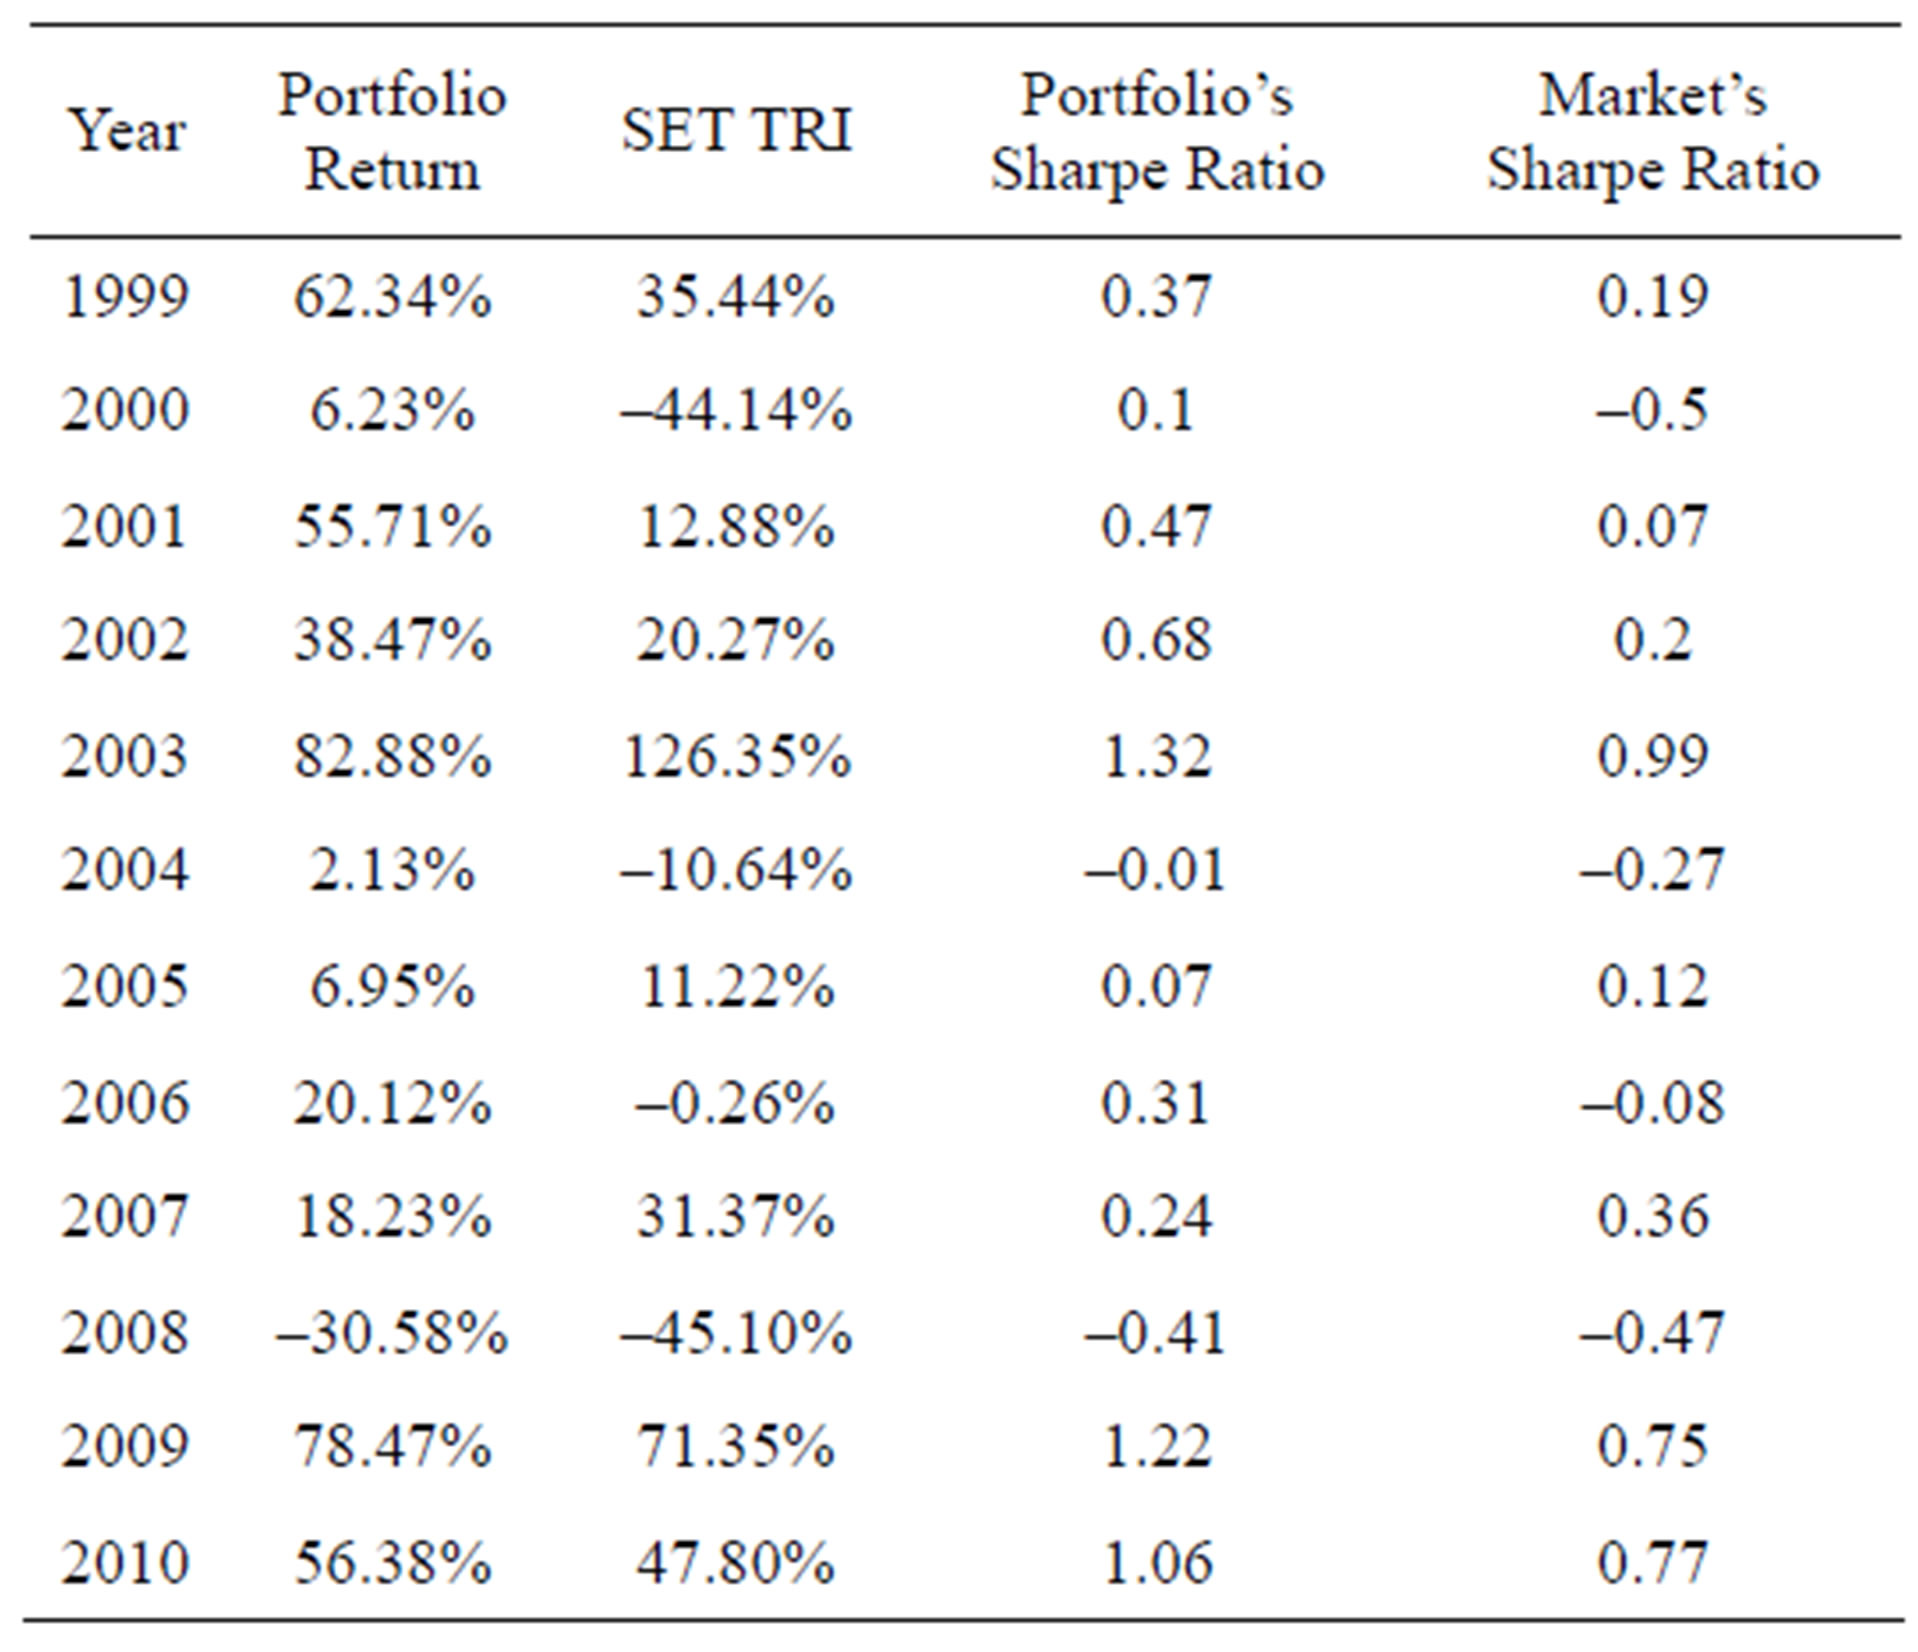
Table 2. Portfolio A’s sharpe ratio compared to the market’s sharpe ratio.
paring it with the Sharpe ratio of the SET TRI. It was found that Portfolio A had a higher Sharpe ratio than the TRI in 10 years out of the 12-year period.
4.2. Portfolio B: Investing in 30 Stocks with the Lowest PEG Ratio Which Was Greater than 0
Table 3 shows the returns of Portfolio B, which was consisted of 30 stocks with the lowest PEG ratio which was greater than 0 compared to the returns from the stock exchange’s total return index. It was found that Portfolio B generated higher returns than the SET TRI in 8 out of 12 years, where significant difference was detected in 7 years out of the 8 years, whereby the compound average of Portfolio B returns was 33.38% per annum and the compound average of the TRI was 12.72% per annum, corresponding to 20.66% difference.
Figure 2 shows the comparative added value of an investment in Portfolio B where it was assumed that initial investment was 1 million Baht in the beginning of 1999
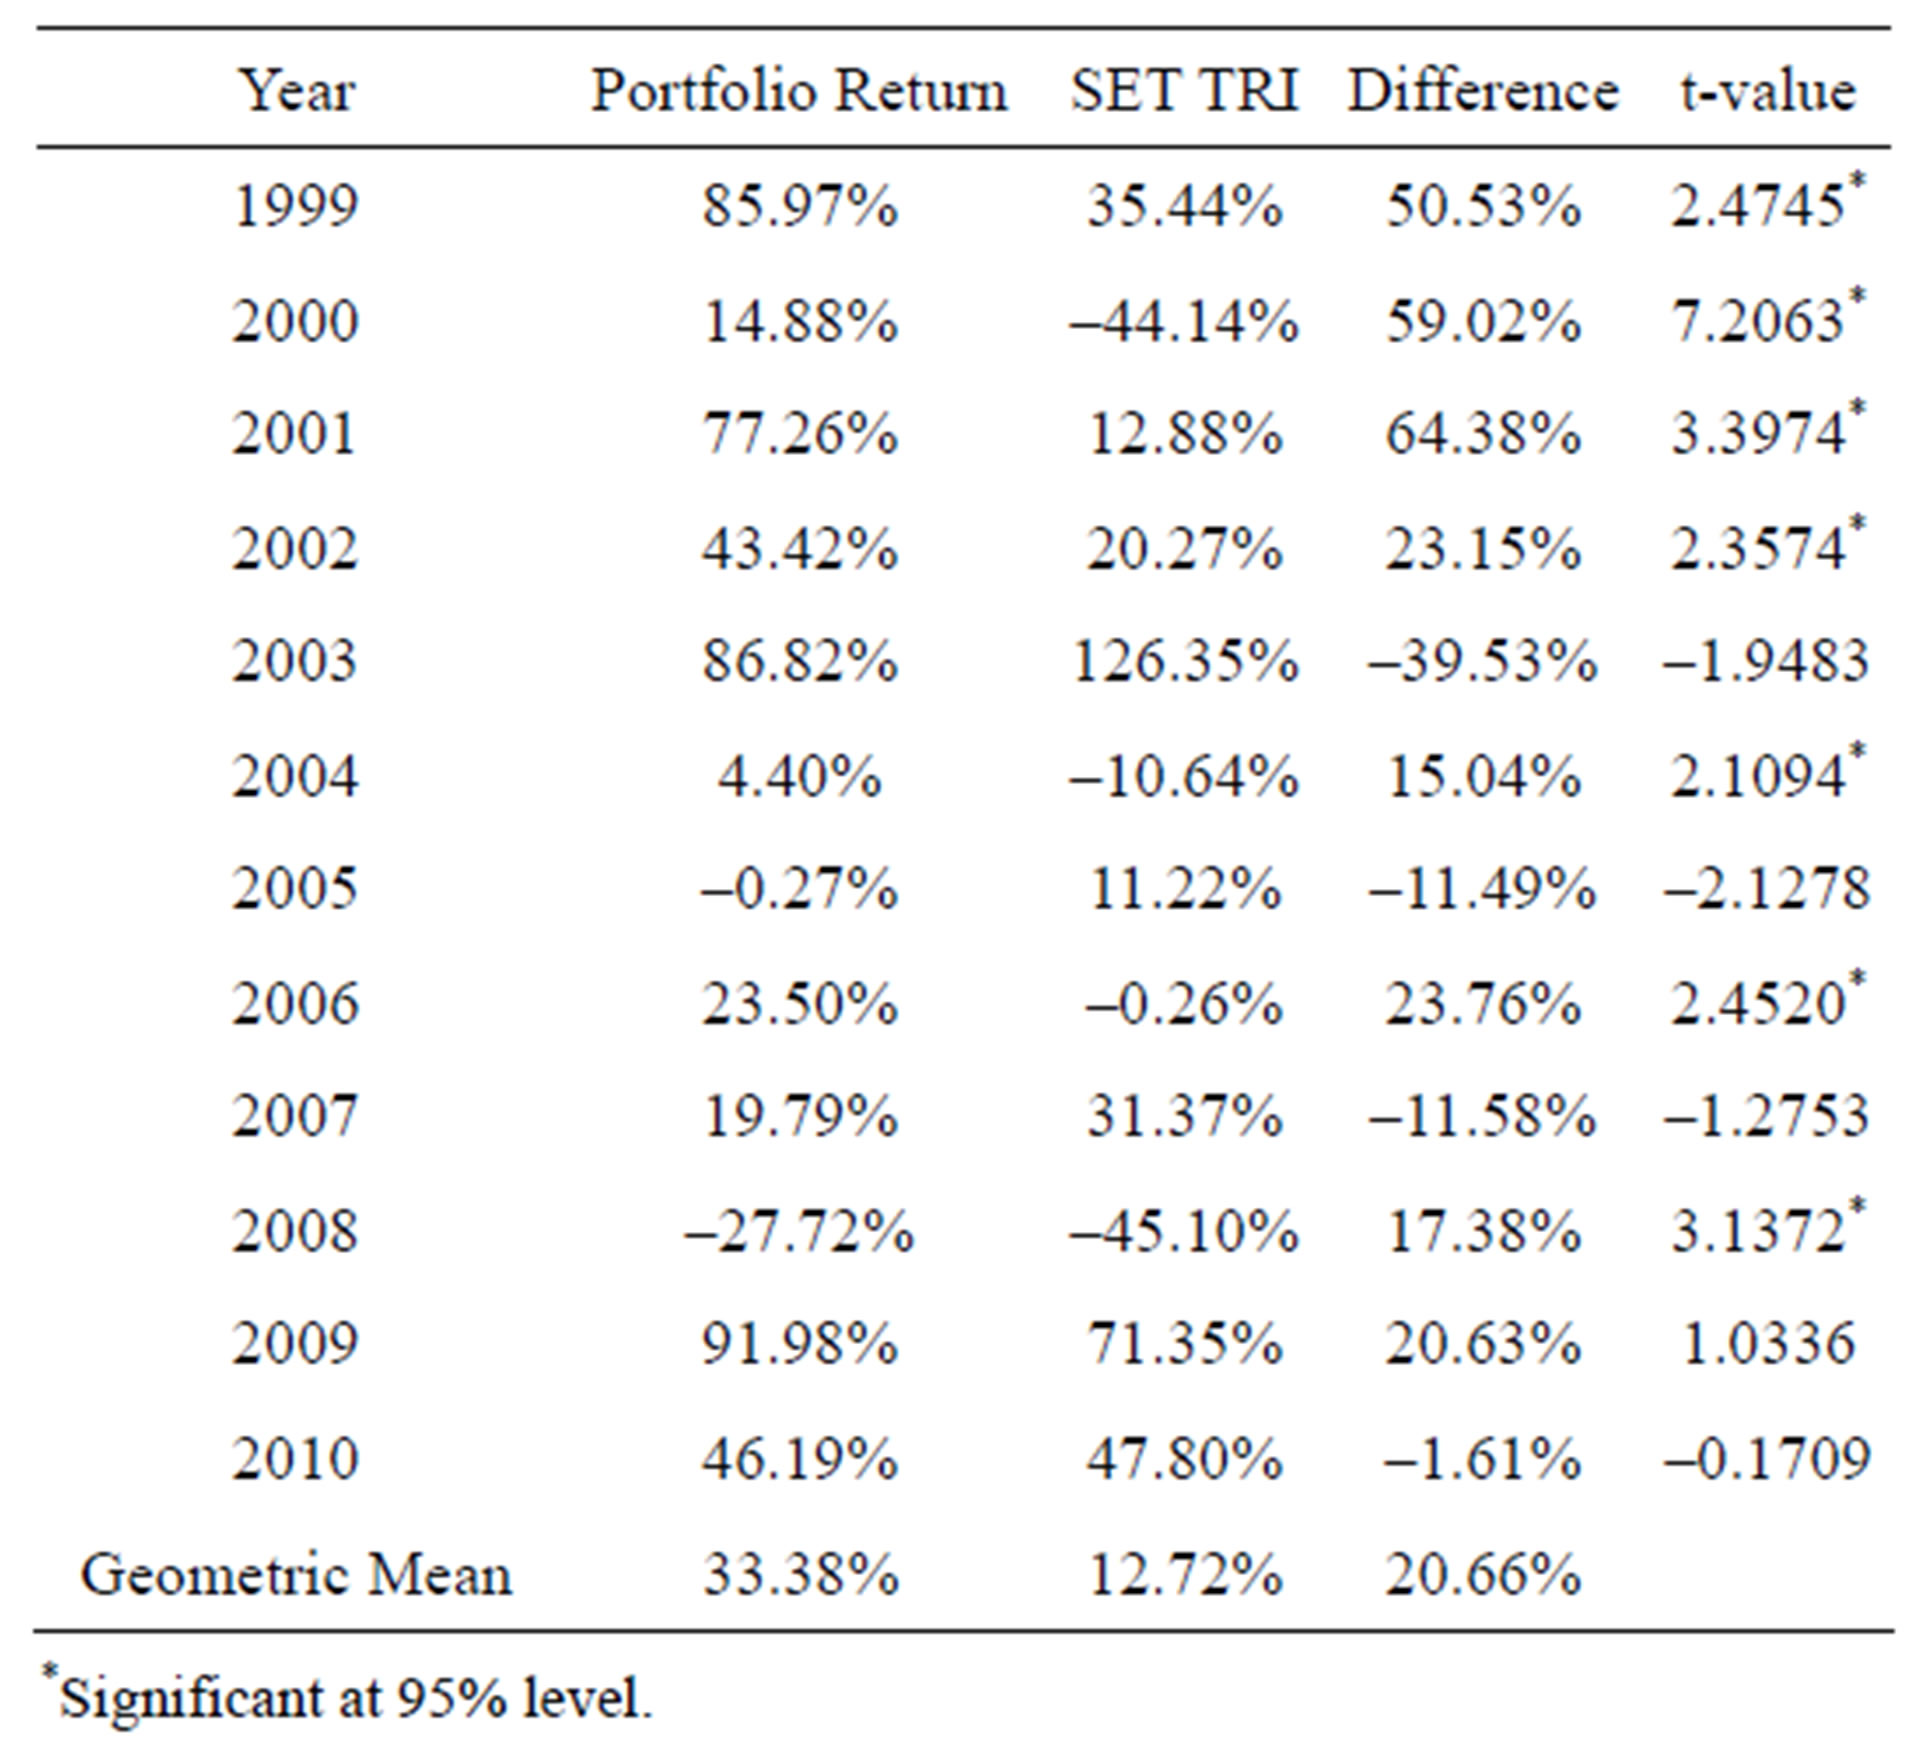
Table 3. Portfolio B’s returns compared to the market average.
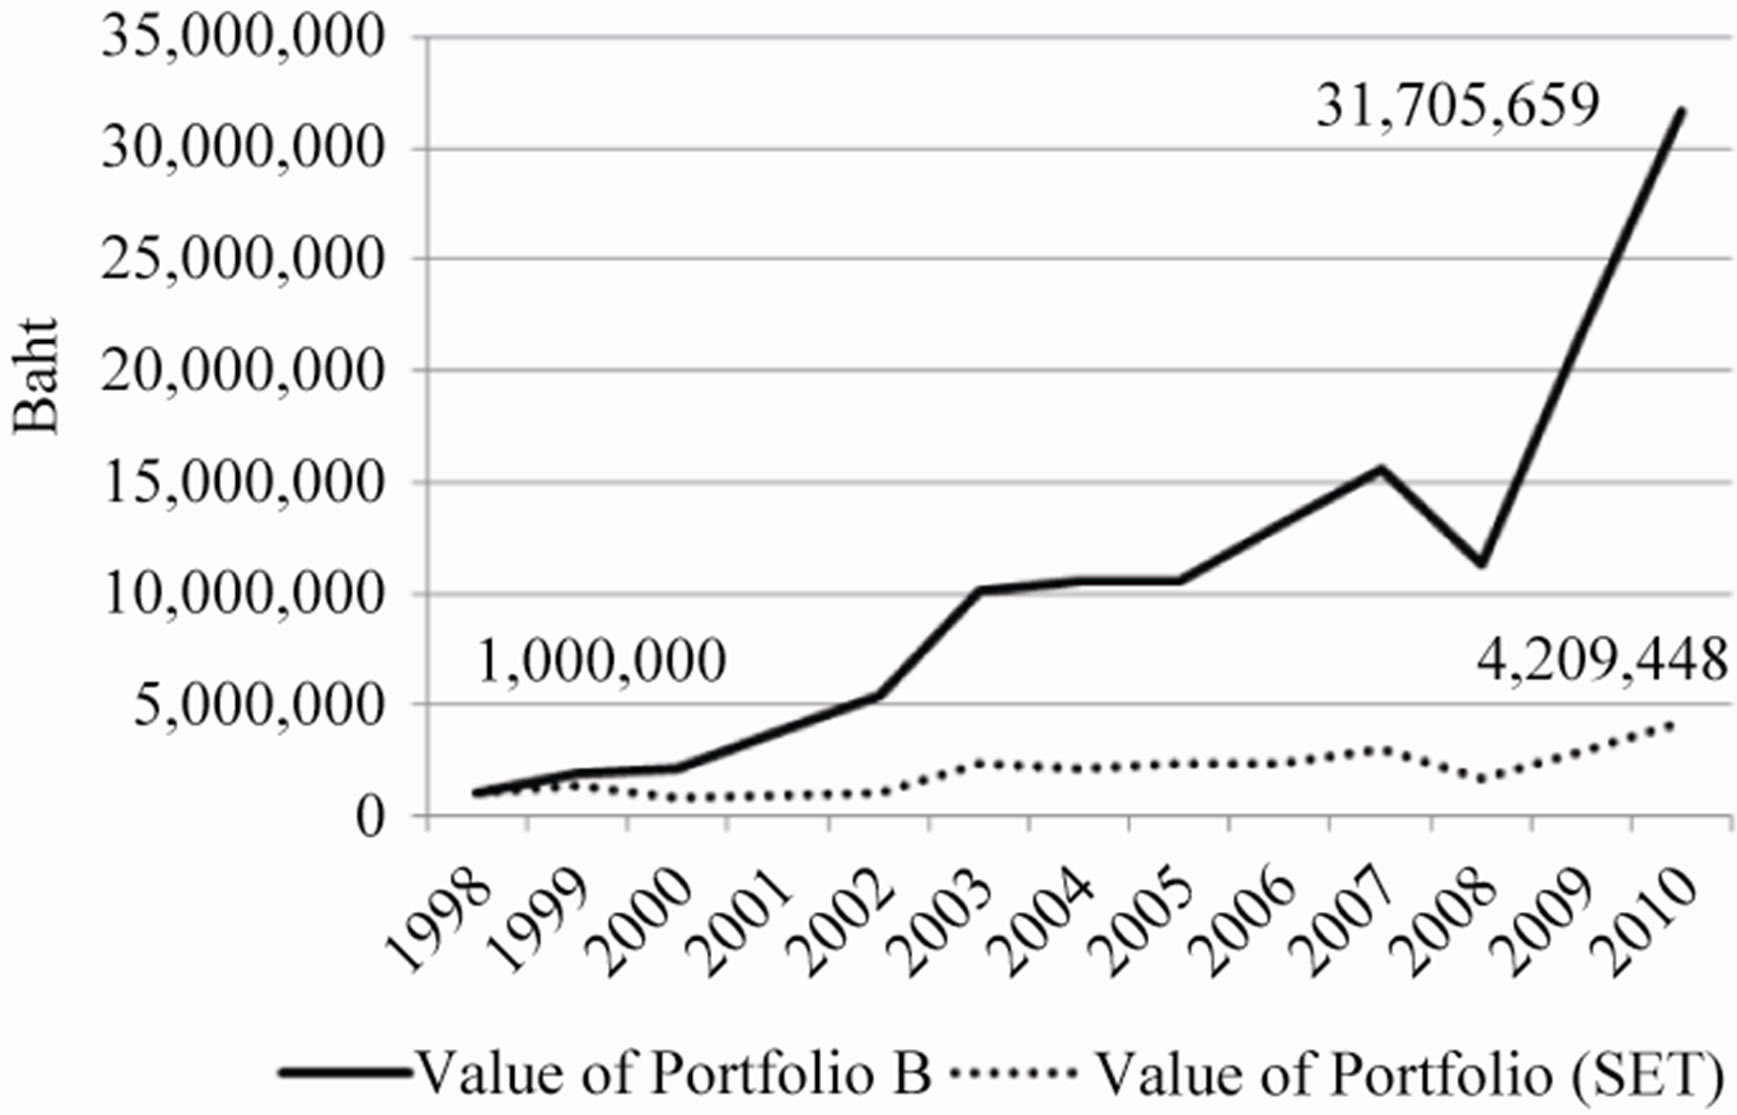
Figure 2. Portfolio values comparison.
(end of 1998) for a period of 12 years. At the end of the year 2010, Portfolio B had a value of 31,705,659 Baht while the investment in total stocks of the Thai stock exchange was valued at 4,209,448 Baht.
Table 4 shows the risk-adjusted returns of Portfolio B by calculating the Sharpe ratio of Portfolio B and comparing it with the Sharpe ratio of the SET TRI. It was found that Portfolio B had a higher Sharpe ratio than the SET TRI in 9 years out of the 12-year period.
4.3. Portfolio C: Investing in 20 Stocks with the Lowest PEG Ratio Which Was Greater than 0
Table 5 shows the returns of Portfolio C, which was consisted of 20 stocks with the lowest PEG ratio which was greater than 0 compared to the returns from the stock exchange’s total return index. Returns of Portfolio C were compared to returns of the SET TRI. It was found that Portfolio C generated higher returns than the stock
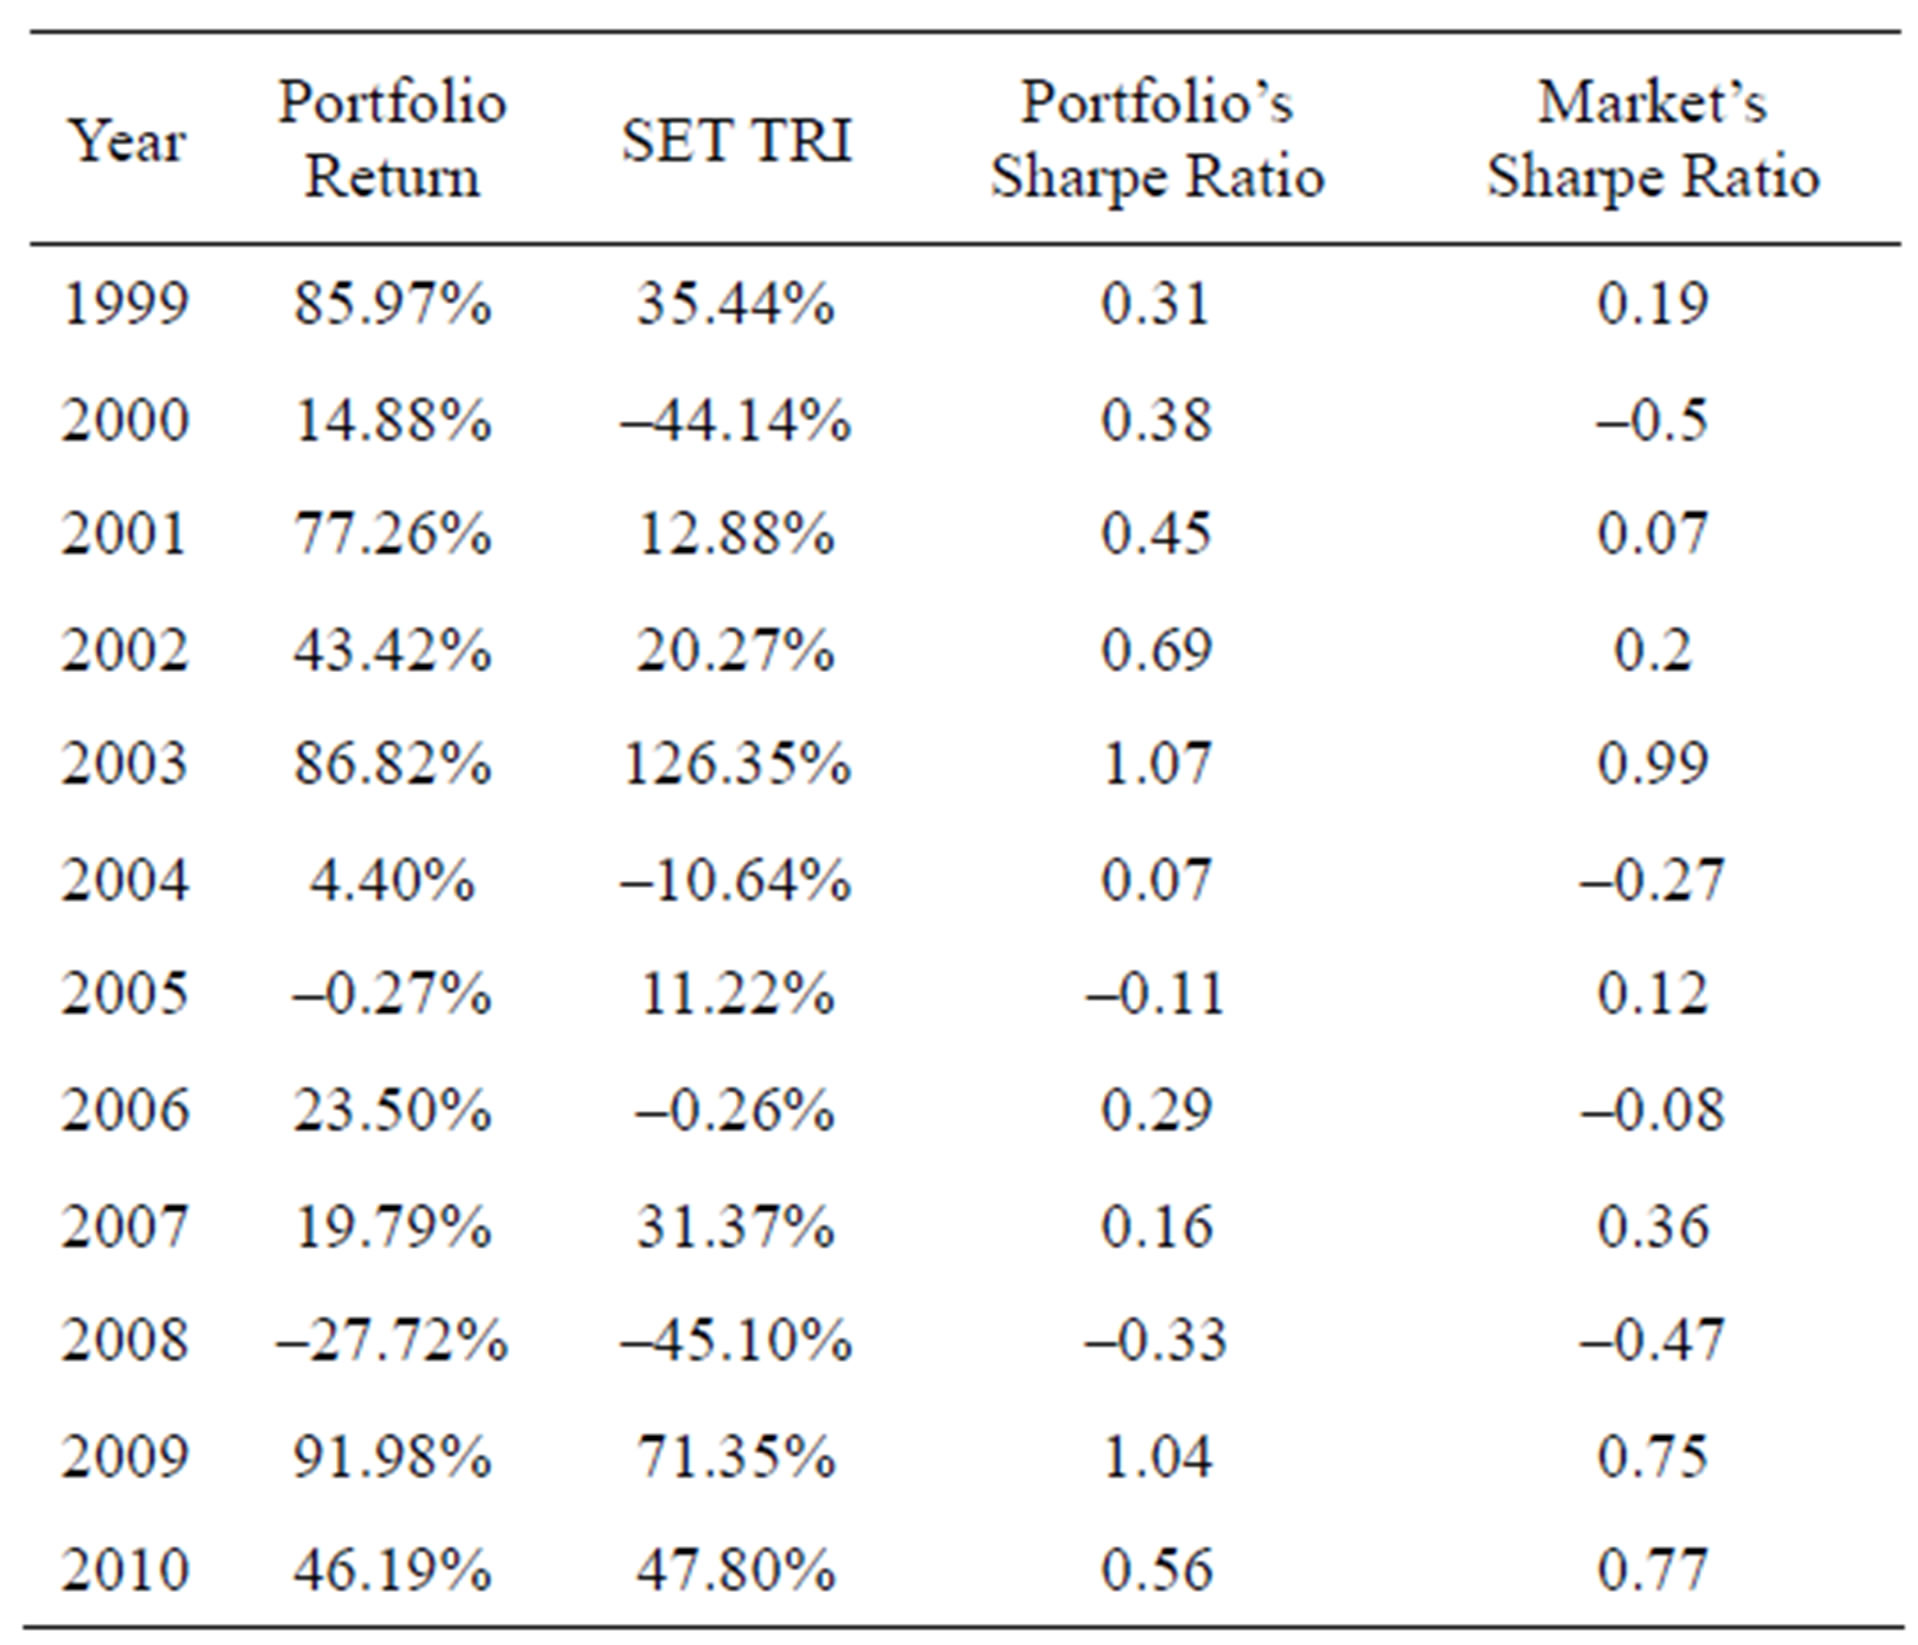
Table 4. Portfolio B’s sharpe ratio compared to the market’s sharpe ratio.
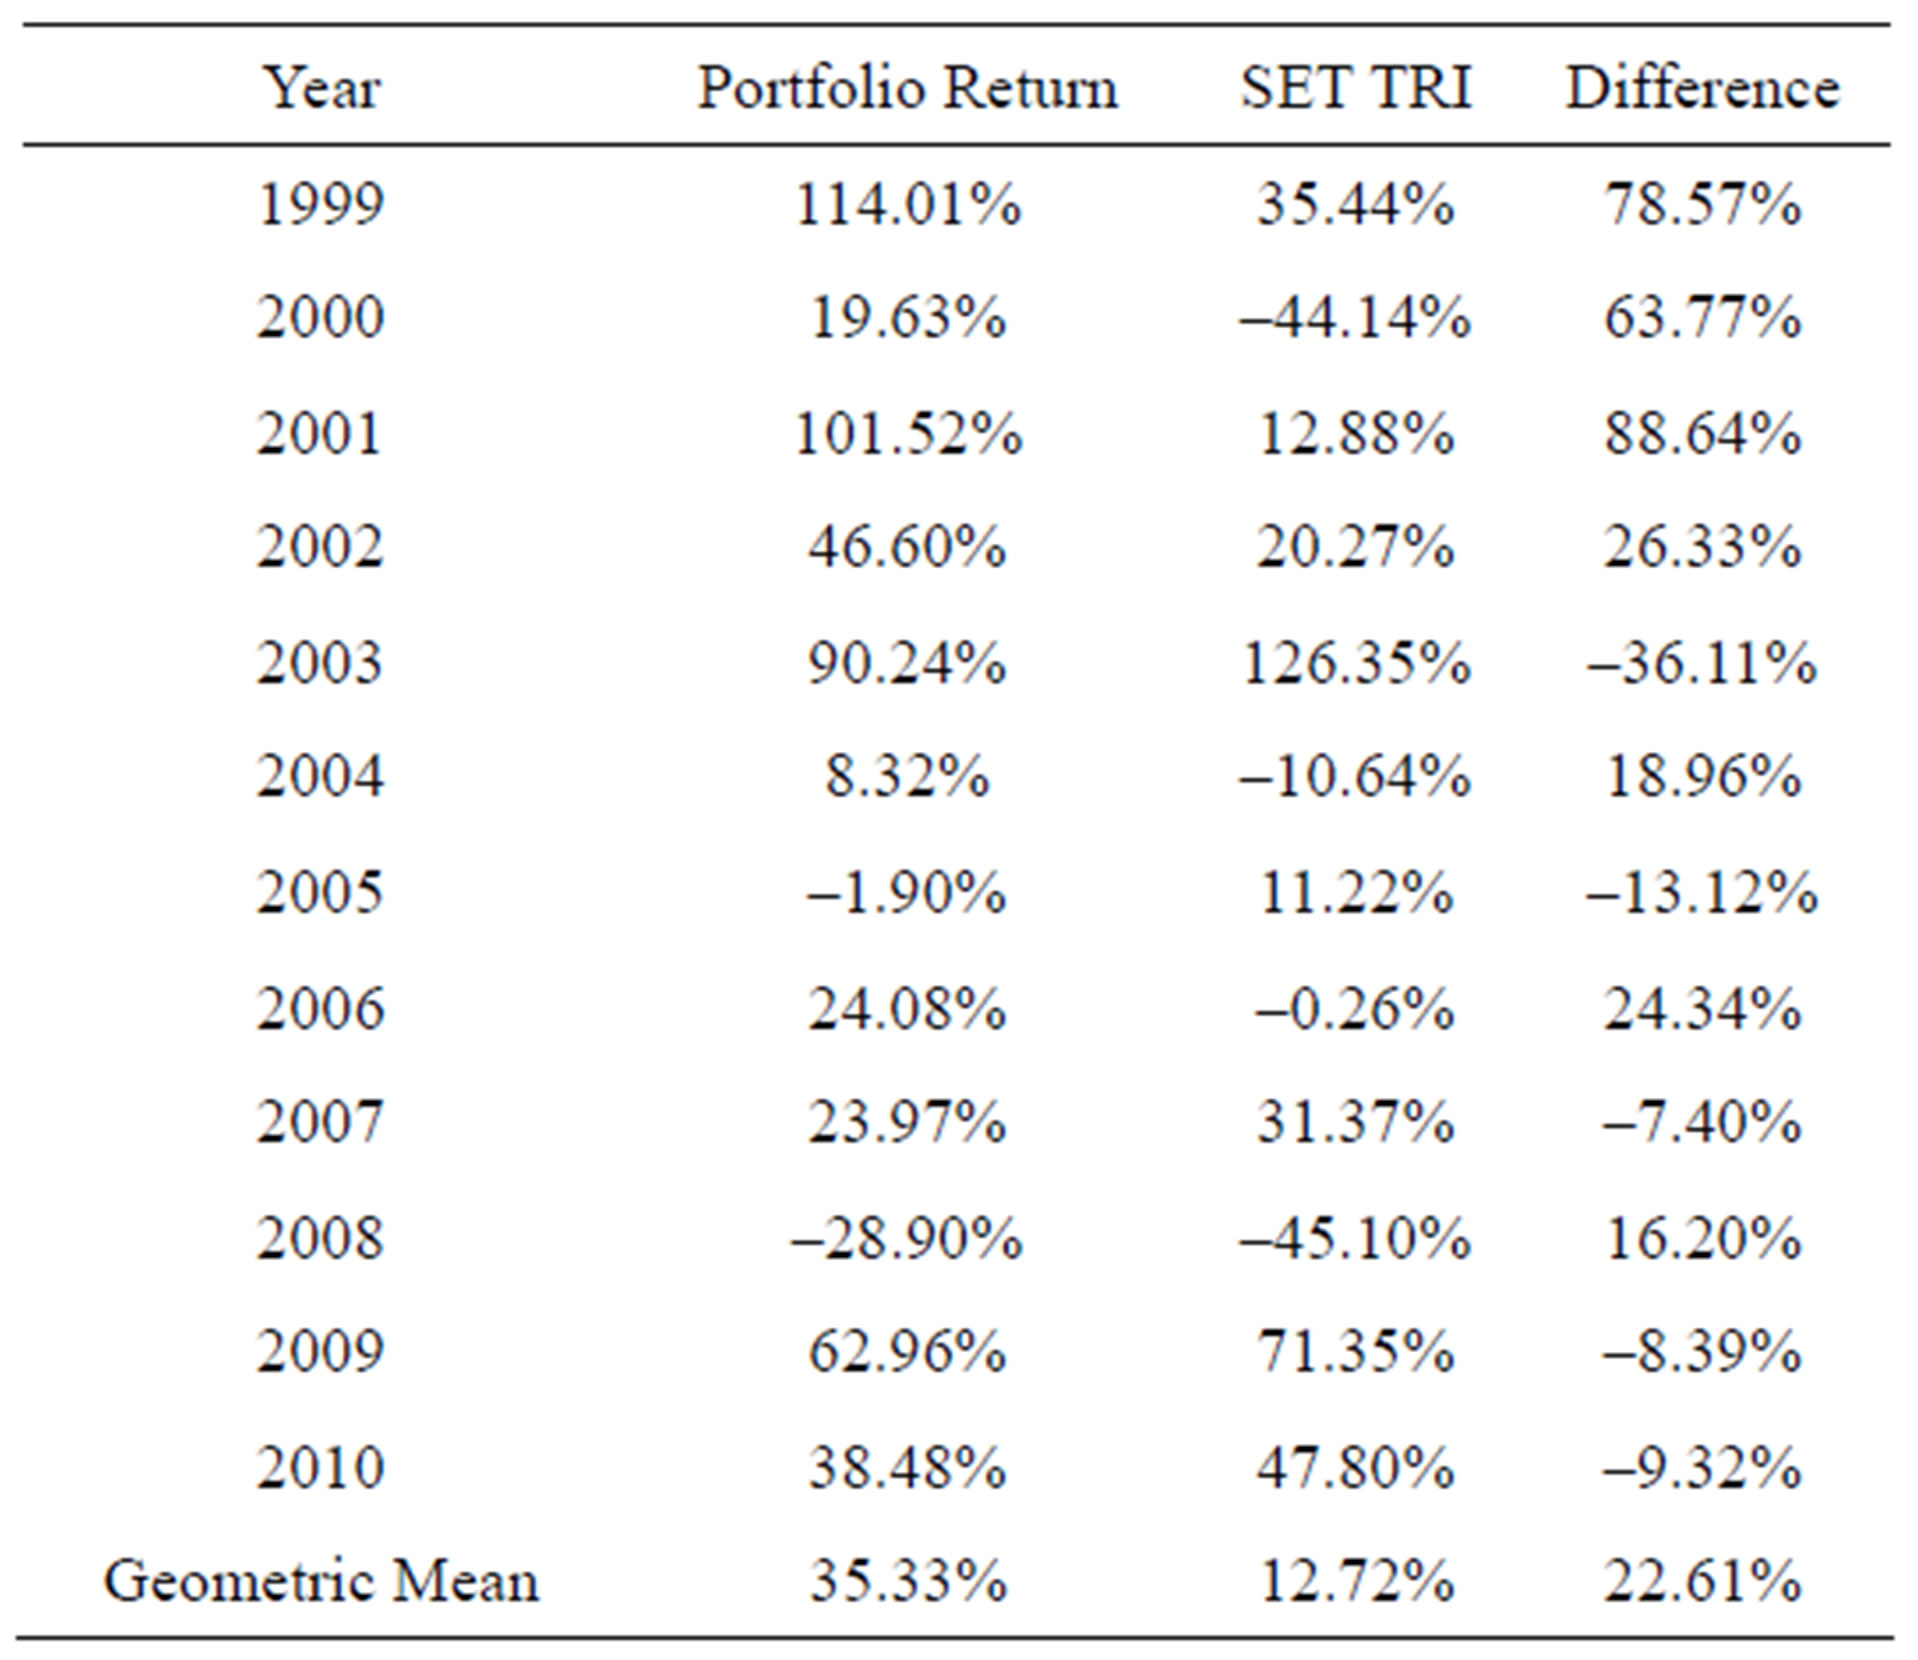
Table 5. Portfolio C’s returns compared to the market average.
exchange’s total return index in 7 years out of the total 12-year period, whereby the compound average of Portfolio C returns was 35.33% per annum and the compound average of the stock exchange’s returns was 12.72% per annum, corresponding to 22.61% difference.
Figure 3 shows the comparative added value of an investment in Portfolio C where it was assumed that initial investment was 1 million Baht in the beginning of 1999 for a period of 12 years. At the end of 2010, Portfolio C had a value of 37,736,520 Baht while the investment in total stocks of the stock exchange was valued at 4,209,448 Baht.
Table 6 shows the risk-adjusted returns of Portfolio C by calculating the Sharpe ratio of Portfolio C and com-
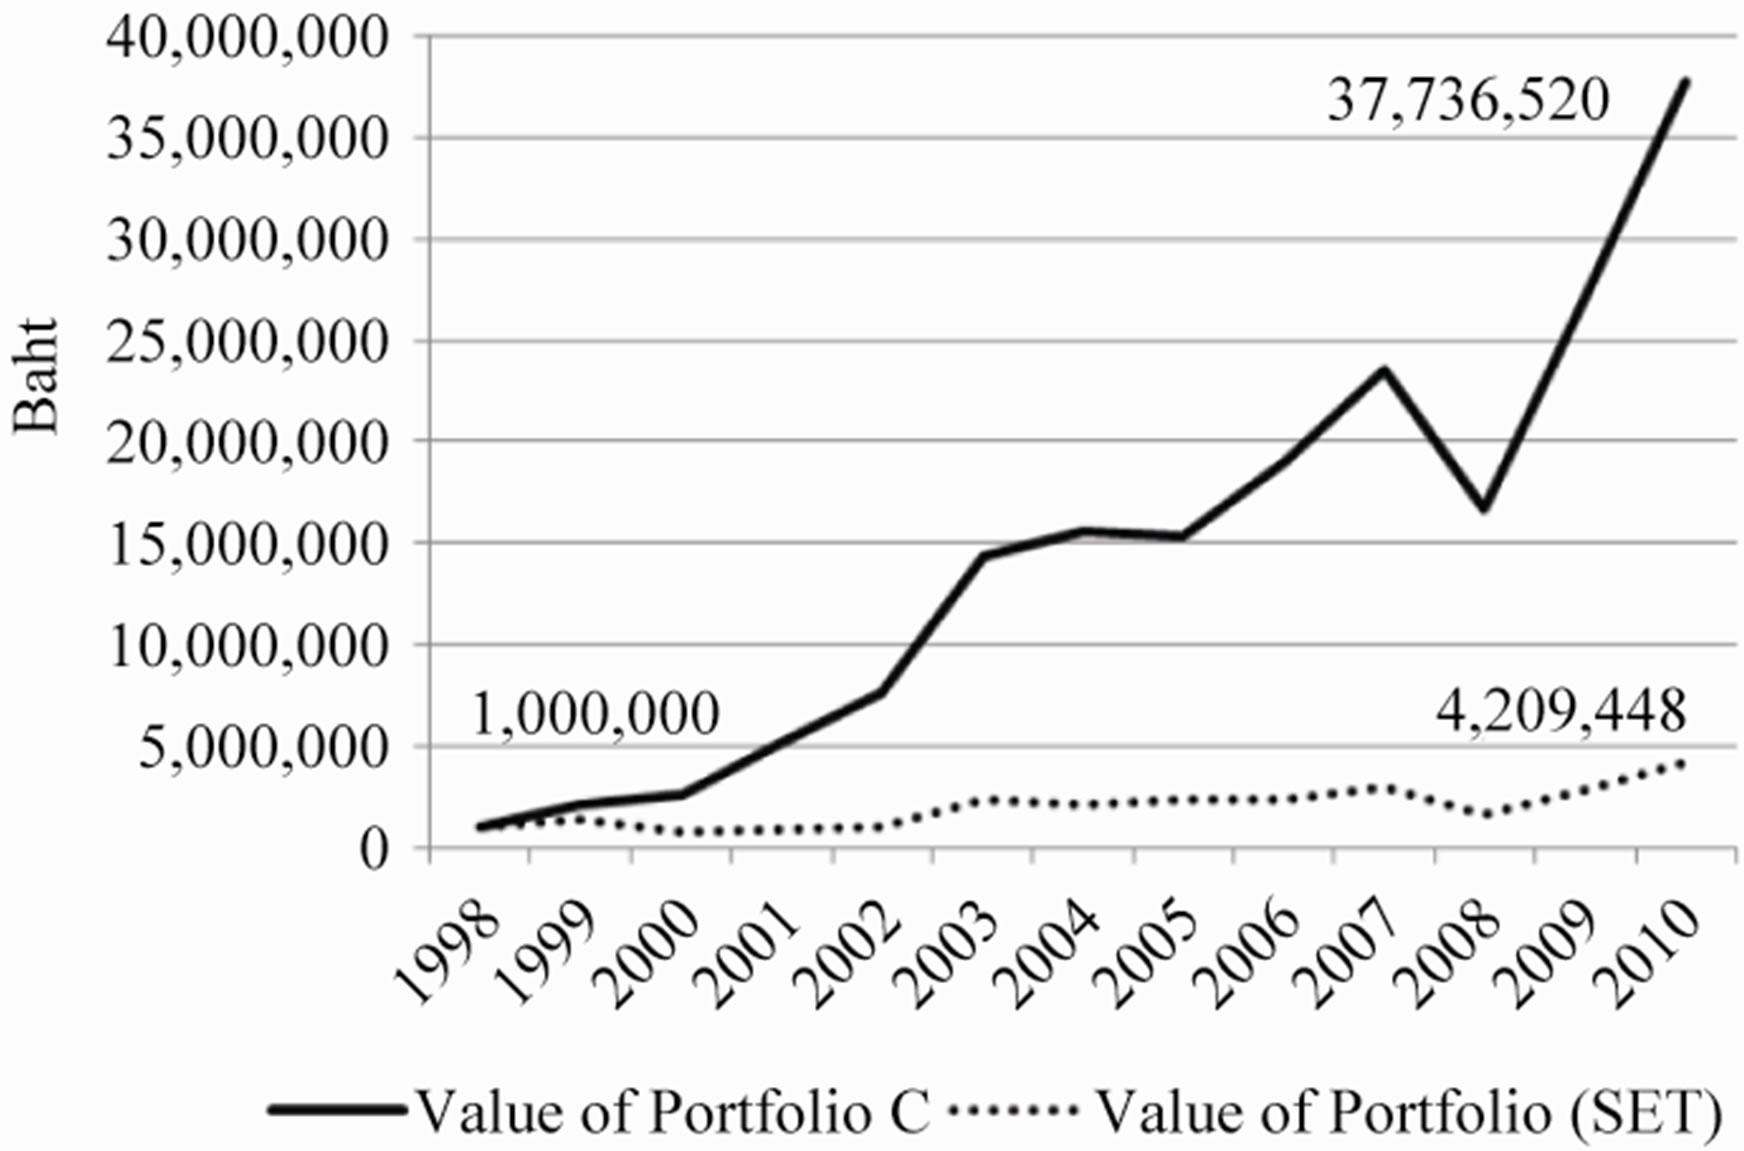
Figure 3. Portfolio values comparison.
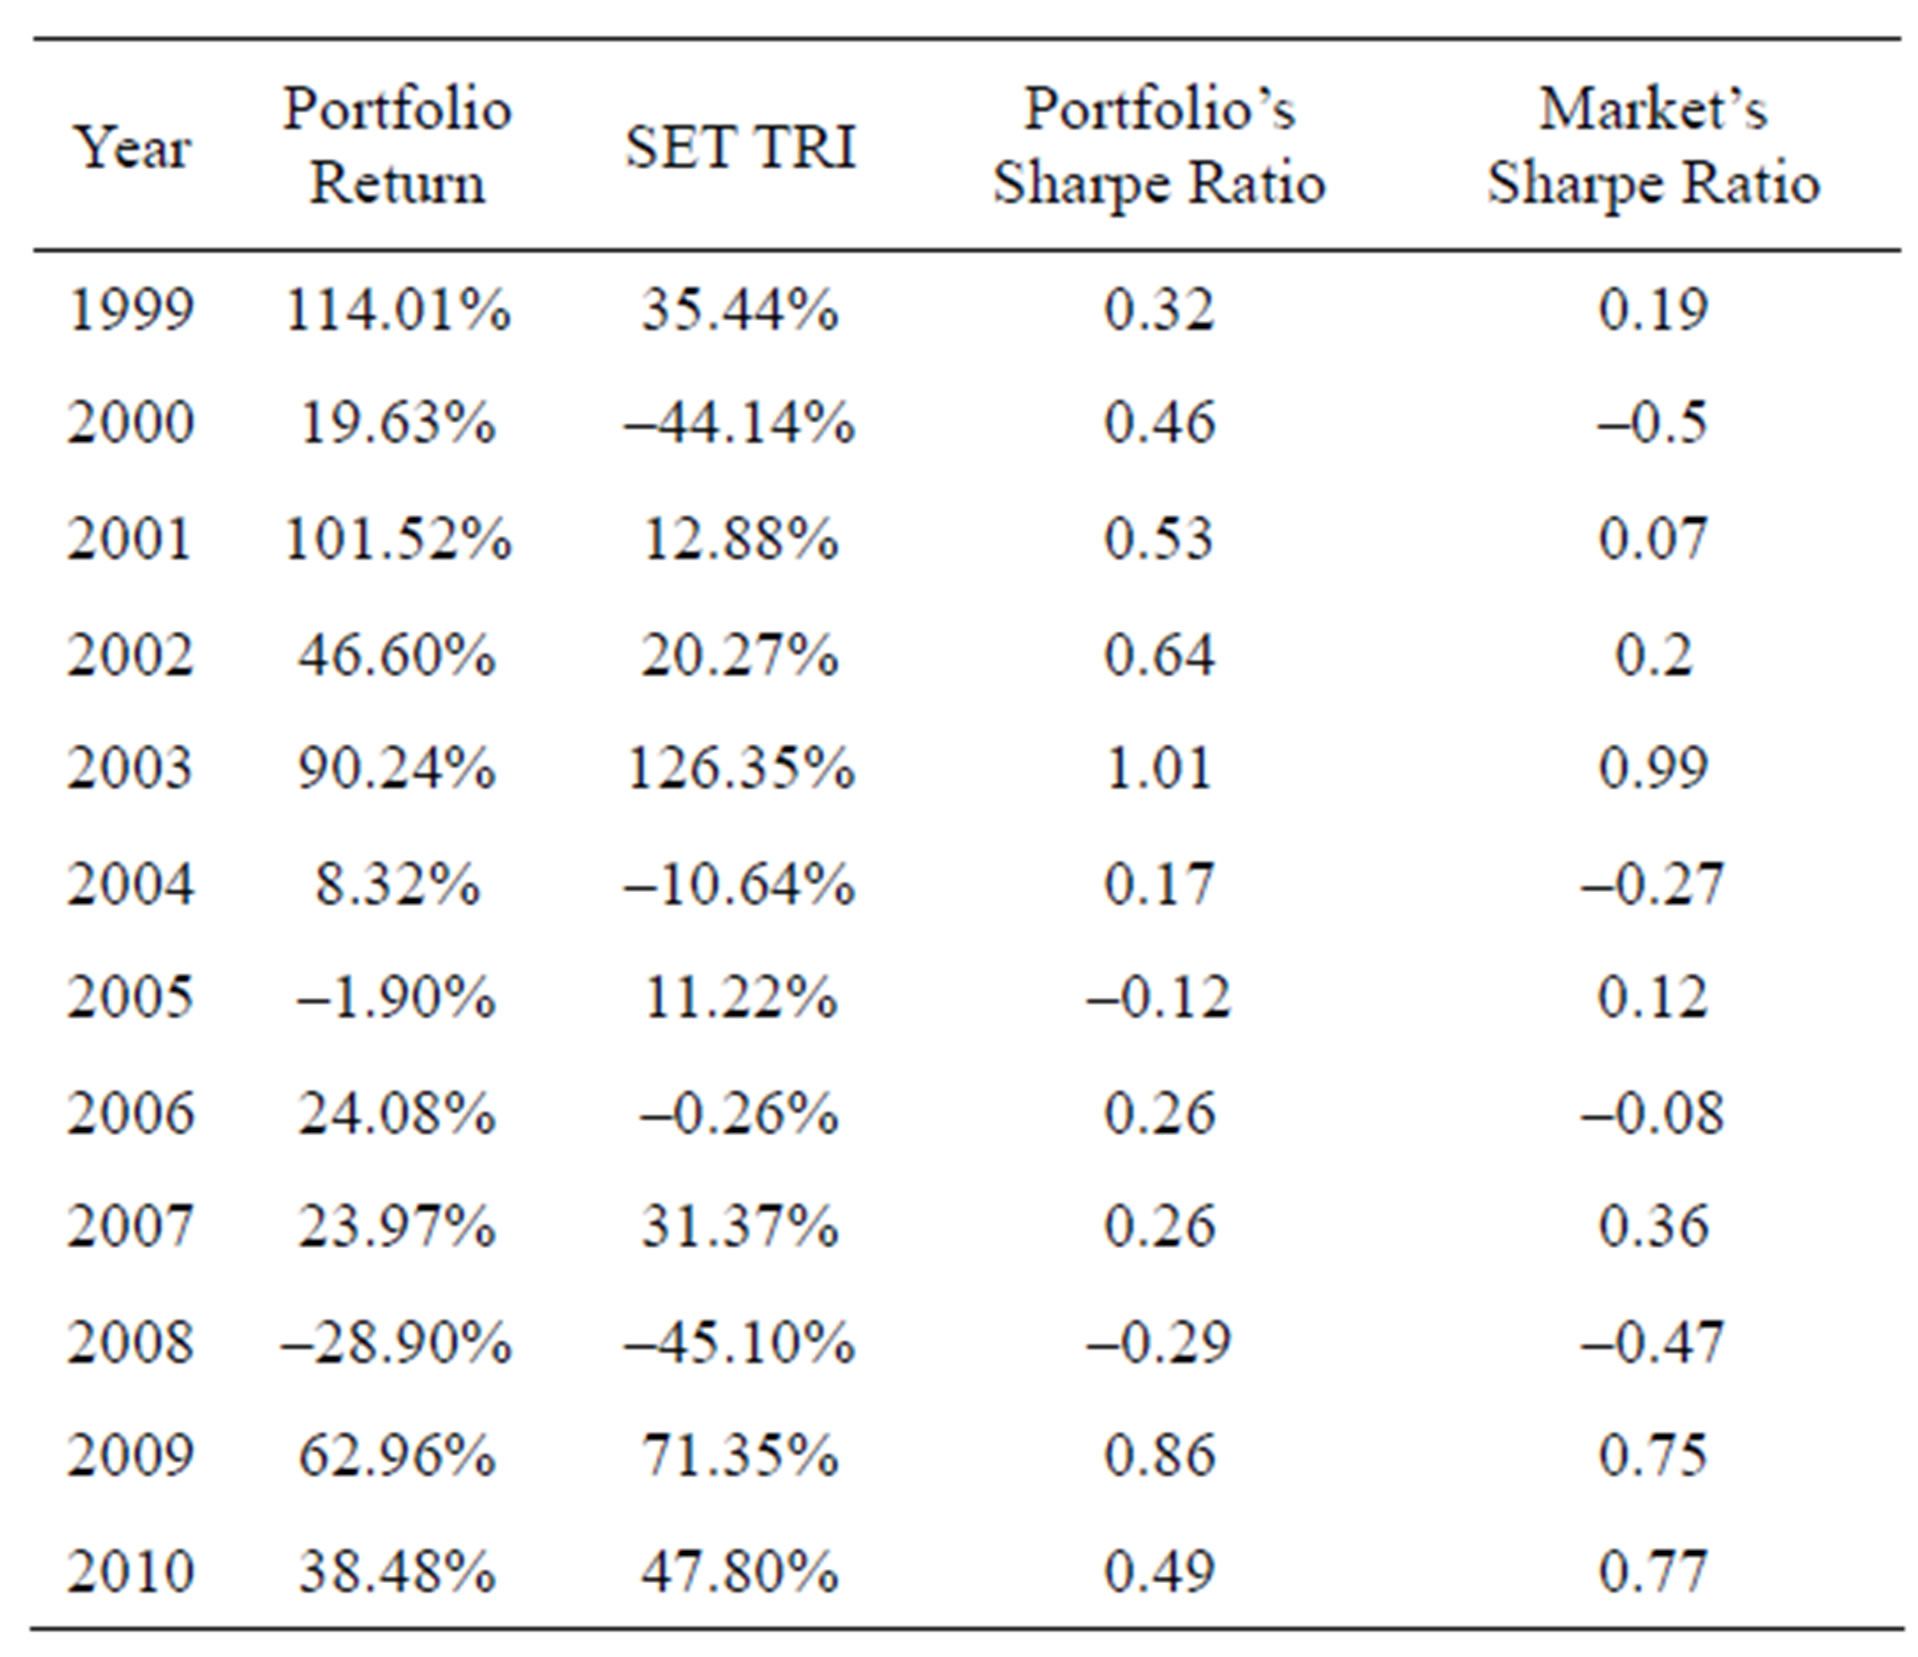
Table 6. Portfolio C’s sharpe ratio compared to the market’s sharpe ratio.
paring it with the Sharpe ratio of the SET TRI. It was found that Portfolio C had a higher Sharpe ratio in 9 years out of the 12-year period.
4.4. Portfolio D: Investing in 10 Stocks with the Lowest PEG Ratio Which Was Greater than 0
Table 7 shows the returns of Portfolio D, which consisted of 10 stocks with the lowest PEG ratio which was greater than 0 compared to the returns from the stock exchange’s total return index. Returns of Portfolio D were compared to those of the Stock Exchange of Thailand. It was found that Portfolio D generated higher returns than the stock exchange’s total return index in 8 years out of the total 12-year period, whereby the compound average of Portfolio D returns was 36.30% per annum and the compound average of the stock exchange’s returns was 12.72% per annum, corresponding to 23.58% difference.
Figure 4 shows the comparative added value of an in-
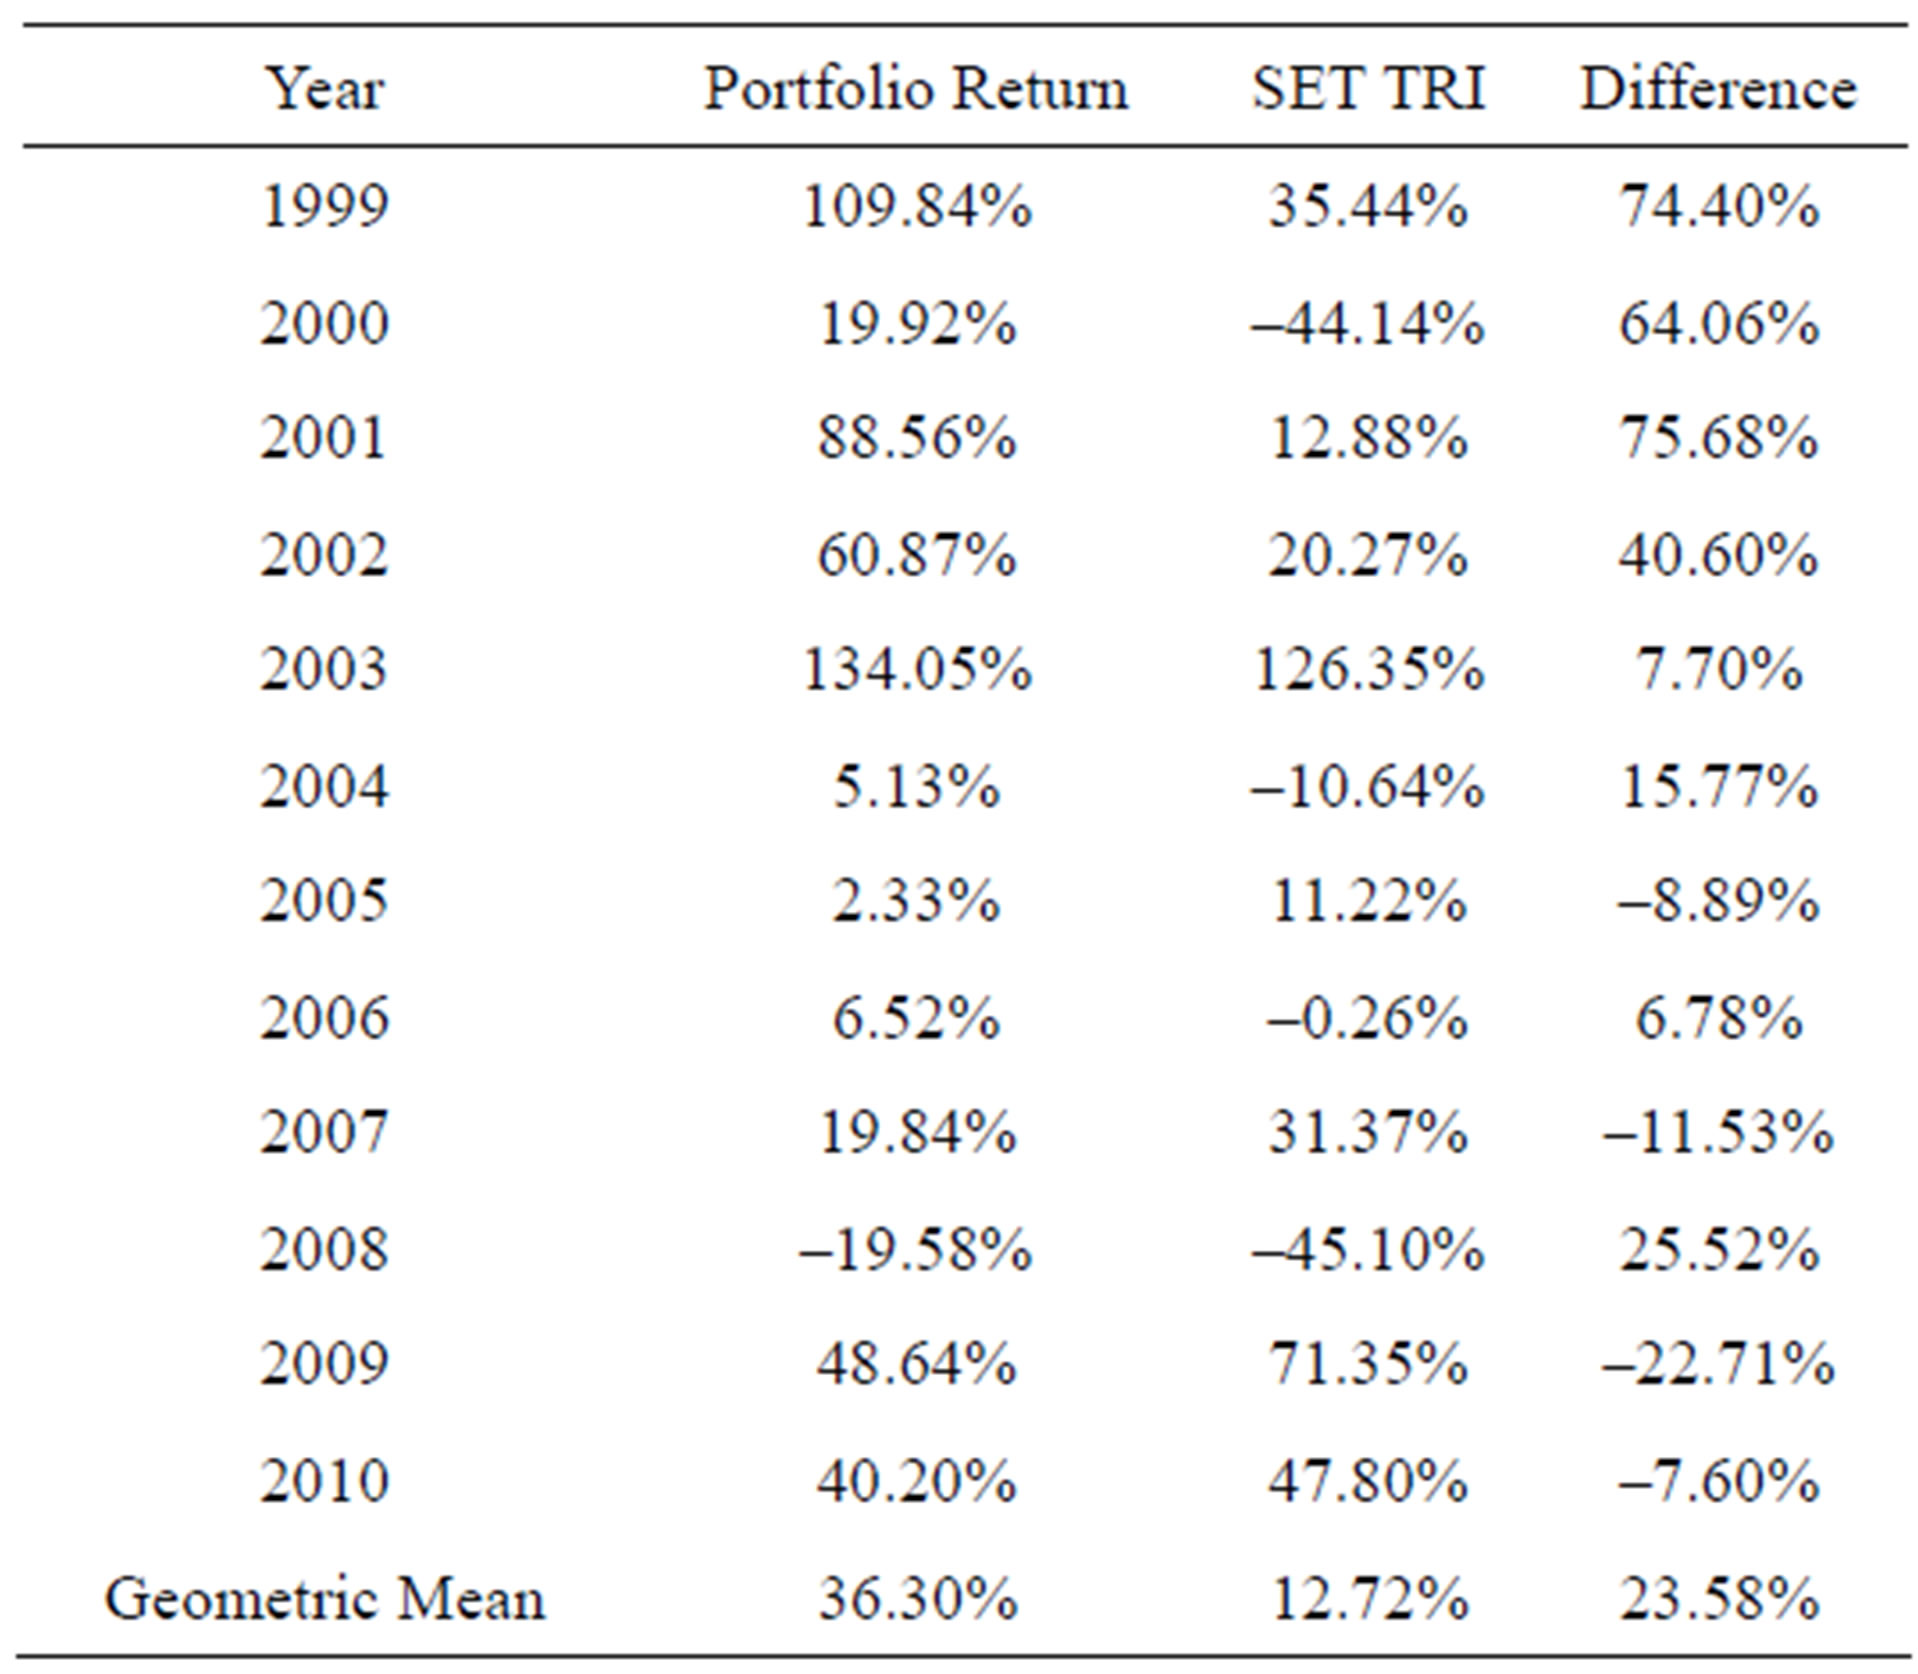
Table 7. Portfolio D’s returns compared to the market average.
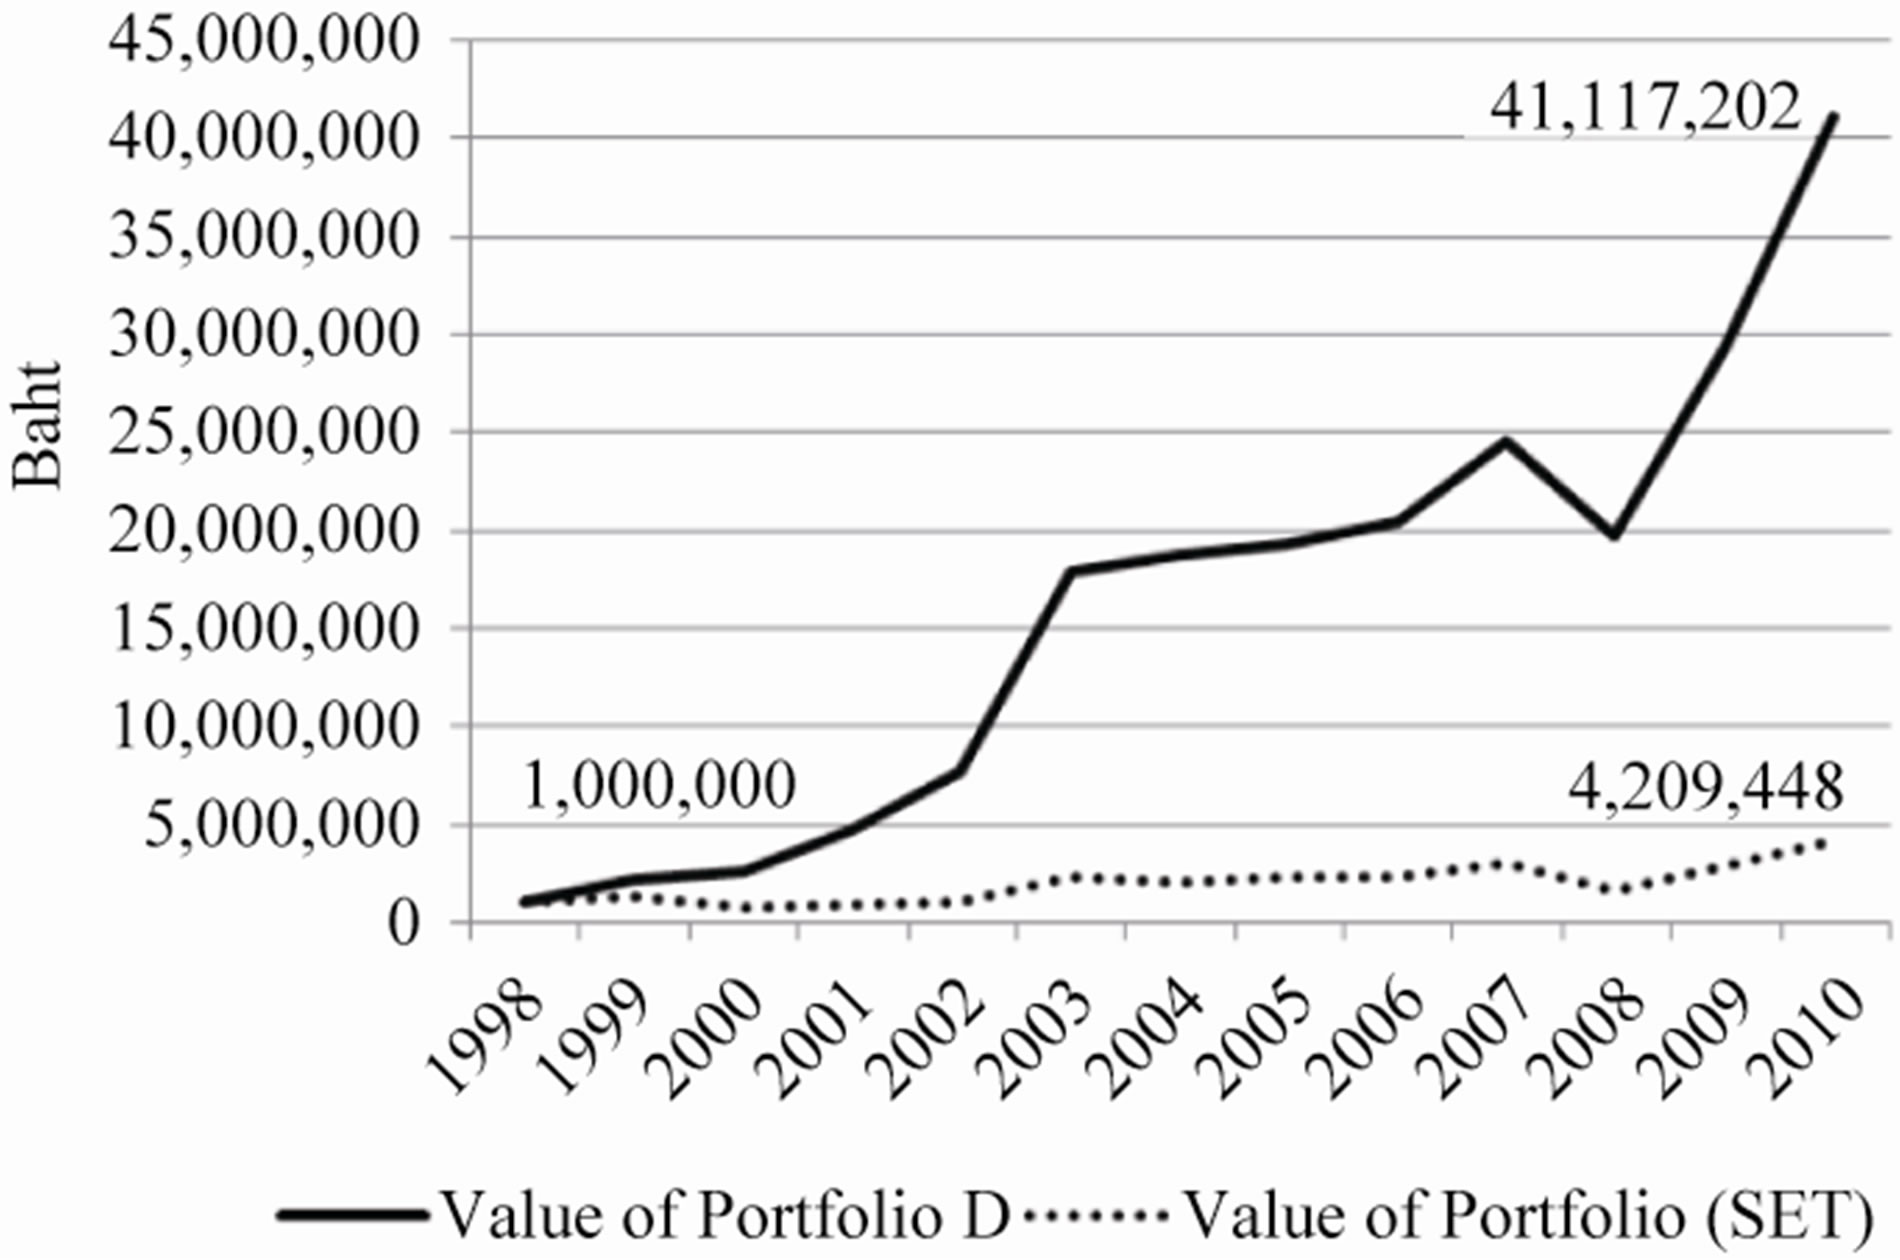
Figure 4. Portfolio values comparison.
vestment in Portfolio D where it was assumed that initial investment was 1 million Baht in the beginning of 1999 for a period of 12 years. At the end of 2010, Portfolio D had a value of 41,117,202 Baht while the investment in total stocks of the stock exchange was valued at 4,209,448 Baht.
Table 8 shows the risk-adjusted returns of Portfolio D by calculating the Sharpe ratio of Portfolio D and comparing it with the Sharpe ratio of the SET TRI. It was found that Portfolio D had a higher Sharpe ratio in 9 years out of the 12-year period.
Thus, the research output of the four investment plans reflected the efficiency of stock selection based on the PEG ratio, which was developed from the P/E ratio in combination with an earnings growth rate, that it could generate significantly higher returns than the returns from the stock exchange and thereby was capable of creating more wealth for investors in the long run. This made stock selection based on the PEG ratio another alPEG ratio, which was developed from the P/E ratio in combination with an earnings growth rate, that it could generate significantly higher returns than the returns from the stock exchange and thereby was capable of creating more wealth for investors in the long run. This made stock selection based on the PEG ratio another alternative investment strategy for investors who wish to integrate the concept of value investing with growth investing in the Stock Exchange of Thailand.
As compound rate of return and added value of investment in the four plans were analyzed, it was found that compound rate of return and added value of investment of Portfolio A, B, C and D increased respectively, as shown in Figure 5. In other words, investing in a portfolio with less number of stocks could generate higher returns; and it could also be interpreted that investing in stocks with PEG ratio approaching 0 could generate higher returns than the market and also higher
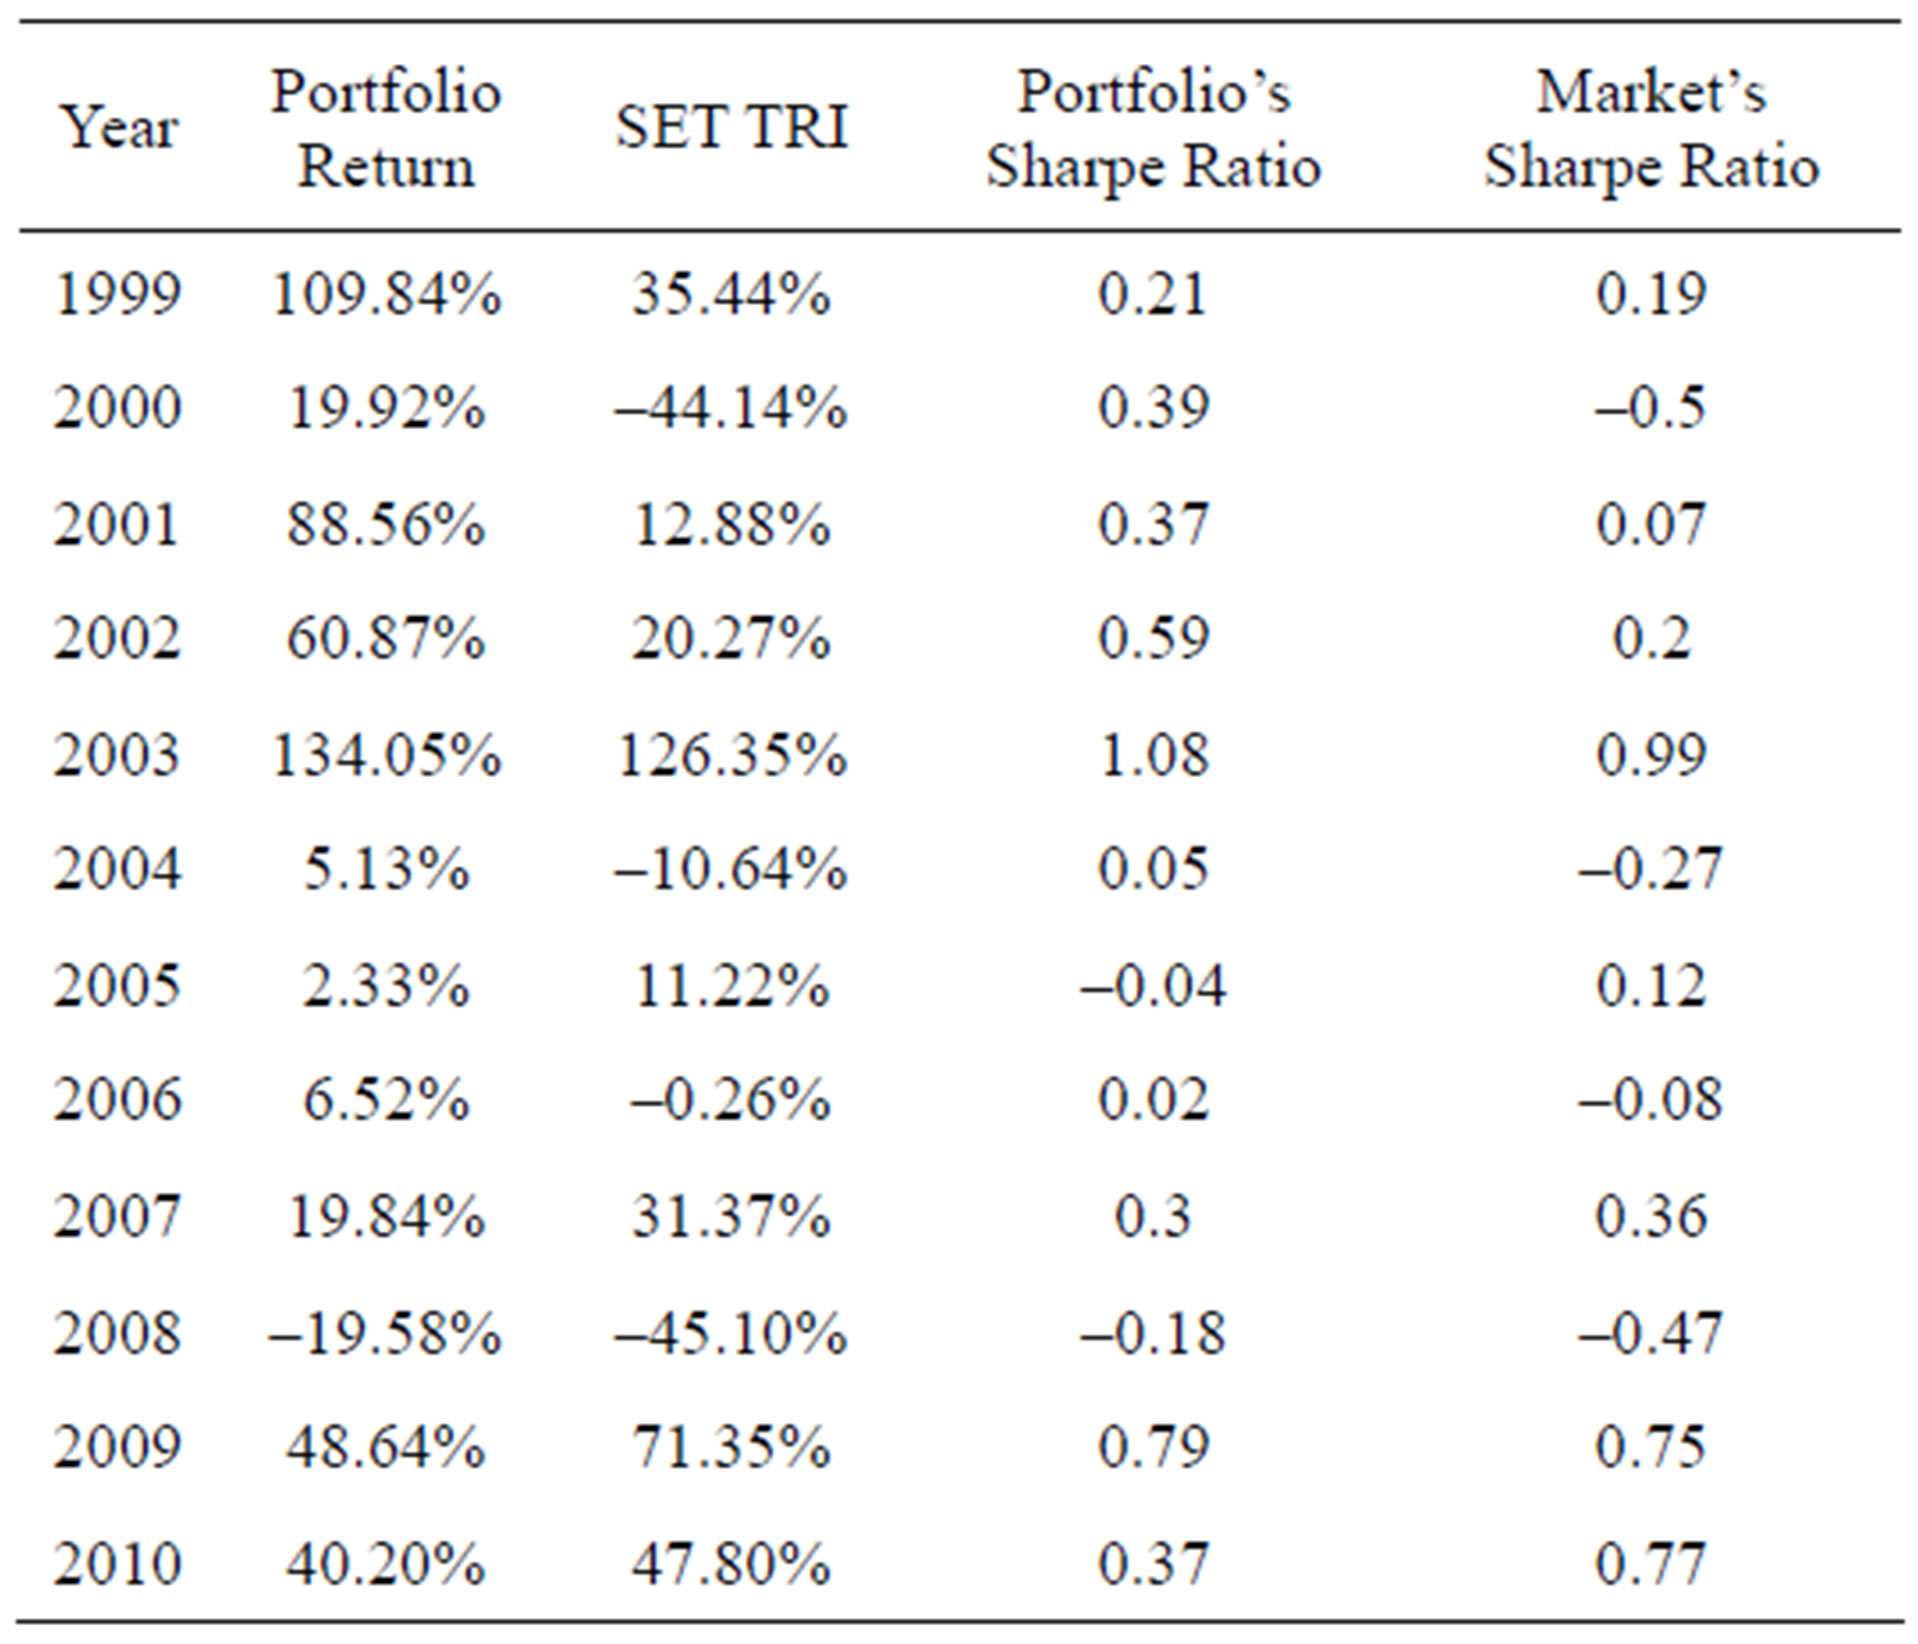
Table 8. Portfolio A’s sharpe ratio compared to the market’s sharpe ratio.
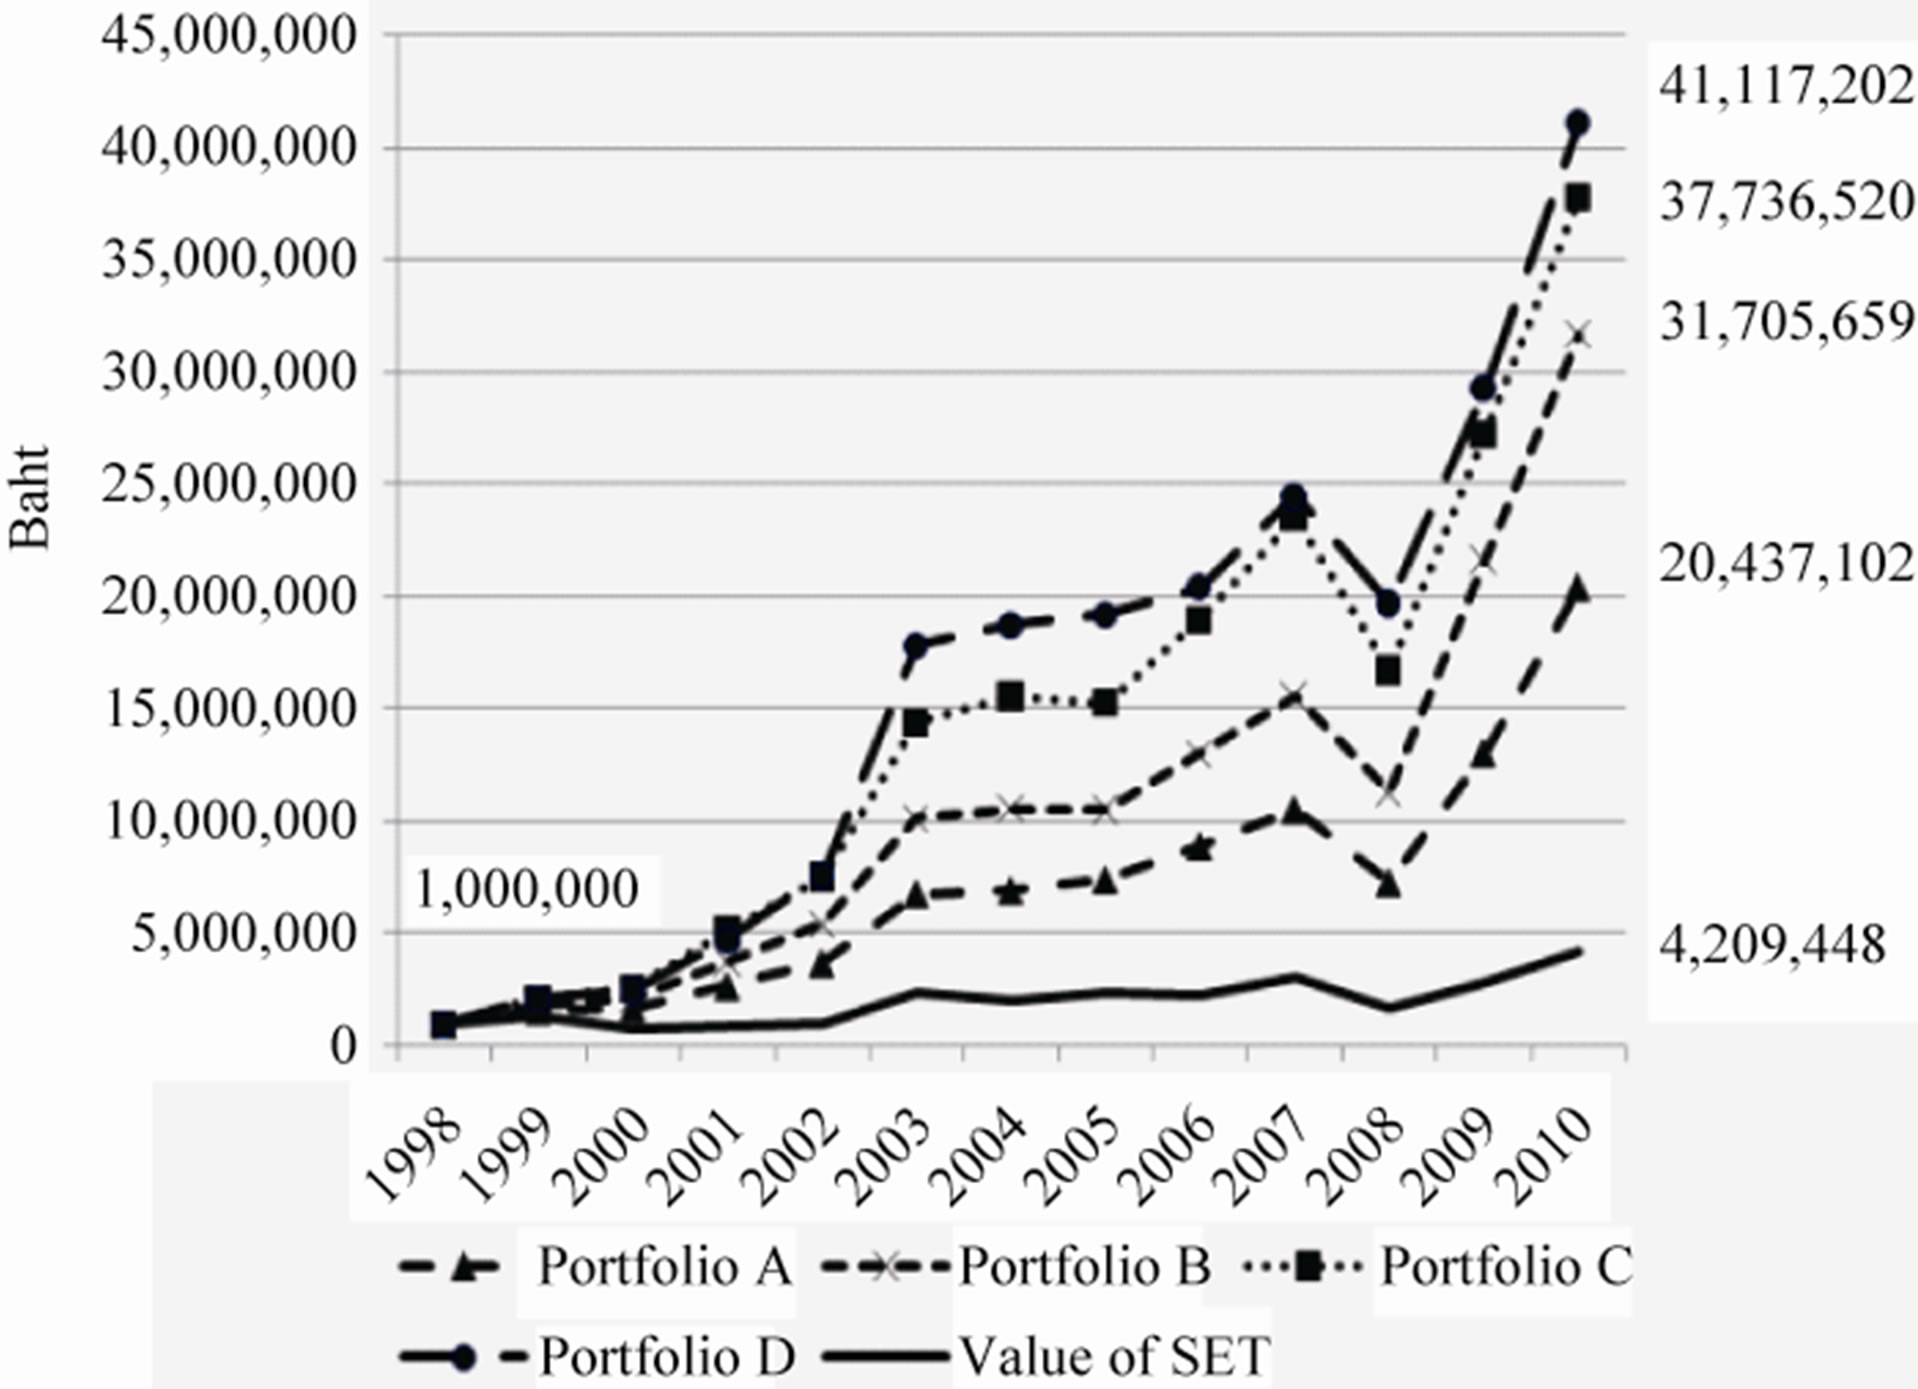
Figure 5. Portfolio values comparison.
returns than the stocks with higher PEG ratio.
Even though the selection of stocks with low PEG ratio might have generated higher returns compared to the stock exchange’s total return index or to the selection of stocks with high PEG ratio; the issue of investment risk was still a problem worth analyzing. From the study, it was found that the risk measured by the standard deviation of Portfolio A, B, C and D increased respectively, whereas the risk-adjusted return represented by the Sharpe ratio for Portfolio A, B, C and D decreased respectively. This revealed that, though the use of PEG ratio might be able to generate higher returns, selection of stocks with very low PEG ratio resulted in a small number of stocks and a higher portfolio risk than that of the portfolio with a large number of stocks. This might also be due to low PEG stocks having higher risk level.
5. Conclusions and Limitations
Value investing gained popularity as researches showed that various investment strategies based on this concept could generate significantly higher returns than the market average. In addition, there has been further development to recommend new investment strategies that are capable of generating greater returns by reducing the limitations of assumptions employed in traditional value investment strategies as seen in the stock selection methodology based on the PEG ratio. The PEG itself was developed from the investment strategy based on P/E ratio, and which was in popular use for a long time for screening out low quality stocks. Apart from its capability in reducing the limitations of P/E ratio, research also presented a proof that investment strategies based on PEG ratio could generate higher returns than strategies based on P/E ratio.
A test was conducted in this study to evaluate whether the investment strategy based on PEG ratio could be applied to the investments in the Stock Exchange of Thailand, using stock data from 1999-2010, the type that the public could access. The results showed that PEG ratio was effective in generating higher returns than the stock exchange’s total return index throughout the analysis of 12-year research data.
The study result also showed that portfolio returns would increase if the stocks with high PEG ratio were removed and only the stocks with low PEG ratio were left. This reflected the efficiency of PEG ratio in generating significantly higher returns than the market. Though risk factors were included in the consideration, the result remained the same.
However, the risk factors are still an important issue which should be studied further to clearly explain whether the cause of the increase in investment returns based on PEG ratio was due to a compensation for the increased risk of this investment strategy. The use of PERG ratio, which directly included risk factors in the calculation, might be another alternative in solving this problem, whereby the PERG ratio might consequently become a strategy that allowed Thai investors to generate returns which continually exceeded those of the market on the basis of acceptable risks.
Apart from the aforementioned, it should be pointed out that this study covered only a period of collection of the stock exchange’s total return index data i.e. during 1999-2010, making it impossible to study with a long enough period of investment. This, together with a small number of stocks of the Stock Exchange of Thailand compared to stock exchanges in developed countries, resulted in the lack of liquidity in some stocks being selected, which made it impossible to invest in practice. Further studies should be conducted in order to reduce the limitations of the data, whereby the study should cover longer investment term in order to experience diverse investment market conditions. Such study may be divided into 2 sub-periods covering market upturn and downturn to find out which type of market condition the investment strategy based on PEG ratio can be applied.
All in all, despite the limitations, the empirical results found in this study imply that the Stock exchange of Thailand is inefficient, so that abnormal returns could be obtained by using public information and such a basic stock selection technique as PEG. Thus, investors may adopt this stock-selecting approach for effective investment.
REFERENCES
- B. Graham, “The Intelligent Investor,” Revised Edition, HarperCollins, New York, 2003.
- J. D. Schatzberg and G. Vora, “PEG Investing Strategy: A Revisit,” Quarterly Journal of Finance and Accounting, vol. 48, no. 2, 2009, pp. 5-22.
- A. Robichek and M. Bogue, “A Note on the Behavior of Expected Price/Earnings Ratios over Time,” Journal of Finance, vol. 26, no. 3, 1971, p. 731. doi:10.1111/j.1540-6261.1971.tb01726.x
- R. Banz, “The Relation between Return and the Market Value of Common Stocks,” Journal of Financial Economics, vol. 9, no. 1, 1981, pp. 3-18. doi:10.1016/0304-405X(81)90018-0
- M. Reinganum, “Misspecification of Capital Asset Pricing: Empirical Anomalies Based on Earnings Yields and Market Values,” Journal of Financial Economics, vol. 9, no. 1, 1981, pp. 19-46. doi:10.1016/0304-405X(81)90019-2
- E. F. Fama and K. R. French, “Common Risk Factors in the Returns on Stocks and Bonds,” Journal of Financial Economics, vol. 33, no. 1, 1993, pp. 3-56. doi:10.1016/0304-405X(93)90023-5
- M. Grinblatt, and S. Titman, “Financial Markets and Corporate Strategy,” 2nd Edition, McGraw-Hill, New York, 2001.
- J. Gomes, L. Kogan and L. Zhang, “Equilibrium Cross Section of Returns,” Journal of Political Economy, vol. 111, no. 4, 2003, pp. 693-732. doi:10.1086/375379
- E. F. Fama and K. R. French, “Multifactor Explanations of Asset Pricing Anomalies,” Journal of Finance, vol. 51, no. 1, 1996, pp. 55-84. doi:10.2307/2329302
- R. Petkova and L. Zhang, “Is Value Riskier than Growth?” Journal of Financial Economics, vol. 78, no. 1, 2005, pp. 187-202. doi:10.1016/j.jfineco.2004.12.001
- J. Lakonishok, A. Shleifer and R. W. Vishny, “Contrarian Investment, Extrapolation, and Risk,” Journal of Finance, vol. 49, no. 5, 1994, pp. 1541-1578. doi:10.2307/2329262
- C. C. Holt, “The Influence of Growth Duration on Share Prices,” Journal of Finance, vol. 17, no. 3, 1962, pp. 465-475. doi:10.2307/2977053
- B. Malkiel, “Equity Yields, Growth, and the Structure of Share Prices,” American Economic Review, vol. 53, no. 5, 1963, pp. 1004-1031.
- Z. Sun, “The PEG Ratio and Stock Valuation,” The University of Toronto, Toronto, 2001.
- P. Easton, G. Taylor, P. Shroff and T. Sougiannis, “Using Forecasts of Earnings to Simultaneously Estimate Growth and the Rate of Return on Equity Investment,” Journal of Accounting Research, vol. 40, no. 3, 2002, pp. 657-676. doi:10.1111/1475-679X.00066
- P. Easton, “P/E Ratios, PEG Ratios, and Estimating the Implied Expected Rate of Return,” The Accounting Review, vol. 79, no. 1, 2004, pp. 73-75.
- J. Estrada, “Adjusting P/E Ratios by Growth and Risk: The PERG Ratio,” IESE Business School, Barcelona, 2005.
- N. Hemwachirawarakorn and P. Intara, “Value Investment and Returns in Thai Market,” NIDA Business Journal, vol. 5, no. 5, 2009, pp. 77-90.
- S. Supattarakul and P. Jongjaroenkamol, “The Determinants of Price-to-Book Value (P/B) and Price-to-Earnings (P/E) Ratios Based on the Residual Income Model,” Thammasat Business Journal, vol. 125, 2010, pp. 7-31.
- P. Sareewiwatthana, “Value Investing in Thailand: The Test of Basic Screening Rules,” International Review of Business Research Papers, vol. 7, no. 4, 2011, pp. 1-13.
- N. Maneesilasan, “GARP Investing in Thailand,” Working Paper, National Institute of Development Administration, Bangkok, 2011.
- W. Sharpe, “Capital Asset Price: A Theory of Market Equilibrium under Conditions of Risk,” Journal of Finance, vol. 19, no. 3, 1964, pp. 425-442.
NOTES
*The author would like to thank Dr. Attapol Arunwutipong, Phasin Wanidwaranan and Niparporn Thampatpong for their support in collecting data, testing the hypotheses and editing the paper.
1Value stocks are stocks with market price lower than the fair value of the company (undervalued) as assessed based on fundamental factors, e.g., dividends, sales, profits, etc. Investors who are interested in this category of stocks, called value investors, share a common viewpoint that stock exchange is inefficient, and as a consequence, profit could be generated from deviation of stock price. They believe that the stock price will eventually reflect the intrinsic value of the company. Stocks in this category have common characteristics of high dividend ratio, low P/E ratio, and low P/B ratio.
2Growth stocks are stocks of companies, which are expected to perform well above the average, yielding higher growth rate in earnings. Companies in this category usually do not pay dividends, as they prefer to use the retained earnings to invest in expanding fast-growing business. Expectation for the good future of such company causes the stock to be sold at a price higher than fair value (overvalued). Growth stocks are also known as Glamour stocks.
3PERG is a result of the development of PEG ratio by taking risk factor (beta) into consideration. It was originated from Javier Estrada’s [17] observation on stock selection based on PEG ratio with regard to the decision in case stocks had the same PEG ratio but different risk levels. Lower PERG ratio indicates that stock price is more appropriate when considered based on growth potential and risk.
4In most studies, the earnings per share (EPS) for the period of the last 4 quarters or 12 months was used, but in reference to company’s earnings, analysts might use different numbers from the financial statements such as net income, earnings before interest, taxes and depreciation (EBITDA), as well as other forms of company’s earnings.
5Sharpe ratio is a ratio developed by William F. Sharpe [22] that is used in analyzing the risk-adjusted returns. This makes it possible to compare returns on investment to make sure that the excess return is not due to increased risk. The higher Sharpe ratio indicates the higher investment efficiency. The value can be obtained as follows:
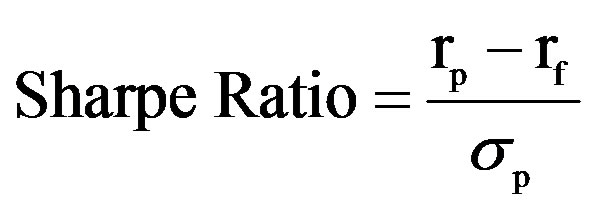
rp = portfolio’s expected rate of return;
rf = rate of return on a risk-free asset (based on a 10-year government bond in this case);
σp = standard deviation of the portfolio’s rates of return.