Technology and Investment
Vol.1 No.2(2010), Article ID:1763,17 pages DOI:10.4236/ti.2010.12015
Petrochemical Industry: Assessment and Planning Using Multicriteria Decision Aid Methods
1Faculty of Chemistry, National University of Mexico, Mexico City, Mexico
2Solvay School of Business Administration, Université Libre de Bruxelles, Brussels, Belgium
E-mail: carloset@servidor.unam.mx
Received November 28, 2009; revised December 17, 2009; accepted December 18, 2009
Keywords: Multiple criteria analysis, Multilevel planning, Network flows, Linear and Integer programming, Petrochemical Industry assessment
Abstract
A methodology to solve a large and complex problem is proposed. OR methods as Multilevel Planning, Network Techniques, Multicriteria Decision Aid (MCDA) and Mixed Integer Linear Programming (MILP) were used to structure the methodology. One of the principal objectives of this work is reduce the complexity of a large problem and solve it to find the better solution for the decision makers. The methodology is applied to a petrochemical industry of Mexico, which is structured in a network, having different alternative routes of production; each of them having also a different technology. This network begins from the crude oil as raw material in order to produce the basic petrochemicals until finals ones. It has been considered that basic petrochemicals will be produced through a set of Refineries with a high production of basic petrochemicals yield, searching the best configuration among it, according with the needs of basic petrochemicals coming from the final’s and its best route selected.
1. Main Objectives and Goals: Description of the Work
The targets to be reached in this work are:
a) To reduce the complexity of a large system using a model of coordination in a framework of decentralized multilevel planning with a lot of interrelated subsystems.
b) To structure a methodology with different operational research (OR) tools, as Network Techniques, MCDA (PROMETHEE II and V methods) and MILP, according with the problem stated.
c) To apply the methodology to the Mexican petrochemical industry as a case study, with a horizon planning starting in 2003 until 2025 and taking into account the demand of each final petrochemical as an exogenous variable.
As particular objectives:
d) Considering that the model must start with the crude oil as raw material and end with the final petrochemicals, the methodology will be able to choose the best technology process alternative from a set of them to produce final petrochemicals.
e) Another part of the model will be developed in order to show the final petrochemicals production from crude oil, is at least equally competitive than the exportation of it. The value of the Mexican crude oil exportation will be the reference of comparison.
f) The feasibility to produce petrochemicals with more added value than exporting only crude oil will be showed.
2. Mathematical Tools to be Utilized in the Methodology
2.1. Coordination Models
A lot of work have been done in this field; see references as [1-3,5,14,15,17,18,22, 24-26,36,38].
2.2. Network Approach
Chavez has used PASCAL to build a graphical linked data structure, with the nodes representing the chemicals and processes [13], and arcs indicating the relations between them. Then, through recursive programming, the procedure could traverse the graph both up-and downstream to observe the affects of any perturbations. In this manner it is possible to examine the process individually, within the context of the industry, rather than observing all of the process as a single unit. This removes the tendency (found in LP formulations) to operate one section of the industry sub optimally in order to improve some industry-wide objective function. For the Mexican Petrochemical Industry, Escobar and Rodriguez have used the same approach, focusing it to increment the added value along the chain of production [16].
The “traversing the arcs” algorithm can be expressed mathematically as the Generalized Network Problem (GNP) [37]:
From GNP, we will only use the following constraints:
Let xij = the amount of flow over arc (i, j) during the planning horizon.
Then a generalized network model is:
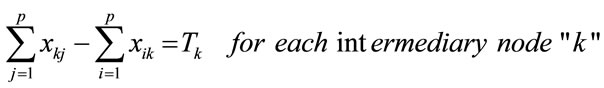 (1)
(1)
where: Tk is the flow value at each node k.
We will consider as Si the production capacity of a petrochemical plants i, (i = 1,2,…m) and there are n different final products whose annual demand is known as Dj for each product j (j = 1,2,…n). For different petrochemical plants and aij indicates the corresponding relative production efficiencies (input/output), i.e. the real stoichiometric coefficients of chemical reactions described in the network.
Then we have the following additional constraints:
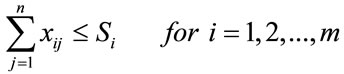 (2)
(2)
and,
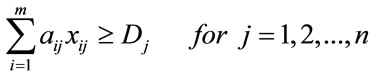 (3)
(3)
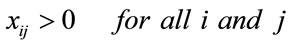 (4)
(4)
Constraint (3) is the driven force for this network, because it induces the production of any product in the network trough the exogenous demand.
2.3. MCDA Methods
We don’t discuss here the importance of Multicriteria Methods; a lot of bibliography is available to the interested lector. See: [6,7,9-13,27, 29-32,36] among others.
One of the more important methods of this kind is the PROMETHEE family. [6,8]
The PROMETHEE II complete ranking is based on net flow  that is computed from the pair wise comparison.
PROMETHEE V will be used to determine the production of the refinery, and to choice the better configuration.
The followed steps will be used to apply PROMETHEE V:
Step 1: The multicriteria problem is considered first, without constraints. In our case, we have utilized PROMETHEE II results; the rankings are obtained and the net flows for the best technological routes for each final petrochemical have been computed as also the subset of the best final petrochemicals, using the same criteria to choose the technological routes.
Step 2: The following mixed integer linear program could be considered in order to take into account additional constraints.
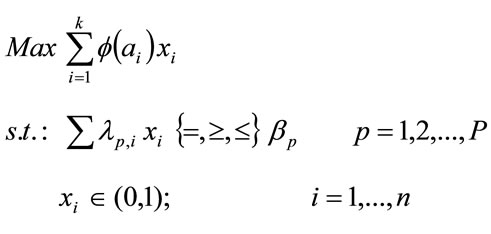 (5)
(5)
where  and
and  are coefficients and right hand sides associated to the constraints.
The coefficients of the objective function are the net outranking flows.
3. A Technology Evaluation Model
The model is supported by Ackoff´s interactive planning theory [39,40] and by Rudd and Watson [33] with the multilevel attack on very large problems.
Nevertheless, the evaluation model is completed using MCDA, network and mixed integer linear (MILP) techniques, in order to choose the better alternatives of a large and complex problem. The case study is a complex problem considering different combinations in order to produce a final product.
This model serves as a focus for bringing together the results of the formulation of the mess and ends planning with technology choice as it relates to various activities along of the whole industry’s added value chains. [19,23]
Figure 1 show a simple example of a complex problem, which is characterized by two levels (upper and lower) of coordination. In the lower level are the different subsystems linked with both, another subsystem and with the upper level, who is the coordinator. It is clear that should have a flow of data among some coordination variables in order to make the better decisions to solve the problem jointly. It looks like simple but it does not.
It is important define that each:
• local decision unit represent a set of processes to produce a final product from a set of raw materials
• process is structured for a sequence of intermediate process or chains of production or process’ routes
• chain of production is a technology to be assessed.
Also
• The raw material for each process unit is transformed to intermediate product; which is the new raw material for next process and;
• Each final product has been selected by a marketing study being its demand an exogenous variable of the problem.
In consequence, the complexity of the problem is increased. Nevertheless, using a mixed methodology, the problem can be solved. This methodology is divided in three large steps, taking them as iterations. See Figure 2.
The first and the second iteration represent the upper and lower level of coordination showed in Figure 1; in Figure 2 are represented by steps 1 to 6. Once the results are obtained from the first and second iteration, step 7 is performed and step 8 (MILP model) is developed. The results are then sent to the central unit in order to make the better decision.
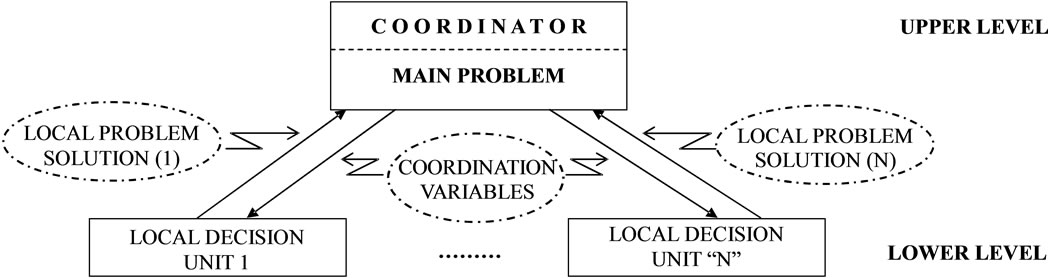
Figure 1. A two level attack structure.
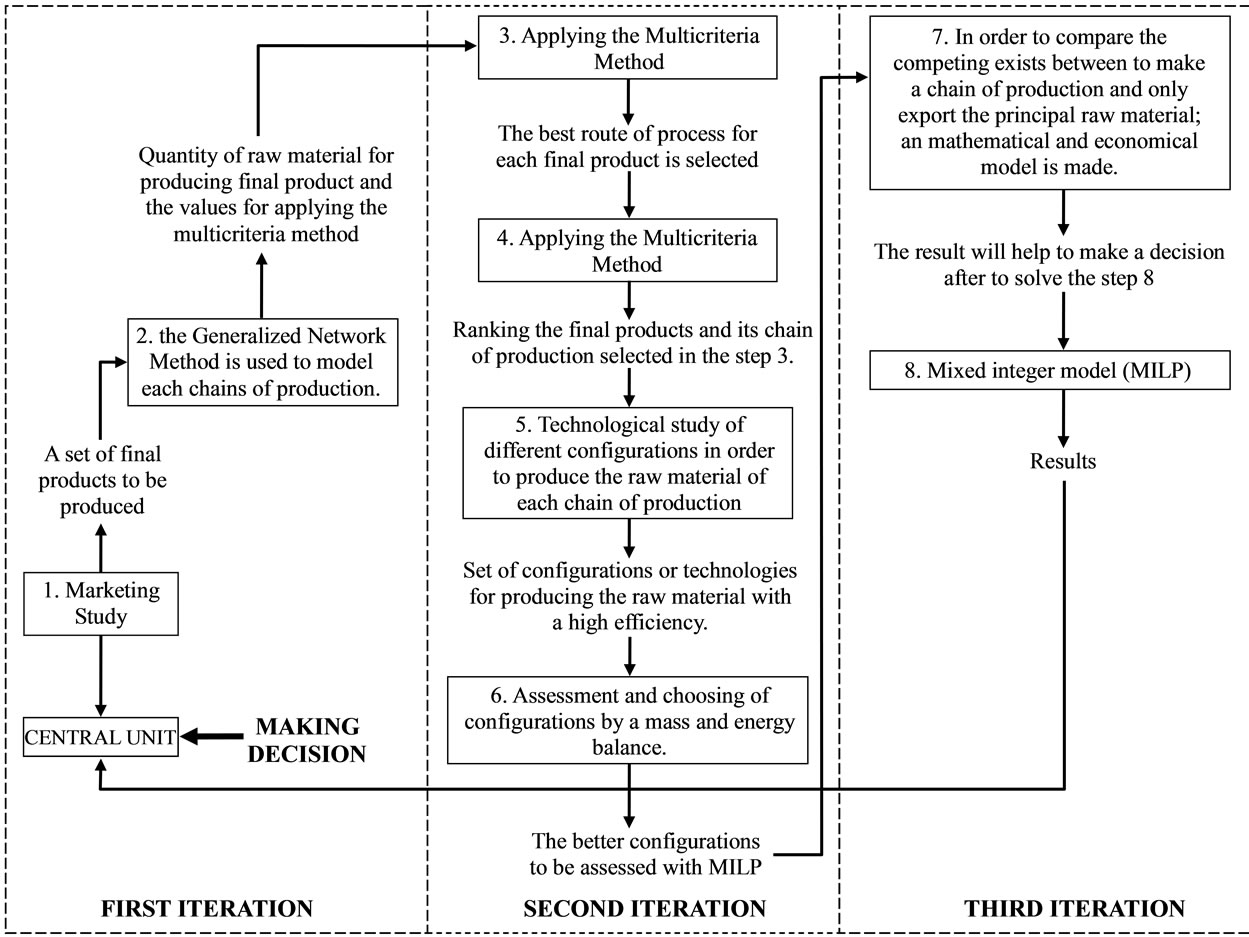
Figure 2. Generalized methodology proposed.
4. Case Study: Introduction to the Petrochemical Industry
The hierarchical multilevel model planning, to be developed in this paper, to be well understood, requires a brief presentation of the Petrochemical Industry. This important Industry is a huge of network of processes and products.
The petrochemical industry system is a large, complex, and constantly changing industry. There are more than 8000 different compounds in commercial production derived from petroleum and natural gas. It is capital and energy intensive. It has also structured in an oligopoly. The petrochemical products multiply their value along the chain of production until their final destination. For example: p-xylene increments 170 times in a shirt, PVC increments 40 times in a tennis ball and the acrylonytrile increments 150 times in a sweater.
The Petrochemical Industry is based upon the production of chemicals from petroleum and natural gas. This industry also deals with chemicals manufactured from the by-products of petroleum refining. Also included, are chemicals produced from natural gas liquids.
Those raw feed stocks, petroleum and natural gas, are found at the beginning of the production chain. From these feed stocks it can be produced a relatively small number of important building blocks. These building blocks include the lower olefins and aromatics: ethylene, propylene, butylenes, butadiene, benzene, toluene and xylenes.
These building blocks are then converted into a complex array of thousands of intermediate and final chemicals, considering of course, their technology processes. The final products of the petrochemical industry are generally not consumed directly, but are used by other industries to manufacture consumer goods. Such versatility, adaptability and dynamic nature are three of the important features of the modern petrochemical industry.
The structure of the petrochemical industry is extremely complex. It is severely cross-linked, with the products of one process being the feedstock of many others. For most chemicals, the production route from feed stocks to final products is not unique, it includes many possible alternatives. As complicated, as it may seen, this structure is however comprehensible, at least in a general form [4,34]. In fact, there is a multitude of production routes available for most chemicals which are produced by more than one technology. The classification and description of petrochemical end products is not an easy task, because petrochemicals find their way into such a broad diversity of products and frequently a particular product will fall into more than one category. However, it is generally agreed that the main end products are in the form of polymers and copolymers: as plastics, but also elastomers, fertilizers and fibbers. Other products are solvents, detergents, paints, coatings, pigments, dyes, cosmetics, pharmaceutical forms, and food uses.
When the oil crises and embargoes came, the environment in which the international petrochemical industry operates suddenly changed. No longer were feedstock supplies and costs steady and predictable, nor was energy consumption a minor consideration.
In 90’s decade, the three critical factors in the changing international industry face were: severe cycles in profits, globalization and continuing and substantial industry learning curve effects.
4.1. Mexico’s Petrochemical Industry
Petrochemical industry was one of the largest Mexico’s industries. Up 35% of Mexican industries required petrochemicals in their operations at the moment of this industry was at its best level of production (1950-1990).
The Mexican politician decision makers, have took the decision to sell the entire infrastructure and go, briefly speaking, to sell more crude oil abroad the country, considering that it could be an interesting business. Mexico lost in that moment the opportunity to increase the added value along the production chain of crude oil exported. In all these decisions the country lost the possibility of real industrialization, producing more petrochemicals for the internal market and to then develop the manufacturing industry still more.
Then, the three critical factors described above and the industrial flexibility has not taken into account in Mexico’s Petrochemical Industry planning and consequently, it lost both; the dynamic growth and the possibility to add value to their products.
5. Applying the Methodology to the Case Study
In this section we propose a model to assess technologies within a set of petrochemicals chains as case study, in order to promote the industrial development and then their added value.
The system can be viewed in its general form in the Figure 3.
From left to right, in the “t” period of planning horizon, the Figure 3 shows the sequence of the problem; it starts with the crude oil availability as raw material of a refinery to produce basic petrochemicals using a ad-hoc technological configuration and then, use those basic petrochemicals to produce intermediate and finals depending of the exogenous demand of the later.
From right to left, in the same figure, the situation becomes more complex, i.e., with the exogenous demand coming from the manufacturing industry, the production
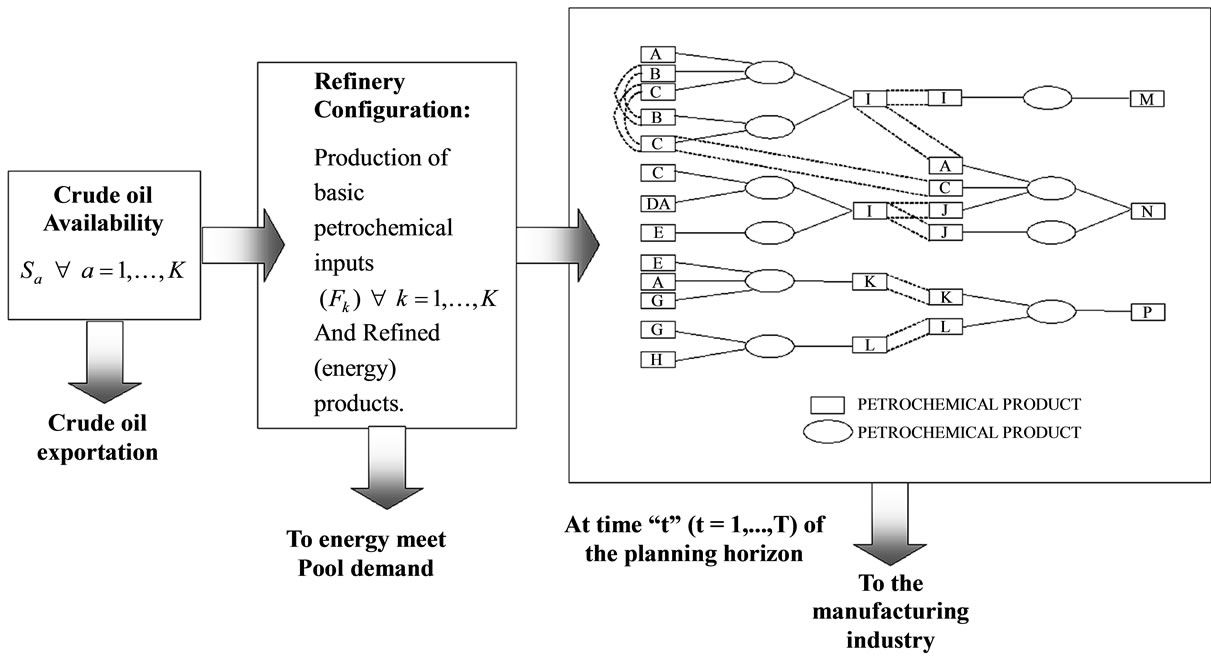
Figure 3. Intermediate and final petrochemical industry.
of final petrochemicals should be defined using network analysis; select the best routes of production considering different criteria (MCDA) and then choose the final demanded products using the same criteria. The productions of intermediate and basic petrochemicals are then induced depending on the route chosen. A mixed-integer linear programming model is built in order to choose the best refinery configuration and to define the production of the basic petrochemicals and the size of the chosen refinery configuration.
Then, the exogenous demand-coming by the manufacturing industry-defines which the final petrochemicals candidates for production are. The network analysis induce de intermediate and basic petrochemicals, generating alternatives, meanwhile MCDA is used to select the best routes of production for final petrochemicals, defining the intermediate’s and basic’s. Also, MCDA is used to select the final petrochemicals to be produced and the integer linear programming to schedule and size the better refinery configuration, among a subset of technological configurations available. In order to know if the best solution is obtained, it is utilized a multilevel planning decentralization procedure to be sure that the solution converges.
This methodology will be discussed in subsection 5.3.
Therefore, the following data are needed to develop the methodology:
1) Value of every petrochemical product (VP) (total costs-excluding the cost of intermediate and final products-plus i% Return on Investment); i = rate of return.
2) Value of every petrochemical product (VP) (total costs-excluding the cost of intermediate and final products-plus i% Return on Investment); i = rate of return.
3) Total costs of production and investments for all the petrochemical processes.
In the case of investments, a source of economic and technical data, were 3 different production capacities for each one of all products/technologies in the network, considering the Process Economic Program information published by Stanford Research Institute. Then, we have needed a function to find a correlation between those 3 capacities, considering economies of scale, in order to interpolate o extrapolate other capacity:
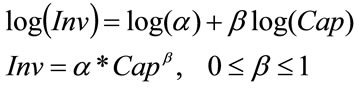 (6)
(6)
Where:  and
and  are constants to be calculated by a regression; Inv = Investment and Cap = Production capacity.
4) To calculate the added value into the whole petrochemical system. This amount is: (VP) variable costs, for each petrochemical product.
5) To search a set of technological configurations for a Refinery with interesting basic petrochemicals yields. This search was one of the most important contributions in the chemical engineering field [20].
6) To search indexes of damage to the environment and to human health in every chemical produced along the petrochemical chains.
It is important to leave clear, that it was searched the best Refinery’s configurations among a lot of possibilities. At that point, we have dressed a technology intelligence system in order to have sufficient alternatives about those configurations. We have got a reduced number of refinery configurations and then, we design them. To have confidence of those configurations, a process simulation program was used to be sure that all of them will operate with the necessary yields, obtaining the basic petrochemicals needed. With those designs, the investment and operating costs were calculated.
5.1. Network Model Representation of the Petrochemical Industry
The network structure processes and products linked by “chains of production” in a production route are shown in Figure 4. As it can be seen, there are five important elements on this network. The first, on the left hand side are a few “basic” products (coming from a petroleum refinery production). On the contrary, there is a huge quantity of “intermediate products” in the network being these products one hundred times more than the basic products. The final of the network there also are a few “final products”. Second, the intermediate products can be shared to produce the final products, beginning always with any one or more of basics. Third, in order to traverse the arcs, one should know (exogenously) which final products are needed to be produced. Fourth, it exits always at least one associated process of production for a product. Fifth, it is necessary to choose the technological route to take, in order to know the inputs of the final products, needed to be produce.
The algorithm constructed utilizes the Equations (1) to (4) and was constructed by Sevilla [35]. Then for “traversing the arcs” of the network composed by final products with an exogenous demand, intermediate and basic products, we “induced” the demand required meeting the final’s products. Once the arcs are traversed and the demands of intermediate and basic products are calculated, we will utilize a multicriteria method in order to focus on the best route of production and reduce the dimension of the complexity due to the combinatorial problem.
5.2. Multicriteria Decision Analysis (MCDA)
To evaluate the best petrochemical chain for a given final petrochemical, we have utilized multicriteria decision analysis.
The criteria used are:
1) Maximization of the added value along the petrochemical chains (routes) in order to produce the final petrochemical “pi”;
2) Minimization of investments required trough the petrochemical chains to produce the final petrochemical product “pi”;
3) Minimization of the real quantity of energy needed by different process/products along the petrochemical chains to produce the final petrochemical “pi”;
4) Minimization of the risk of damage the environment by any of the products along the petrochemical chains for producing the final product “pi”.

Figure 4. Graphical representation of petrochemical processes and products.
5.3. Multilevel Planning
The three steps to coordinate the decision making will be:
Consider a hierarchy of three levels, the first level, represents the Central Unit that receives information from “the market”. The market demands of some final petrochemicals, a time “t” (t = 1,...,T). This information came from econometric and prospective models, exogenously performed. The information (the calculated demand for one “t” of the horizon planning), is transmitted the “Central Unit”, which is a strategic planning centre. This Central Unit also coordinates the levels below it. See Figure 5.
The Central Unit (CU) will then transmit the information to the next two lower levels, named “The Refinery” and the “Final and intermediate petrochemicals’ Producers”. At the same time the CU, is transmitting the information to decentralize the decisions. At the second level, the Refinery knows the conditions under which it can use crude oil to produce petrochemicals. This is considered as the first iteration.
Of course all the levels have the information about the “induced” demands of intermediate and basic petrochemicals.
The coordination variables under the control of the CU are the market demands of final petrochemicals and the four criteria to choose the best technological chains utilizing multicriteria decision making.
In the second iteration of the lower levels decentralization procedure, the final petrochemical producers will select the best chain of production taking into account a multicriteria analysis. This information is returned to the CU. On the other hand these petrochemicals producers will induce the demand of basic petrochemicals. The information is communicated to the Refinery with the product values. The Refinery will inform to the CU how are the values of those petrochemicals that will be equivalent to a certain price of the crude oil. The CU will inform to the market if it is possible to produce all the products (production = demand) or not: production is lower than demand.
If the final demand is not satisfied, the CU can take the decision of import the necessary quantity to meet the final demand. But the CU, ask the producers to take a multicriteria decision making with the same criteria, but now in order to know which final products can be really considered, ordered in a hierarchy, ranking process. With this information, it will be possible to know which products are outranked to others. This valuable information serves to solve a linear programming problem to know the refinery’s assignment and scheduling solution. So, the Refinery will search their own best technological configurations with high yields of basic petrochemicals, and the petrochemical’s producers will rank the final products for each one of the final products demanded.
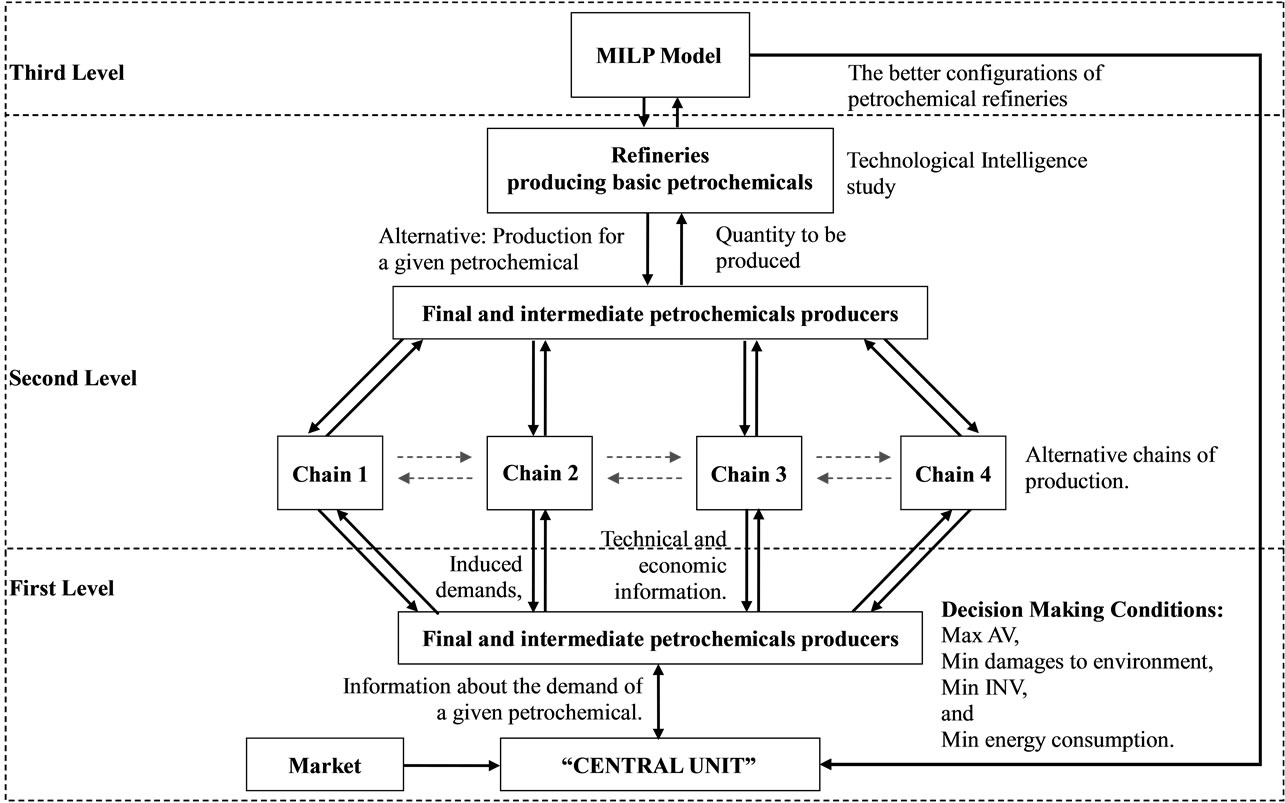
Figure 5. Graphical representation of the problem.
This information is taken for the Refinery decision makers to select finally the basic petrochemicals to be produced taking into consideration the quantity of crude oil allowed and the technical configurations. This is the third and last iteration if the solutions converge in a feasible technical solution.
The CU gives the order to the Refinery to solve jointly with the petrochemical’s producers, a MILP model, using as general idea the procedure of PROMETHEE V. This model is explained in the next section.
Finally, this information is taken for the Refinery decision makers to select the basic petrochemicals to be produced taking into consideration the whole added value of the chains of production and also its own. The iterative process has finished.
5.4. The MILP Model and the Equivalence of Crude Oil
Considering the choice of the best technological routes for every final petrochemical product in the network, was solved utilizing PROMETHEE II (complete ranking), we are going to purpose a new approach considering as a framework the procedure of PROMETHEE V, in order to solve the refinery’s problem. The refinery’s problem consists in choosing a mix of the best technological configurations of refineries, and then obtaining the schedule of production of basic petrochemicals to meet the demand of finals, through the routes ranked, using multicriteria techniques as it was pointed out in previous sections. To do it, the objective function, will use the values of the net flows obtained by PROMETHEE II in the case of ranked final petrochemicals.
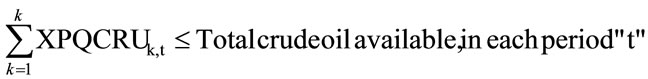
We will define the constraints needed in our case to treat the Refinery’s problem: The total crude to be processed to obtain petrochemicals for all periods of the Horizon Period (HP) will be an allowed quantity of crude oil in “t” period.
For other periods of HP, it is possible to increment the capacity of processing crude oil until a maximum of a fixed quantity.
The Planning Horizon will be taken by periods of 3 years each one until we reach the last year of the HP (t = 1…, T).
We will call [ ] the set of constraints that:
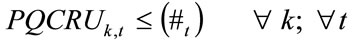 (7)
(7)
where # is the quantity of crude oil assigned by the Central Unit for each technology; and  is the quantity of crude oil allowed to the basic petrochemical production and being “k”, the possible refinery’s configuration.
Because we should choose the better production program among six refinery configurations, we will use integer variables in order the model can decide which configurations are best than others and also to know how many refineries will be needed of each configuration, replacing Equation (7) as follows:
[REUTCRUk, t]: XPQCRUk, t-#*Kk = 0; (7a)
where: Kk is an integer.
The total balance [TOTAL] for all refineries can be chosen is, then:
(7b)
The refinery’s LP problem is then transformed to a Mixed Integer Linear Programming (MILP).
The production of basic petrochemicals [ ] for configuration k is as follows:
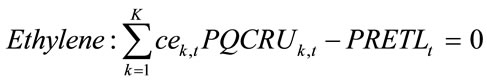
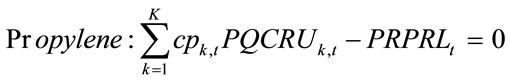
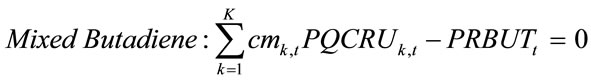
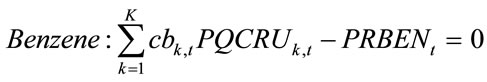 (8)
(8)
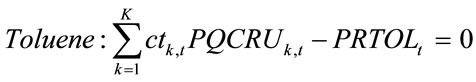

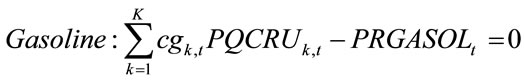
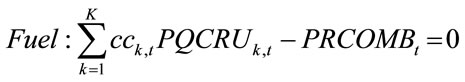
Being  = {PRETL, PRPRL, PRBUT, PRBEN, PRTOL, PRXIL, PRGASOL, PRCOMB}.
The coefficients

are the yields in weight % of each product (ethylene, propylene, mixed butadiene, benzene, and toluene, xylenes, gasoline and fuel). These yields could be different for each “k” configuration in the period “t” of the PH.
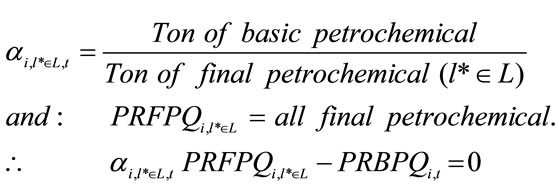 (9)
(9)
where  denotes the final petrochemicals production resulting from MCDA selection and describes all better technological chain which has outranked all others, and
  for all final products and for all “t” (t = 1,…,T).
On the other hand for each period “t”, the demand constraints [ ] for all final petrochemical, are:
 (10)
(10)
where  was calculated by an econometric model and a prospective approach.
Additionally, we have modelled another constraint to take into account that the offer of the Refineries is not necessarily equal to the final petrochemicals demand. This constraint is called [PROFIT]. We can write:
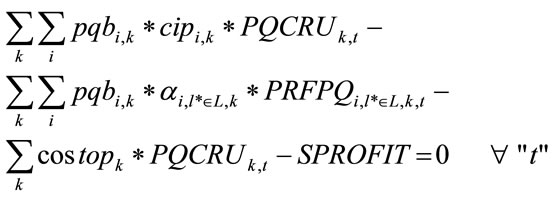 (11)
(11)
where:  is the market price of the basic petrochemicals “i” from “k” configuration,
  is the operation cost of the “k” configuration and
  is the refineries’ margin profit.
Of course all variables are greater or equal to zero.
The objective function is then:
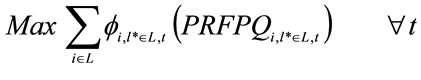 (12)
(12)
Being  the net outranking flows came from PROMETHEE II, for each final petrochemical (
 ) at period “t”.
5.5. Crude Oil Equivalence Value of One Ton of Versus the Final Petrochemical’s Product Value
The problem here is to answer the following question: which is the marginal rate of substitution of petrochemicals for crude oil exportation. In others words it should be answer the following question: Which is the equilibrium price that equals the crude oil price with the product value of basic petrochemicals?
To answer to this question, we present a procedure below.
 (13)
(13)
 (14)
(14)
 (15)
(15)
 (16)
(16)
All terms in Equation (16) are annualized (F), where F is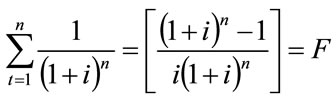 .
.
Being “i” the rate of return.
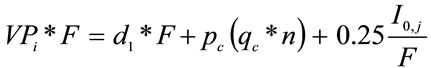 (17)
(17)
Then  is:
is:
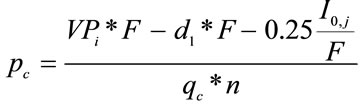 (18)
(18)
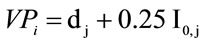
where:
 = Product value of petrochemical “I” through the chain of production (US$)
 = Annualized investment of the “j” (j=1,…,6) Refinery configuration (US$)
 = Total costs of production but not considering the crude oil (US$)
 = Cost of the crude oil (raw material) (US$)
 = Crude oil market price (US$/Ton)
 = Demanded quantity of crude oil being utilized by the Refinery (Ton)
 = 25%, is the rate of return on investment (ROI)
 = Number of years in the horizon planning (HP).
6. Results Obtained
In order to have a reference framework to present the results obtained in this work, we will present in Figure 6 a generalized flow sheet of the proposed methodology and then, following with that description, the results have been obtained.
6.1. Flow Sheet of the Proposed Methodology
Figure 6 shows the flow sheet of the proposed methodology for the case study. This figure has been taken from the Section 3 and adapted for the purpose of the case study.
6.2. The Case Study
We will use a case study a part of Mexico’s Petrochemical Industry. For doing that, we need to define the final petrochemicals for planning their better way of production, taking into account the several technological routes.
The CU receives information about the market requirements in form of demands considering t = 1 as 2009, the first year of the HP t = T, the end of the HP as 2025. Table 1, gives an overview of the market needs.
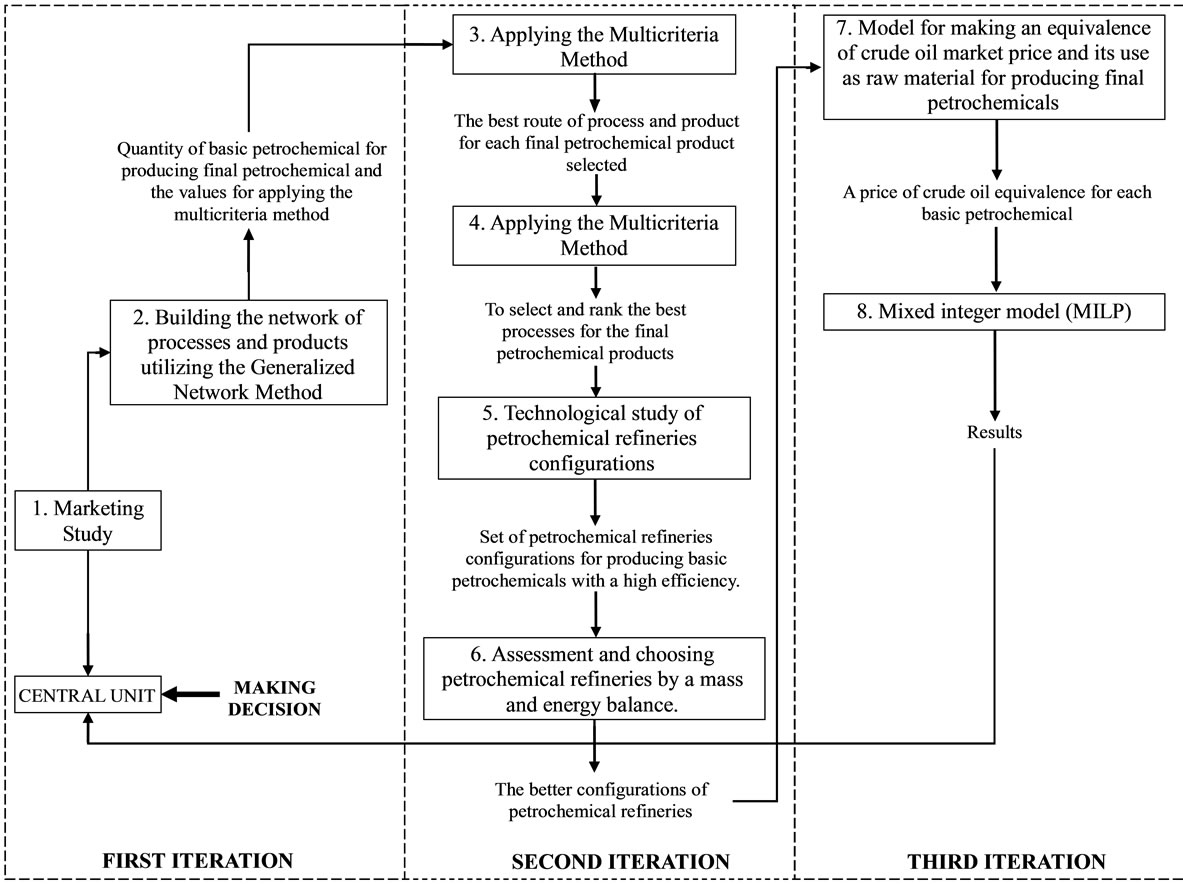
Figure 6. Applying the methodology to the case study.
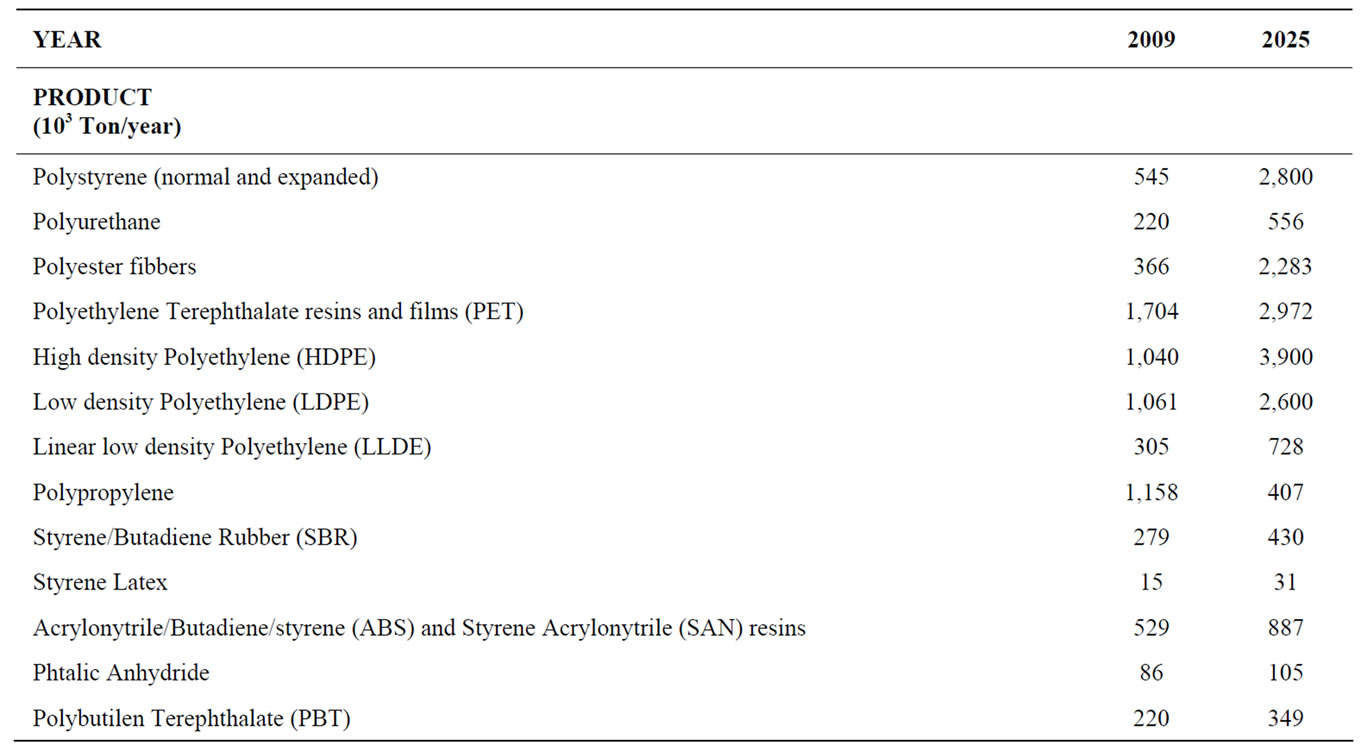
Table 1. Demand overview for some final petrochemicals.
With this information, the CU sends it to the petrochemical producers and also to Refinery decision makers. The petrochemical’s producers (intermediate and final), will build their alternative chains of production.
They proceed to make the selection of the best technological routes (chains) using multicriteria decision analysis with PROMETHEE II, having as criteria:
1) Maximization of the added value along the petrochemical chains (routes) in order to produce the final petrochemical “pi“(Weight: 4.8).
2) Minimization of investments required trough the petrochemical chains to produce the final petrochemical product “pi“(Weight: 2.0).
3) Minimization of the real quantity of energy needed by different process/products along the petrochemical chains to produce the final petrochemical “pi“(Weight: 1.7).
4) Minimization of the risk of damage the environment by any of the products along the petrochemical chains for producing the final product “pi” (Weight: 1.5).
The results from PROMETHEE II are presented in the Table 2.
As an example of how PROMETHEE II is applied, in Figure 7 is presented the case of polyester fibbers.
From this figure, whose results have been obtained from Decision-Lab software, it is possible to conclude that the best technological route for the polyester fibbers is the number 1, taking into account the four above mentioned criteria.
Considering this “best” technological routes to produce the final petrochemical, the second step is to make compete products considering the technological route chosen. We also utilized PROMETHEE II. With the same 4 criteria, same weights and same threshold function. Table 3, shows the data for this competition.
With these results the Petrochemical producers communicates to the CU which route is the best for each final product. The CU asks to the final producers to make a selection of the best final products, but considering the best technological route have been chosen previously. The results, coming from data in Tables 2 and 3, are presented in Table 4.
The CU makes an exploration taking into account the quantities of basic petrochemicals needed to be produced, consulting the Refinery’s decision makers.
These last decision makers look for an appropriate configuration to produce those basic petrochemicals. The first outcome is considered that all the final and intermediate petrochemicals are derivatives from benzene, toluene, orthoxylene, and paraxylene and also from ethylene, propylene and butadiene. They will search the alternative refineries configurations. The results are as follows [21].
It was found 6 configurations having as characteristic that more petrochemicals yield they have more investment and operations costs are put into consideration. See table 5.
For the whole solution of the problem, it is necessary now to solve the MILP model having as objective function the values of the net flows obtained for PROMETHEE II, when the final products have ranked.
The results obtained will tell the decision makers how much of the final petrochemicals could be produced and also whose refinery’s configurations or a mixed of them could be possible to operate. On the other hand these results will compare the marginal value of use a ton of crude oil for producing petrochemicals instead of export it, when the marginal benefit is about 60 $/barrel.
At the end the Refinery communicates to the CU how much crude oil can be put in operation to produce the demanded petrochemicals and also communicates to the petrochemical producers how much basic petrochemicals could be produced.
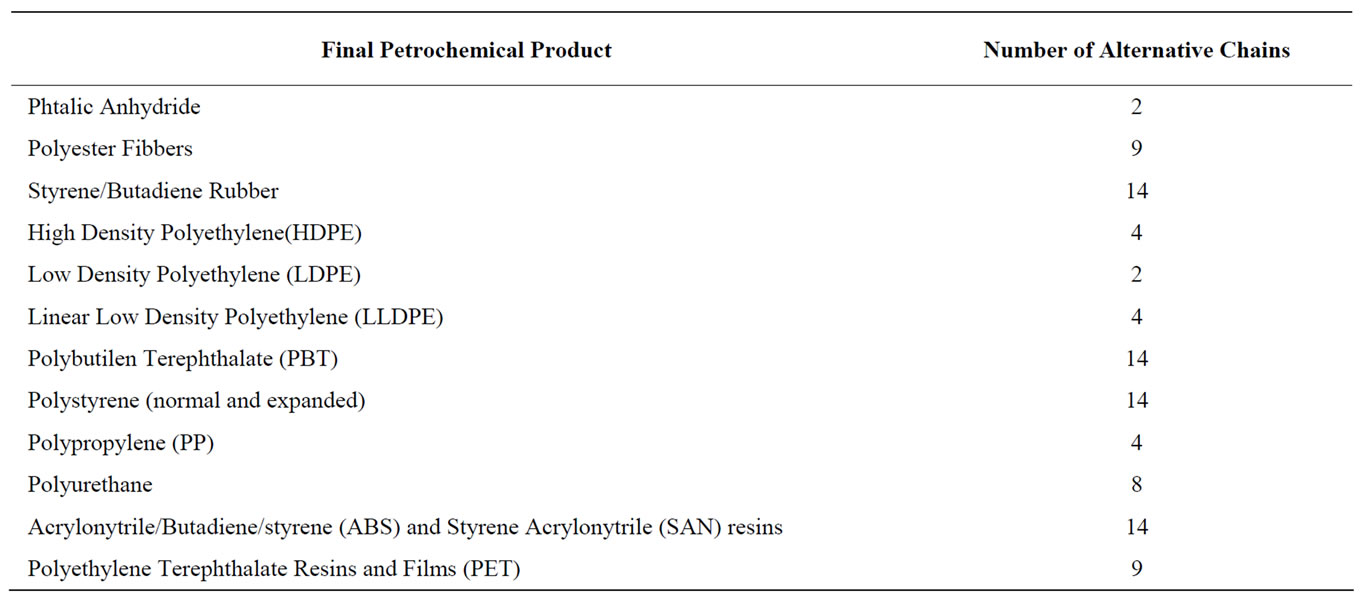
Table 2. First step: competition among chains.
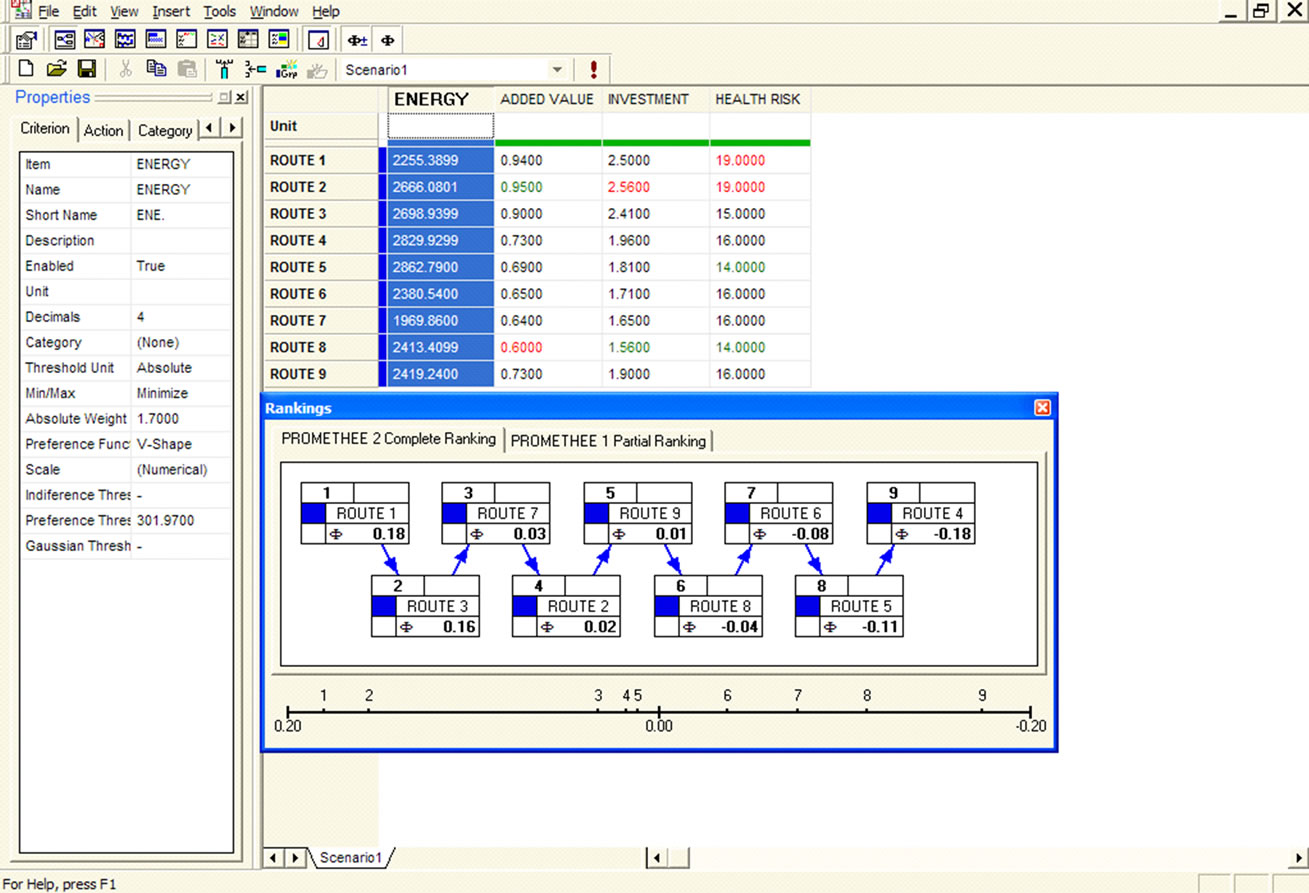
Figure 7. Choosing of process’ route for polyester fibbers using PROMETHEE II.
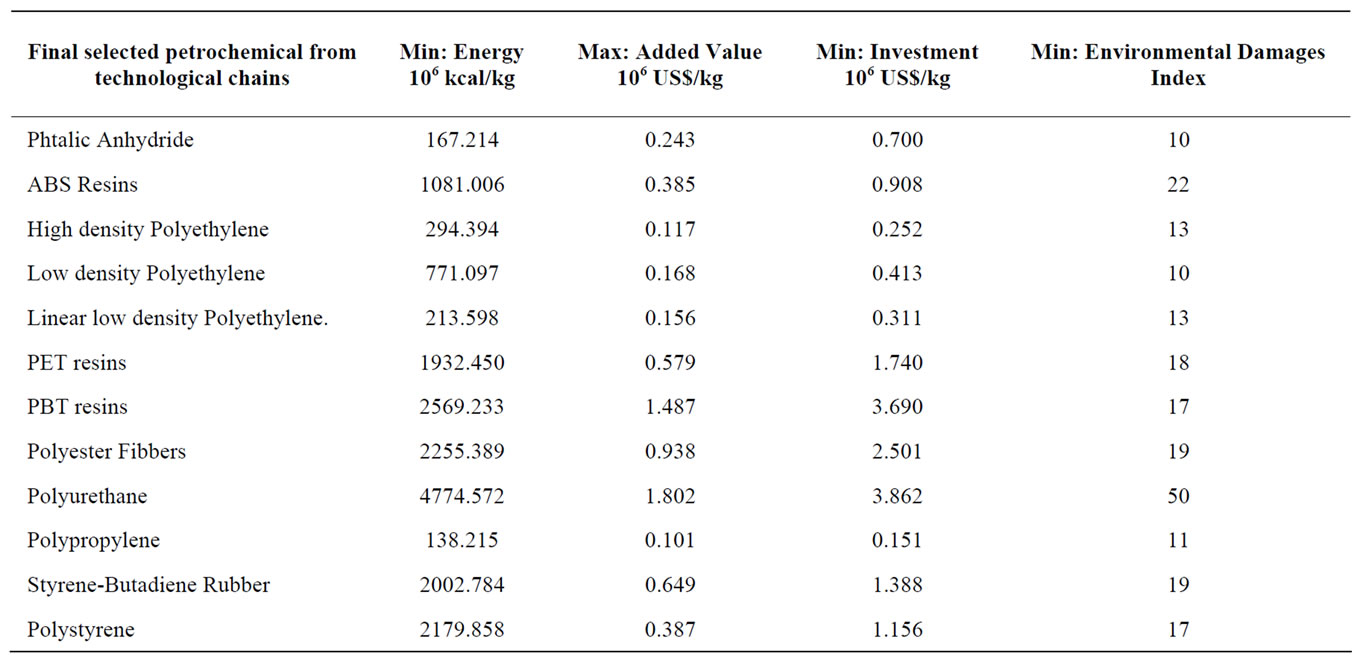
Table 3. Data to select final petrochemical products.
6.3. Refinery’s LP Solution
The solution of LP model (set of Equations (7) to (11))solved with the” LINGO" 10” SOFTWARE, is as follows:
1) The solution had a global optimal.
2) The solution considers the exploitation of 300,000 b/day of crude oil (15 millions ton/year), using the six technical refinery configurations at its upper limit of the availability.
3) The final and basic petrochemical products considered in the solution are as follows (see Table 6).

Table 4. Final petrochemicals in competition. Results.

Table 5. Technical and economical data for Refinery’s configurations.

Table 6. Production of final petrochemicals.
4) The following data has been taken from the optimal solution; it concerns the basic petrochemicals to be produced to obtain the quantity of final petrochemicals and the quantities put on the free market to be sold (See Table 7).
The dual of the problem has some significance: The reduced costs as well as the dual prices express that no final products will be produced if the Φ’s have a negative value; nevertheless an important set of dual variables, are then associated to the upper level of crude oil quantity allowed for each refinery configuration (see Table 8). For example the more important configuration are the forth. That configuration has a dual variable many times greater than the other five, as follows:
As an experiment to prove that configuration 4 is the better, we put 6 times a module of this configuration, i.e. PQCRU4 ≤ 2.5 × 10⁶ Ton/year, 6 times. We have obtained better results: the objective function has increased from 0.1334227 to 0.1376648, because it has produced the total demand of the Polyester fibbers, from 192,855 Ton to 366,000 Ton. The rest of the solution was the same reported in Table 6. Other interesting results from the dual problem were that if some final products had positive values in the objective function (i.e. their flows had been able to be positives), the production of ABS resins, were incremented the value of objective function (reduced cost).
5) Other results about the properties of the solution are as follows:
In the Table 9, all the values correspond to the petrochemicals chains from basic to finals and do not include nor the Refinery’s expenses as operations costs does
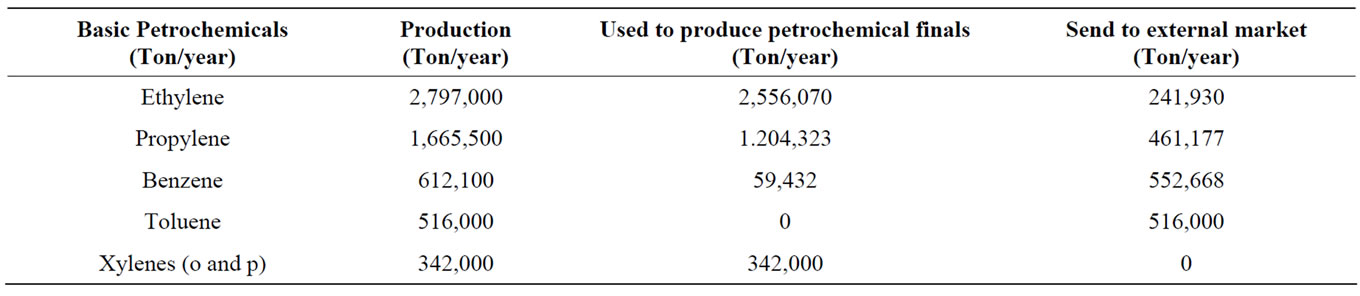
Table 7. Production of basic petrochemicals.
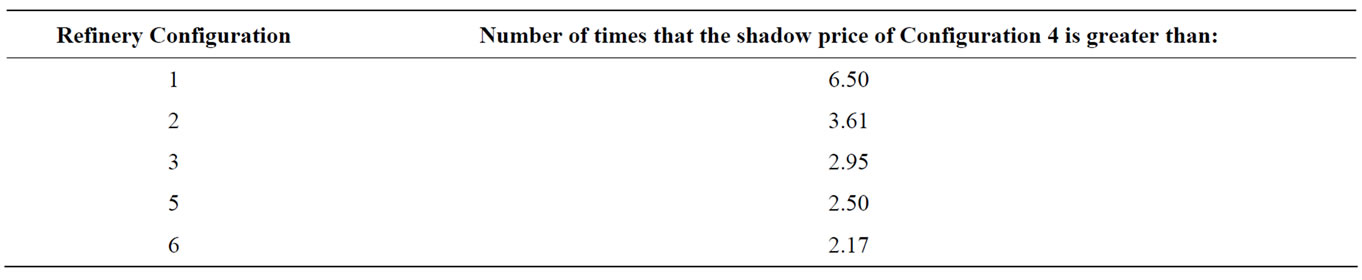
Table 8. Shadow price comparison.
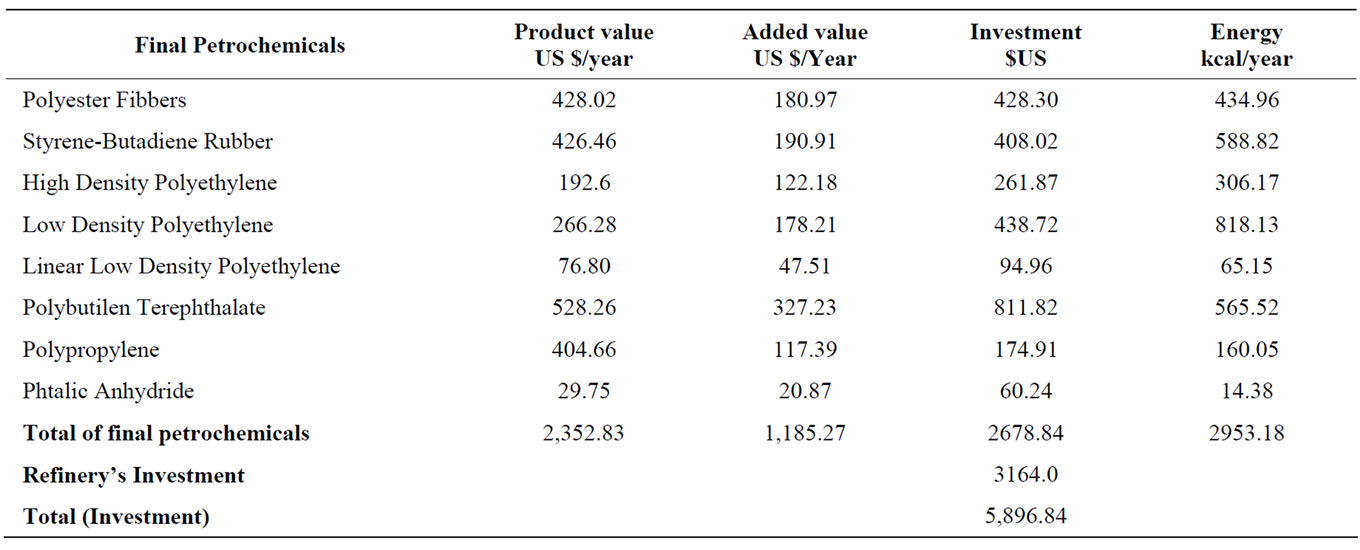
Table 9. Productvalues, added values, investment and energy consumed (Millions).
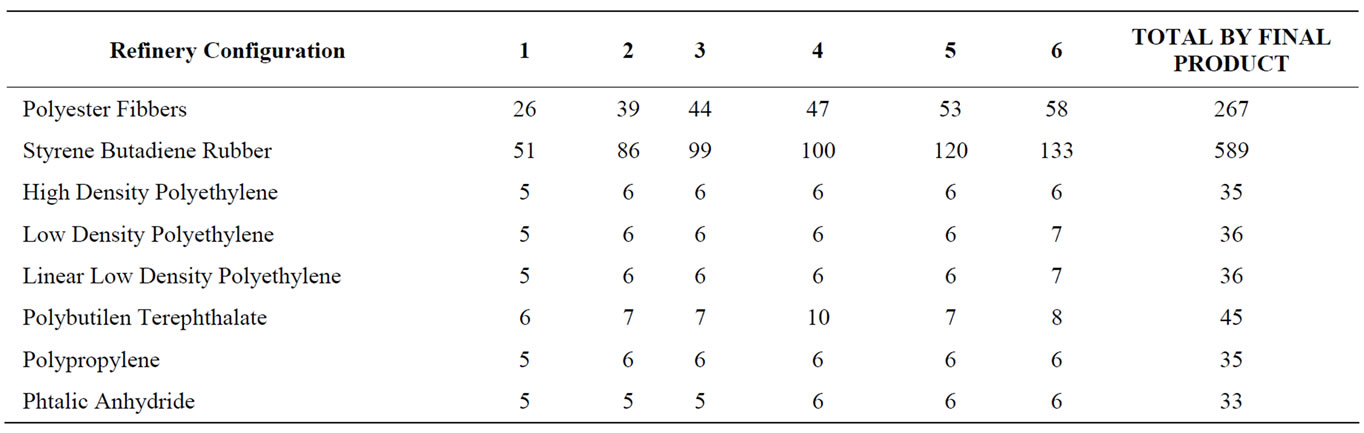
Table 10. Equivalence of final petrochemicals to one barrel of crude oil (US $/bbl).
neither the energy use.
The total investment, considering the Refinery’s is about 5, 897 millions US $. With this last figure, it is possible to express and 1US $, gives an added value of 0.20 US $, much better than nothing if the only exportation of crude is take into account.
On the other hand, if it is added the sales income for the basic petrochemicals sold to the external market, the product value of 2,353 millions US $ is risen to 4,014 millions US $. This figure can be considered as an income and then, a benefit/cost relationship is about 70%. These figures do not take into account the gasoline, fuel oil and other products produced by the refineries, to be sold in the free market.
6) Equivalence of crude oil price for the petrochemicals produced: The marginal rate of substitution.
Considering that one of the objectives of this work, was to compare the equivalence of the petrochemical’s chains with one barrel of crude oil to be exported at least at $ US 65 per barrel, in the following table (Table 10), it is dressed the values in terms of their crude oil equivalence. It is important to consider that these values are calculated for the whole chains, using the Equations (12) to (17).
The difference between the refinery’s configurations is due both, to the complexity of them and also to the fact of more complex are the refinery more basic petrochemicals products can be obtained. One can also see that with these total values for the petrochemical chains of US$/bbl 1,076 can paid more than16.5 times the exportation price of the same barrel of crude oil, i.e. US $ 65/bbl.
7. Conclusions
1) We have successfully finished with a new characterized model to coordinate decision makers at different levels of a decentralized hierarchy, considering a mix of operational research tools as the generalized net work technique jointly with multicriteria decision aid methods and mixed integer linear programming.
2) We have reduced the complexity of the combinatory decision making to select more efficiently the final petrochemicals chains.
3) In the case study, we have shown the petrochemical products give more added value comparing those values with the only crude oil exportation. A multiplier of the investment of about 0.20 US$, has a great significance. On the other hand a relationship of 70% of benefice/cost is very attractive one.
4) We have found the dual of the MILP problem. From it, we have been able to select the better of technological configurations of the Refineries.
5) We have also been able to experiment with a “natural ranking” of the Refineries trough the shadow prices of the dual problem, whose value help us to improve the first ‘optimal’ solution found.
6) We can also show that the equivalence of the petrochemicals compared with only exportation of crude oil is well paid. It is important to mention then, that use crude oil as petrochemical raw material instead of export it is a good business and will serve to develop the industrialization of the country.
7) All the values coming from the whole methodology does not have the concept of real “optimal solutions” as a mathematical programming model has, but these solutions are the ‘best’ can be obtained considering the decision maker’s preferences.
8. Acknowledgements
We want to acknowledge Mr. Sevilla, whose aid was very important in discussing a lot of parts of this work but overall, for the construction of the software “traversing the arcs”.
9. References
[1] R. Armand, “La dècentralisation des décisions par les prix,” Metra, Vol. 7, No. 3, 1968.
[2] K. J. Arrow and L. Hurwicz, “Decentralization and Computation in Resource Allocation,” Mathematical Methods in the Social Sciences, University of North Carolina Press, 1960, pp. 34-104.
[3] J. P. Aubin, “Multigames and Decentralization in Management,” In: Cochrane, J. Ed., Multiple criteria decision making, University of South Carolina, Columbia, 1973.
[4] J. T. Bell, “Modeling of the Global Petrochemical Industry,” Ph. D. Thesis, Department of Chemical Engineering, University of Wisconsin-Madison, Madison, 1990.
[5] A. Bensoussan, “Decentralization in Management,” European Institute for Advance Studies in Management, Bruxelles, 1972.
[6] J. P. Brans, “The Space of Freedom of the Decision Maker Modeling the Human Brain,” European Journal of Operational Research, Vol. 92, No. 3, 1996, pp. 593-602.
[7] J. P. Brans and P. Vincke, “A Preference Ranking Organization Method: The PROMETHEE Method for MCDM,” Management Science, Vol. 31, No. 6, 1985, pp. 647-656.
[8] J. P. Brans and B. Mareschal, “PROMCALC & GAIA: A New Decision Support System for Multicriteria Decision Aid,” Decision Support Systems, Vol. 12, No. 4-5, 1994, pp. 297-310.
[9] J. P. Brans and B. Mareschal, “Promethee-V: MCDM Problems with Segmentation Constraints,” Vol. 30, No. 2, 1992, pp. 85-96.
[10] J. P. Brans and B. Mareschal, “The PROMETHEE VI Procedure, How to Differentiate Hard from Soft Multicriteria Problems,” Journal of Decision Systems, Vol. 4, 1995, pp. 213-223.
[11] J. P. Brans, B. Mareschal and P. Vincke, “PROMETHEE: A new Family of Outranking Methods in MCDM,” In: Brans, J. P. Ed., Operational Research’84 (IFORS’84), Amsterdam, 1984, pp. 477-490.
[12] J. P. Brans, “L'ingéniérie de la décision. Elaboration d'instruments d'aide à la decision,” Méthode PROMETHEE. Université Laval, Quebec, Canada, 1982.
[13] O. E. Chavez, “Structural Simulation in the Analysis of the Chemical Industry,” Ph. D. Thesis, University of Wisconsin-Madison, Madison, 1986.
[14] G. B. Dantzig and P. Wolfe, “Decomposition Principle for Linear Programs,” Operations Research, 1960, Vol. 8, No. 1, pp. 101-111.
[15] T. C. Escobar, Modèles de décentralisation, prix de transfert et coordonnabilité dans les systèmes de Raffinage et la Planification du Gaz naturel. Thèse de doctorat en Calcul économique et Analyse de Système, Groupe de Recherche en Analyse de Système et Calcul Economique (ERA-CNRS No 640), Université d’Aix-Marseille, Belgium, 1979.
[16] C. Escobar and F. Rodríguez, Metodología para la Evaluación de Tecnologías y su Aplicación en el Cálculo del Valor Agregado en Cadenas Petroquímicas. Revista del Instituto Mexicano de Ingenieros Químicos IMIQ, Vol. 4, 1994.
[17] C. Escobar and R. Trémoliéres, Dècentralisation, Prix de transfert et Contrôle de gestion dans les Raffineries. Aix-en-Provence: IAE (Institut d'Administration des Entreprises), 1978.
[18] C. Escobar, Descentralización y Coordinación de un Sistema Jerárquico de Oferta de Productos Petrolíferos y Petroquímicos. En: Memoria de Simposio: Modelos Matemáticos para la Planeación Energética. Universidad Nacional Autónoma de México y Consejo Nacional de Ciencia y Tecnología, 1983. pp. 85-112.
[19] D. Ford, “Develop Your Technology Strategy,” Long range planning, Vol. 21, No. 1, 1988, pp 85-95.
[20] C. Garcia, Documento de examen predoctoral en Ingeniería (Ingeniería Química). Ciudad Universitaria (UNAM), México, 2006a.
[21] C. Garcia, Refinería petroquímica. En: C. Escobar Toledo Ed., Recuperación del Valor Agregado y de la Productividad en la Industria Petroquímica Mexicana. Ciudad Universitaria, México, 2006b, pp. 1-44.
[22] A. Geoffrion, “MElements of Large-Scale Mathematical Programming,” Management Science, Vol. 16, No. 11, 1970, pp. 652-691.
[23] W. F. Hamilton, “The Dynamics of Technology and Strategy,” European Journal of Operational Research, Vol. 47, No. 2, 1990, pp. 141-152.
[24] J. Kornai, “Thoughts on Multilevel Planning Systems,” In: Goreux, L. M. and Manne, A. S. Eds., Multilevel Planning, Cases Studies in Mexico, North-Holland Publishing Company, Amsterdam, 1973, pp. 201-214.
[25] J. Kornai and T. Liptak, “Two-Level Planning,” Econometrica, Vol. 33, 1965, pp. 141-169.
[26] J. Kornai, “Multilevel Programming—A First Report on the Model and on the Experimental Computation,” European Economic Review, Vol. 1, No. 1, 1969, pp. 134-191.
[27] C. Macharis, J. P. Brans and B. Mareschal, “The GDSS PROMETHEE Procedure (A PROMETHEE-GAIA Based Procedure for Group Decision Support),” Journal of Decision Systems, Vol. 7, 1998, pp. 283-307.
[28] E. Malinvaud, “Decentralized Procedures for Planning,” In: Malinvaud, E. and Bacharach, M. O. L. Eds., Activity Analysis in the Theory of Growth and Planning, Macmillan, London, 1967, pp. 170-208.
[29] B. Mareschal, “Weight Stability Intervals in Multicriteria Decision Aid,” European Journal of Operational Research, Vol. 33, 1988, pp. 54-64.
[30] B. Mareschal, “Aide à la décision multicritère: développements récents des méthodes PROMETHEE,” Cahiers du, C.E.R.O., Vol. 29, 1987, pp. 175-214.
[31] B. Roy, “Analyse et choix multicritère,” Informatique et Gestion, Vol. 57, 1974, pp. 21-27.
[32] B. Roy and P. Vincke, “Multicriteria Analysis: Survey and New Directions,” European Journal of Operational Resarch, Invited Review, Vol. 8, No. 3, 1981, pp. 207-218.
[33] D. F. Rudd and C. C. Watson, “Strategy of Process Engineering,” Wiley Internacional Edition, New York, 1968.
[34] D. F. Rudd, S. Fathi-Afshar, A. A. Treviño and M. A. Stadtherr, “Petrochemical Technology Assessment,” Wiley-Interscience, New York, 1981.
[35] E. Sevilla, De los petroquímicos finales a los básicos: Algoritmo de recorrido y métodos multicriterio. En: C. Escobar Toledo (Ed.), Recuperación del Valor Agregado y de la Productividad en la Industria Petroquímica Mexicana. Ciudad Universitaria (UNAM), México, 2006, pp. 1-25.
[36] D. Vanderpooten and P. Vincke, “Description and Analysis of Some Representative Interactive Multicriteria Procedures,” Mathematical and Computer Modelling, Vol. 12, No. 3, 1989, pp. 1121-1238.
[37] H. M. Wagner, “Principles of Operations Research,” Prentice-Hall, Englewood Cliffs, 1970.
[38] L. Walras, “Elements of Pure Economics,” On the theory of Social Wealth, George Allen, London, 1954.
[39] R. L. Ackoff, “Creating the Corporate Future,” John Wiley & Sons, Inc., New York, 1981.
[40] R. L. Ackoff, “Mission Statements,” Planning Review, Vol. 15, No. 4, 1987, pp. 30-31.