Journal of Electromagnetic Analysis and Applications
Vol. 2 No. 6 (2010) , Article ID: 2151 , 13 pages DOI:10.4236/jemaa.2010.26050
Far Infrared Ray Radiation Inhibits the Proliferation of A549, HSC3 and Sa3 Cancer Cells through Enhancing the Expression of ATF3 Gene
![]()
1Department of Oral and Maxillofacial Anatomy, University of Tokushima, Tokushima, Japan; 2Oral and Maxillofacial Surgery, Medical Science for Oral and Maxillofacial Regeneration, Graduate School of Health Biosciences, University of Tokushima, Tokushima, Japan; 3Department of Hygiene Chemistry, School of Pharmaceutical Science, Ohu University, Ohu, Japan, 4Department of Anatomy, Faculty of Acupuncture and Moxibustion, Suzuka University of Medical Science, Suzuka, Japan.
Email: kikuji@dent.tokushima-u.ac.jp
Received February 24th, 2010; revised April 26th, 2010; accepted May 7th, 2010.
Keywords: Far-Infrared Radiation, Human Cancer Cell Lines, G2/M Arrest, Hypertrophy, ATF3
ABSTRACT
Far-infrared ray (FIR) is electromagnetic wave between 4 and 1000 μm. FIR causes heating, but how it affects cells is not well understood. In this study, we developed a culture incubator that can continuously irradiate cells with FIR and examined the effects of FIR on five human cancer cell lines, namely A431 (vulva), A549 (lung), HSC3 (tongue), MCF7 (breast) and Sa3 (gingiva). We found that FIR inhibits cell proliferation and induces cell hypertrophy without apoptosis in A549, HSC3 and Sa3 cells. Flow cytometry revealed that the inhibition of proliferation was due to G2/M arrest. Contrary, FIR did not inhibit cell proliferation and cause cell hypertrophy in A431 or MCF7 cells. Microarray analysis revealed that FIR suppressed the expression of cell proliferation-related and stress-responsive genes in FIR-sensitive cell lines (A549, HSC3 and Sa3). ATF3 in particular was identified as a key mediator of the FIR effect. Over-expression of ATF3 inhibited cell proliferation and knockdown of ATF3 mRNA using an antisense oligonucleotide suppressed FIR-induced growth arrest. These results indicate that a body temperature range of FIR radiation suppresses the proliferation of A549, HSC3, Sa3 cells and it appears that ATF3 play important roles in this effect.
1. Introduction
Far-infrared ray (FIR), which causes heating, includes electromagnetic waves with wavelengths between 4 and 1000 μm. Recently, there have been many studies of the effects of FIR on health and in the preservation of food. The available evidence indicates that whole-body irradiation by FIR has many biological effects. For example, hyperthermia (body temperature of 39°C to 41°C) induced by whole-body FIR has been reported to substantially inhibit spontaneous mammary tumor growth in mice [1-4]. At normal temperature ranges (approximately 25.5°C) tumor growth in SHN mice can be inhibited by FIR [5,6]. Furthermore, whole-body FIR irradiation is believed to improve human health and sleep by enhancing blood circulation in the skin [7,8]. This is likely due to the ability of organic matter to absorb FIR at wavelengths between 7 to 12 μm.
The effects of FIR and particularly whole-body FIR remain unclear, because the experiments are easily affected by environmental changes in temperature and humidity, by the presence of bacteria, fungi and so on. Therefore, we developed a chamber for raising animals that emits FIR upon heating and is capable of maintaining steady conditions. This system employs a sealed heater with a carbon/silica/aluminum oxide/titanium oxide ceramic coating produced using a polycarbonate printing technique [9]. Using this system, we found that FIR inhibits tumor growth in the A431 tumorigenesis model mouse by inhibiting the expression of matrix metalloprotease-1, 9, 10 and 13. Recent studies by Teraoka et al., found that FIR at wavelengths between 4 to 16 μm inhibits the growth of HeLa cells in vitro at 37°C [10]. Despite these findings, the molecular mechanism by which FIR affects cellular gene expression remains unclear.
The lack of data on the effects of FIR on cells is due to the difficulty in stably irradiating cells with FIR under ideal culture conditions (i.e., 100% humidity, 37.0 ± 0.5°C, 5% CO2) and examining the effects of FIR at the cellular level. Therefore, using a polycarbonate printing technique, we developed a CO2 incubator with a sealed heater that has a carbon/silica/aluminum oxide/titanium oxide ceramic coating and emits FIR upon heating [11]. This CO2 incubator can stably emit FIR at wavelengths between 4 and 20 μm (maximum at 7 to 12 μm) under conditions of 100% humidity, 37.0 ± 0.5°C and 5% CO2.
In this study, we used the FIR incubator to examine the effect of FIR on cell proliferation, morphology, cell cycle progression and apoptosis in A431, A549, HSC3, MCF7 and Sa3 human cancer cell lines. Furthermore, we performed comprehensive gene expression profiling of the cells using a cDNA microarray, and we examined the effect of overexpressing and suppressing candidate FIR response gene ATF3. Our results indicate for the first time that growth arrest following FIR irradiation in specific cancer cell lines is due to the expression of ATF3.
2. Materials and Methods
2.1 FIR Incubator
As previously reported [11], we fabricated an FIR radiant-panel incubator by coating a carbon/silica/aluminum oxide/titanium oxide ceramic (radiation efficiency > 97%) using a polycarbonate printing technique (Bloodissue Co. Ltd. Tokushima, Japan). The incubator can stably irradiate organisms with FIR at wavelengths between 4 and 20 μm (maximum at 7 to 12 μm) under conditions of 100% humidity, 37.0 ± 0.5°C and 5% CO2 in air.
2.2 Calculation of Fir Absorbed Per 100-Mm Tissue Culture Dish in the Fir Incubator
FTIR (Fourier Transform Infrared Spectroscopy) analysis revealed that the ceramics coating inside the CO2 incubator emits FIR at 4 W m-1 str-1 μm-1 at wavelengths between 4.486 and 20.256 μm, with a maximal emission of 11.6 W m-1 str-1 μm-1 at 9 μm, which is >95% of the emission rate of an ideal black body. Because the ceramic coating was maintained at 40°C, the total generating energy, integrated over the entire range of wavelengths, was calculated to be 130.225 Wm-2str-1. The total area of the FIR-emitting ceramic surface was 1.2385 (m2). Therefore, the total energy emitted into the incubator was 161.28366 W/str. Assuming that FIR is emitted in all directions, the total emission was 2026.7502 J/sec. Given that the volume of the CO2 incubator was 0.1257 m3 and the volume of culture medium was 6 ml, the amount of energy absorbed by each 100-mm culture dish was 0.09674 J/sec. The surface area of each 100-mm culture dish was 78.5 cm2, so that the energy reaching the base of the dish was 0.001232J/sec/cm2. Thus, over a 1-h period 4.4352 J/h・cm2 was absorbed by each 100-mm culture dish. Therefore, total energy of irradiated FIR was in proportion to irradiating time.
2.3 Cell Lines and Cell Culture
A549 human lung carcinoma cells, HSC3 human tongue squamous carcinoma cells and MCF7 human breast carcinoma cells were purchased from Health Science Research Resources Bank (Sennan, Japan). A431 human epithelial vulva carcinoma cells and Sa3 human gingival squamous carcinoma cells were purchased from RIKEN Cell Bank (Tsukuba, Japan). A431, A549 and MCF7 cells were cultured in Dulbecco’s modified Eagle’s medium/Ham’s F-12 nutrient mixture (Sigma, St. Louis, MO, USA). HSC3 and Sa3 cells were cultured in Eagle’s basal medium (Sigma). All culture medium was supplemented with 10% heat-inactivated fetal bovine serum, 100 μg/ml penicillin G, 100 μg/ml streptomycin sulfate and 250 ng/ml amphotericin B (Invitrogen, Carlsbad, CA, USA). Cells were maintained at 37°C in a humidified atmosphere of 5% CO2 in air. The medium were replaced every 2 days.
2.4 Measurement of Cell Number and Growth
Cells (5 × 10⁴) were plated in triplicate in 24-well plates (Nunc, Roskilde, Denmark). The attached cell populations were measured on days 0, 2, 4, 6, 8 and 10 using 0.2% Trypan blue and a hemocytometer. Incorporation of 5-bromo-2’-deoxyuridine (BrdU) was used to determine the amount of DNA synthesis. DNA synthesis by proliferating cells was assessed using a BrdU labeling and detection kit III (Roche, Mannheim, Germany) according to the manufacturer’s protocol. Briefly, cells (5 × 10³ per well) were seeded in 96-well tissue culture plates (Nunc) and then placed in the FIR incubator for 4 days, and BrdU incorporation was measured during the logarithmic growth phase (i.e., before the cells were confluent) by treating the cells for 4 h at 37°C with 10 μM BrdU. BrdU incorporation was quantified by measuring the absorbance of the substrate reaction (405 nm) and the absorbance at the reference wavelength (590 nm) using an ImmunoMini NJ-2300 (System Instruments, Tokyo, Japan). Absorbance values directly correlated with the amount of DNA synthesis and therefore the number of proliferating cells.
2.5 Histochemistry
Cells were grown on 22-mm2 glass coverslips in 6-well culture dishes (Nunc). After 4 days of FIR irradiation, the cells were observed with a CK40 phase contrast microscope (Olympus, Tokyo, Japan), fixed and stained with hematoxylin and eosin. For immunofluorescent staining of heat shock protein (HSP) 70, cells were washed in PBS (Phosphate Buffered Saline), fixed for 20 min in 4% paraformaldehyde in PBS, washed three times for 5 min each in PBS and blocked for 1h at room temperature with 5% goat serum. Cells were incubated at 4°C overnight in 1:200 mouse monoclonal antibody to HSP70 (Stressgen, Victoria, Canada) in PBS containing 1 mg/ml bovine serum albumin. After washing, the cells were incubated with 1:400 FITC (Fluorescein isothiocyanate) - labeled goat anti mouse IgG (Santa Cruz Biotechnology, Santa Cruz, CA, USA). The localization of intracellular HSP70 protein was identified using a BX51 confocal microscope (Olympus) and a CoolSNAP CF digital camera (Roper Scientific, Trenton, NJ, USA) and calibrated using RS Image Express software (Roper Scientific).
2.6 Cell Cycle Analysis
Most cells were arrested at late G1 phase using the double-thymidine block method. Briefly, cells (1 × 10⁶ per dish) were seeded in a 60-mm dish and cultured for 24 h in the appropriate growth medium, followed by 24 h in medium containing 2.5 mM thymidine (Wako, Osaka, Japan) for A431 and Sa3 cells or 3.0 mM thymidine for HSC3 cells. Cells were washed twice with PBS and incubated with standard medium for 24 h before second 24-h incubation with the same concentration of thymidine. Cells were incubated for 0, 24, 48, 72 or 96 h after the second treatment with thymidine. After removal with 0.25% trypsin-EDTA solution and washing with PBS (-) (Dulbecco’s phosphate buffered Saline without calcium chloride), the cells were fixed for 24 h in 70% (v/v) ethanol at −20°C. Finally, the cells were treated for 30 min with a mixture of RNase A and propidium iodide (PI), and the DNA content in 1 × 10⁴ cells was determined from the PI fluorescence as measured using an EPICS XL-MCL System II flow cytometer (Beckman Coulter, Miami, FL, USA).
2.7 Measurement of Apoptosis (TUNEL Staining)
Apoptotic cells were identified using an Apo-BrdU in Situ DNA Fragmentation Assay Kit (Bio Vision, Mountain View, CA, USA). As recommended by the manufacturer, cells were seeded on circular sheets (Nisshin EM, Tokyo, Japan) in 35-mm tissue culture dishes (Nunc) and were incubated for 4 or 7 days. Cells were fixed in PBS containing 4% formalin for 30 min. After rinsing twice with PBS, cells were incubated with 50 μL of DNA labeling solution for 1 h at 37°C. After rinsing twice with PBS, 100 μL of antibody solution containing FITC-conjugated anti-BrdU antibody and rinse buffer was added and cells were incubated for 30 min at room temperature. Cells were stained with 100 μL PI/RNase Staining Buffer. As a positive control, cells were irradiated with 10J of 260 nm ultraviolet light (UV) using TFX-20 (Vilber Lourmat, Marne la Vallee, France) and then incubated for 24 h. Apoptotic cells were identified by fluorescence microscopy and the number of apoptotic cells in 10 randomly selected fields was measured and used to determine the apoptotic index.
2.8 Microarray Studies and Data Analysis
Four days after FIR irradiation, two control and two FIRirradiated samples were prepared for microarray hybridization. Total RNA was extracted using a Qiagen RNeasy Mini Kit (Qiagen, Valencia, CA, USA) according to the manufacturer’s protocol. Agilent human 1A ver.2 microarray slides (Agilent Technologies, Palo Alto, CA, USA) were used for the hybridization. The quality of RNA samples was monitored using an Agilent 2100 bioanalyzer (200 ng each). To produce labeled cRNA (complementary RNA), high-quality RNA was amplified and labeled with Cy5-and Cy3-CTP (Amersham Biosciences, Buckinghamshire, UK) using a Low RNA Input Fluorescent Linear Amplification Kit (Agilent) according to the manufacturer’s protocol. After the amplification and labeling, the dye incorporation ratio was determined using a Nanodrop spectrophotometer and the ratios were within 10 to 20 pmol per μg cRNA, which is the range suggested by the manufacturer for hybridization. For hybridization, an Agilent 60-mer oligo microarray (Rev.7, SSC Wash/6-screw hybridization chamber) was used according to the manufacturer’s protocol. Briefly, 750 ng Cy3-labeled control and 750 ng Cy5-labeled MPP+- treated sample were mixed and incubated for 17 h with an SSC-washed microarray slide from an Agilent in Situ Hybridization Kit. Sample pairs were dye-swapped and processed at the same time. The washed slides were immediately dried under a stream of ultrapure N2 in an ozone-free atmosphere. After drying, the slides were scaned using an Agilent Technologies Microarray Scanner with the PMT setting at 770 for Cy5 and 670 for Cy3, the raw data were normalized and analyzed using GeneSpring 7.0 software (Silicon Genetics, Santa Clara, CA, USA). For normalization, per spot and per chip intensity-dependent (LOWESS) normalization was used to correct for the intensity-dependent ratio bias [12]. In addition, the following filters were applied to improve the quality of the data: eliminate saturated signal, eliminate non uniformity of background, eliminate non uniformity of feature, Feature Population Outlier, eliminate low signal feature of background signal + 2.6 × SD and eliminate P value < 0.01. Genes were further classified for process and function according to their GO term information (http://www.godatabase.org).
2.9 Stable Transfection of ATF3
The cDNA for full-length human ATF3 was a generous gift from Dr. T. Hai (Department of Medical Biochemistry, Ohio State University, Columbus, OH, USA). ATF3 cDNA was subcloned into the Xba I and Bam HI sites of pcDNA3.1 (-) (Invitrogen). Cells grown on 60-mm dishes were transfected with 8 μg of pcDNA3.1-ATF3 or pcDNA3.1 (Invitrogen) using Lipofectamine 2000 (Invitrogen) according to the manufacturer’s instructions. The transfected cells were selected with 400 μg/ml G418 (Sigma) and clones formed were collected and maintained separately in medium supplemented with 400 μg/ml G418.
2.10 Quantitative Real-Time RT-PCR Data Analysis
To determine the level of ATF3 mRNA quantitative realtime RT-PCR was carried out using a LightCycler and the Fast Start DNA Master SYBR Green I Kit (Roche). The reaction contained 50 ng of cDNA and 100 pmol of each primer in a final volume of 10μl. The gene-specific primers were as follows: ATF3, 5’-AAA CTAGGCAATGTACTCTTCCG-3’ (sense) and 5’-AT CTTGAGATACTGCACGTGG-3’ (antisense), and α- actin, 5’- ATAGCACAGCCTGGATAGCAACG TAC-3’ (sense) and 5’-CACCTTCTACAATGAGCTGCGTGTG-3’ (antisense). The concentration of Mg2+was 3 mM. In all cases, a first phase of denaturation was performed at 95°C for 10 min. Amplification was carried out for cycles of denaturation at 95°C for 10 s, hybridization for 10 s (60°C for ATF3 and α -actin) and elongation at 72°C (10 s for ATF3 and α -actin). Product specificity was evaluated by melting curve analysis. Fluorescence data were analyzed using LightCycler Software Ver.3.5 (Roche). Crossing points were established using the second derivative method. The relative amount of target transcript in the sample was calculated by dividing the amount of target by the amount internal standard (α- actin). Results were expressed as the target/internal standard concentration ratio calculated from the calibration curve. Because the target and internal standard genes had different sequence and amplicon lengths, it was expected that they would show different PCR efficiencies. Therefore, the PCR efficiency (10-1/m, where m is the slope from the calibration curve) was first established for each pair of primers. All reactions were performed in triplicate.
2.11 Protein Extraction and Western Blotting
Cells (1 × 10⁶) were grown in 60-mm tissue culture dishes (Nunc). After removing the cell culture medium from the culture dishes (Nunc) and washing the cells twice with cold PBS (-), the cells were lysed in lysis buffer (20 mM Tris-HCl, pH 7.5, 150 mM NaCl, 1 mM Na2EDTA, 1% Triton X-100, 2.5 mM sodium pyrophosphate, 1 mM β-glycerophosphate, 1 mM Na3VO4, and 1 μg/mL leupeptin). Protein levels were measured by the Lowry method [13] using a DC Protein Assay Kit (Bio-Rad, Hercules, CA, USA). Cell lysate containing 20 μg of protein for ATF3 was subjected to SDS (Sodium Dodesyl Sulfate)-polyacrylamide gel electrophoresis. Separated proteins were then transferred from the gel to a polyvinylidene difluoride membrane. After blocking with 5% skim milk in PBS-Tween, the membrane was incubated for 1 h at room temperature with primary antibody in PBS-T containing 5% skim milk, followed by three 10-min washes with PBS-T. Next, the membranes were incubated for 1 h at room temperature with horseradish peroxidase-labeled secondary antibody and washed three times for 10 min with PBS-T. Immunoreactive protein was detected using an ECL plus kit (Amersham Biosciences) and visualization by exposure to Hyperfilm (Amersham Biosciences). The primary antibodies were used rabbit anti-human ATF3 (c-19; Santa Cruz Biotechnology), anti α-actin (Sigma) and the secondary antibody was horseradish peroxidase-conjugated anti-mouse (Zymed Laboratories, South San Francisco, CA, USA) or anti-rabbit IgG (Amersham Biosciences).
2.12 Knockdown of ATF3 by Antisense Oligonucleotides
The sequences of the sense and antisense ATF3 phosphorothioate oligonucleotides were previously described [14]. The scrambled oligonucleotide for ATF3 was 5’- ACGCAGGTGTACTCGGACCA GAGTAGTTGT-3’. On days 0 and 2, cells were transfected with oligonucleotides using Lipofectamine 2000 according to the manufacturer’s protocol. Four days after transfection, ATF3 mRNA was measured by real-time RT-PCR and cell proliferation was measured by BrdU incorporation.
2.13 Statistical Analysis
Data are means ± SE of quadruplicate samples at least in single experiments and duplicate experiments as described in the figure legends. Student’s t-test was used for comparisons between two groups. Multiple group comparisons were performed by one-way ANOVA followed by the Tukey-Kramer multiple group comparisons test. All statistical analyses were performed using Statcel 2 software (OMS publishing, Saitama, Japan).
3. Results
3.1 FIR Irradiation Selectively Inhibits the Growth of Specific Cancer Cell Lines
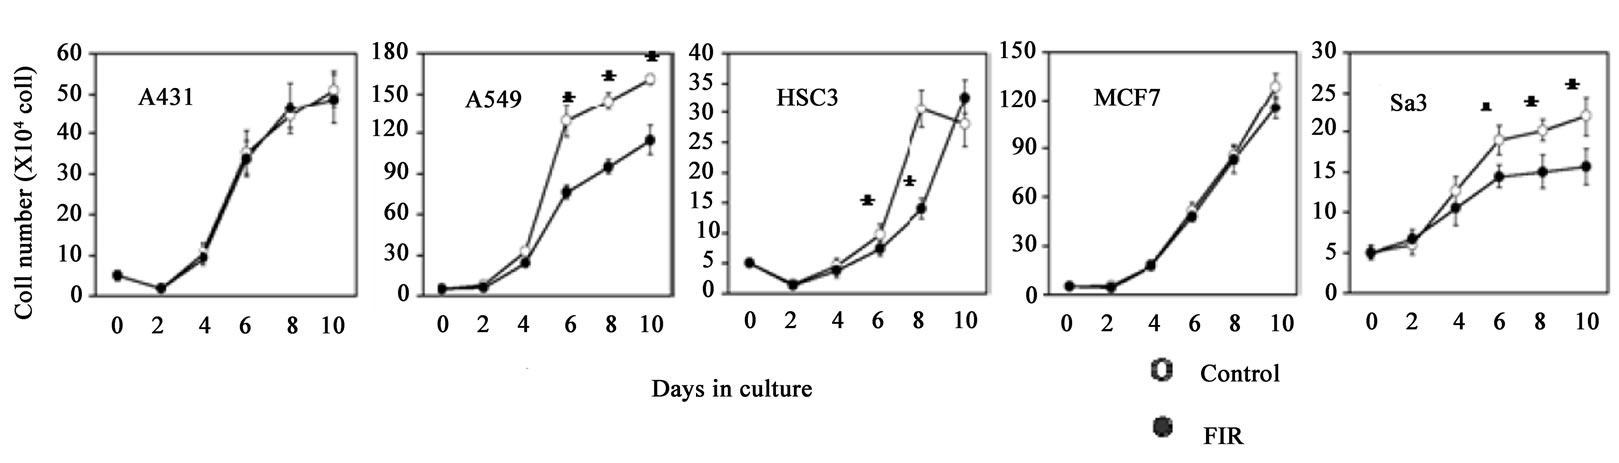
Although the proliferation of A549, HSC3 and Sa3 cells was significantly suppressed from day 6 of culture (59.0%, 75.4% and 76.2% respectively) up to at least day 10, FIR irradiation had little effect on the growth of A431 or MCF7 cells (Figure 1(a)). Measurement of BrdU incorporation on day 4 of culture also showed a significant suppression of growth by FIR irradiation in A549, HSC3 and Sa3 cells but not in A431 or MCF7 cells (Figure 1(b)). Observation of the morphology by phase contrast microscopy revealed that the cytoplasm and nucleus was enlarged in A549 cells. Some of the HSC3 cells also showed hypertrophy of the cytoplasm and nucleus and others tended to show atrophy. Finally, some of the Sa3 cells showed hypertrophy of the cytoplasm (Figure 1(c)).
 (a)
(a)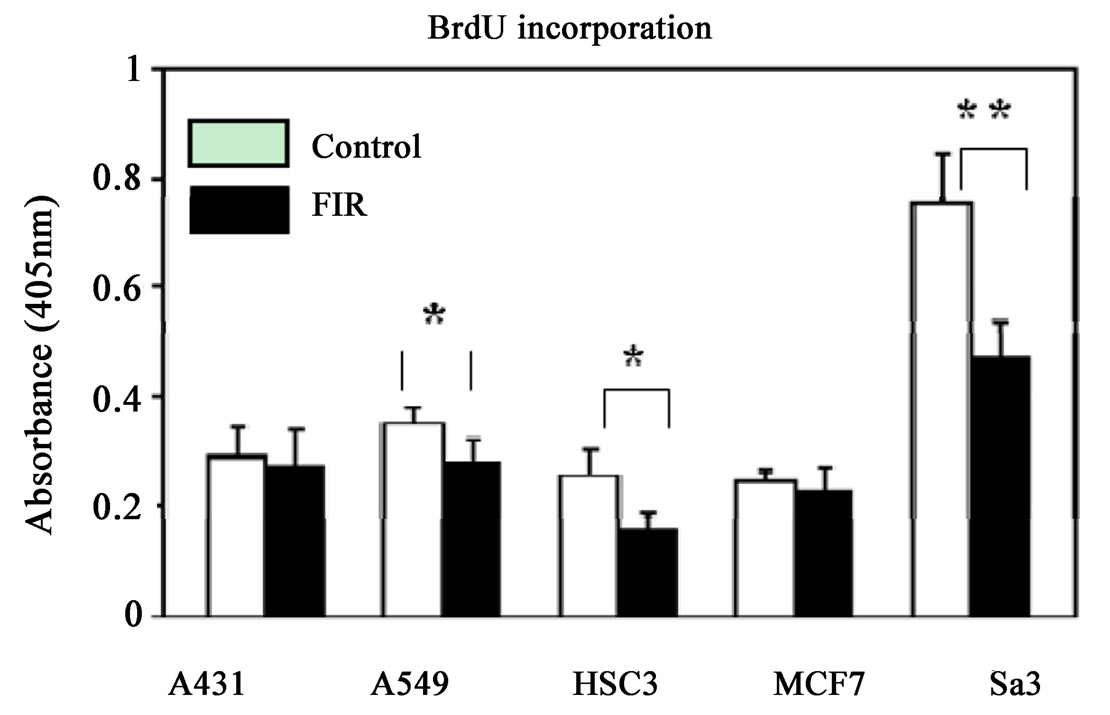 (b)
(b) (c)
(c)
Figure 1. (a) Effect of FIR irradiation on cell growth of five cancer cell lines. Cells (1 × 10⁵) were plated in 24-well dishes and cultured for 10 days. Cell numbers were counted every other day. Although proliferation of A549, HSC3 and Sa3 cells was suppressed from day 6 to 10 of culture, FIR irradiation had little effect on the proliferation of A431 and MCF7 cells. *P < 0.05 vs. control (unirradiated) cells; (b) BrdU incorporation assay on day 4 of culture. Cells (1 × 10⁴) cells were plated in 96-well dishes and cultured for 4 days, and BrdU incorporation was measured. FIR significantly suppressed the proliferation of A549, HSC3 and Sa3 cells. *P < 0.05, **P < 0.01 vs. control (unirradiated) cells; (c) Hematoxylin and eosin staining of cells on day 4 of culture. In A431 cells, there were no noticeable differences between irradiated and control (unirradiated) cells. In A549 and MCF7 cells, the volume of the cytoplasm and nucleus was increased in the FIR-treated cells. In HSC3 cells, some FIR-treated cells showed hypertrophy of the cytoplasm and nucleus (arrows), and others tended to show atrophy. Finally, hypertrophy was observed in some Sa3 cells (arrow heads). bar:0.5 mm
3.2 Limited FIR Induces G2/M Arrest in HSC3 and Sa3 cells
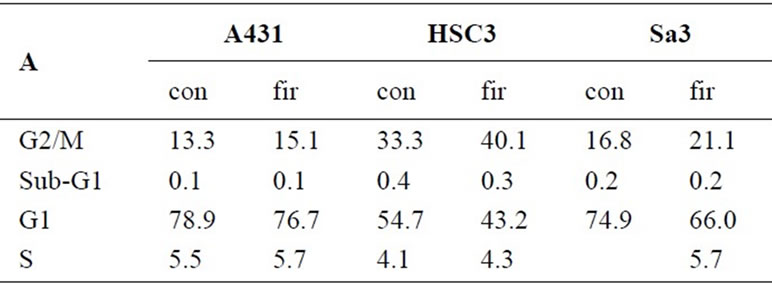
To determine whether FIR treatment of cancer cells alters cell cycle progression, we examined the A431, HSC3 and Sa3 cells by flow cytometry. In control cultures of HSC3 and Sa3 cells at 96 h, 54.7% and 74.9% of the cells were in G1 phase and 33.3% and 16.8% were in G2/M phase, respectively. In HSC3 and Sa3 cells treated with FIR, the fraction of cells in G1 decreased to 43.2% and 66.0% and the fraction in G2/M phase increased to 40.1% and 21.1%, respectively (Figure 2(a)). In A431 cells, the proportions in the different phases of the cell cycle were unaffected by FIR. The G2/G1 ratio in FIRtreated HSC3 was clearly higher than in the untreated (control) group and that in Sa3 cells was slightly higher in the FIR-treated cells than in the control cells (Figure 2(b)). Finally, in A431 cells, the G2/G1 ratio was not affected by FIR. These results suggest that FIR inhibits cell growth by inducing cell cycle arrest.
3.3 FIR Irradiation does not Induce Apoptosis
To determine whether the inhibition of proliferation by limited FIR was associated with apoptosis or necrosis,
 (a)
(a) (b)
(b)
Figure 2. (a) Flow cytometric analysis of the cell cycle in control (untreated) and FIR-irradiated cells. After doublethymidine block, cells were treated with FIR for 96 h, harvested, and DNA content was estimated by staining with PI; (b) Ratio of the G1 population vs. the G2/M population at 96 h
cancer cells were subjected to limited (48 h) FIR irradiation and analyzed on day 4 by staining with annexin V-FITC and PI (Figures 3(a) and (b)) and by TUNEL (TdT-mediated dUTP-biotin nick end labeling) (Figure 3(c)). These methods indicated that FIR did not induce apoptosis in A431, HSC3 or Sa3 cells. A few of the Sa3 cells showed significant necrosis. These results indicate that the inhibition of proliferation by FIR in cancer cells, particularly in HSC3 and Sa3 cells, was not due to apoptosis.
3.4 Genetic Analysis Reveals that ATF3 is a Potent Mediator of the Effects of FIR
We next examined the changes in gene expression induced by a 4-day irradiation with FIR using an Agilent Human cDNA microarray, in order to find a first reacted gene and the functional genes in early stage. Of the 19,000 genes examined, FIR caused a more than 1.5-fold change (P < 0.01) in the expression of 32, 166, 98, 33 and 34 genes in A431, A549, HSC3, MCF7 and Sa3 cells, respectively (Table 1). We made analysis on the 10 most up-regulated and 10 most down-regulated genes by FIR of these cell lines (data not shown). In addition, we searched for genes that were differentially expressed between the “FIR sensitive” group (A549, HSC3 and Sa3 cells) and the “less sensitive” group (A431 and MCF7 cells) (Figure 4). This analysis identified ATF3, BBC3 and PNRC1 as candidate mediators of the FIR effect. The expression of ATF3 was up-regulated by FIR in the FIR-sensitive group but unchanged by FIR irradiation in the less sensitive group. The expression of BBC3 and PNRC1 was unchanged by FIR in the FIR-sensitive group but was down-regulated in the less sensitive group. Of these three genes, we focused on ATF3 because it was reported to be up-regulated in response to various stresses [15] and to play a crucial role in the suppression of proliferation in HeLa cells [16].
3.5 Overexpression of ATF3 Suppresses Cell Proliferation in A431, HSC3 and Sa3 Cells
To verify the role of ATF3 in the effects of FIR, we developed A431, HSC3 and Sa3 cell lines stably expressing human ATF3 (A431-ATF3, HSC3-ATF3 and Sa3-ATF3 cells, respectively). Control cells were wild-type (A431 WT, HSC3 WT and Sa3 WT) and empty vector-transfected (A431 Neo, HSC3 Neo and Sa3 Neo) cells. To determine whether ncreased expression of ATF3 mRNA and protein were analyzed by Real-time RT-PCR and Western blot analysis (Figures 5(a) and (b)). The expressions of ATF3 mRNA were activated 1.7, 12.0 and 3.3 times in A431-ATF3, HSC3-ATF3 and Sa3-ATF3 cells, respectively comparing with Neo (Figure 5(a)). It was testified that protein expression was clearly activated (Figure 5(b)). Then, the cell proliferation of A431-ATF3
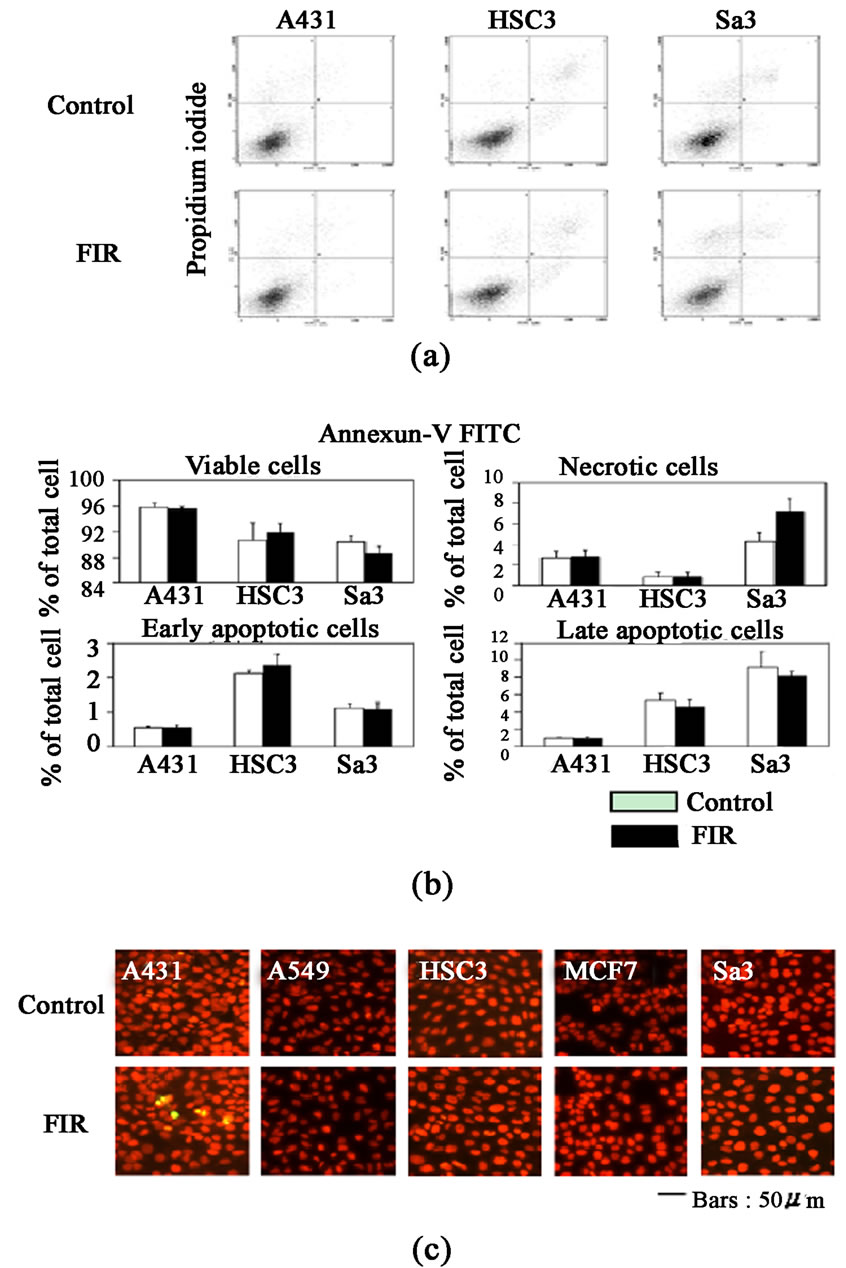
Figure 3. (a) Flow cytometric analysis of annexin V and PI staining of cells after 48 h of FIR irradiation. FIR irradiation of Sa3 cells caused the accumulation of annexin Vnegative/PI-positive necrotic cells; (b) Quantification of each cell category. Annexin V-negative/PI-negative cells were considered viable, annexin V-negative/PI-positive cells were considered necrotic, annexin V-positive/PI negative cells were considered early apoptotic, and annexin V-positive/PI-positive cells were considered late apoptotic. Columns indicate means of three independent experiments, and bars indicate the SD (Standard Deviation). *P < 0.05 vs. control (unirradiated) cells; (c) TUNEL staining of cancer cell lines on day 4. Photographs of apoptotic cells show green staining with orange-red PI counterstaining
was suppressed 31.0% on day 4, 38.2% on day 8 and 50.7% on day 10 comparing with A431 Neo (Figure 5(c)). The cell proliferation of HSC3-ATF3 was suppressed 54.1% on day 4, 47.8% on day 6, 48.4% on day 8 and 54.4% on day 10 comparing with HSC3 Neo (Figure 5(c)). The cell proliferation of Sa3-ATF3 was suppressed 35.1% on day 4 and 25.3% on day 10 comparing with Sa3 Neo (Figure 5(c)). Still more, HSC3-ATF3 and Sa3-ATF3 cells were induced hypertrophy (Figure 5(d)), whereas the morphology of A431-ATF3 cells was not affected by ATF3 overexpression.
4. An Antisense Oligonucleotide Targeting ATF3 Prevents Fir Suppression of Cell Growth
To confirm whether inhibition of ATF3 expression affected cell growth or not, we examined the effect of knocking down ATF3 using an antisense oligonucleotide on cell proliferation by BrdU assay. HSC3 cells were selected for this experiment, because they expressed the highest level of ATF3 following FIR irradiation in the five cell lines tested A431, HSC3, Sa3, A549 and MCF7 cells. The inhibition of ATF3 mRNA expression was made sure by real-time RT-PCR (Figure 6(a)). Antisense oligonucleotide AS1 (30 nucleotide from 5’ terminal of ATF3 mRNA) was inhibited 65.9% compared with LF (only Lipofectamine 2000) (Figure 6(a)). Then, Antisense oligonucleotide AS2 (30 nucleotides from 120 nucleotide to 150 nucleotide from 5’ terminal of ATF3 mRNA) was inhibited 65.9% compared with LF (only Lipofectamine 2000) (Figure 6(a)). The effect of ATF3
Table 1. Number of genes significantly regulated by FIR on day 4 of irradiation. Fold change indicates the relative expression in FIR irradiated vs. un-irradiated control cells. Genes were judged to be Up-regulated or Down-regulated based on log ratio that were 1.5 fold or greater

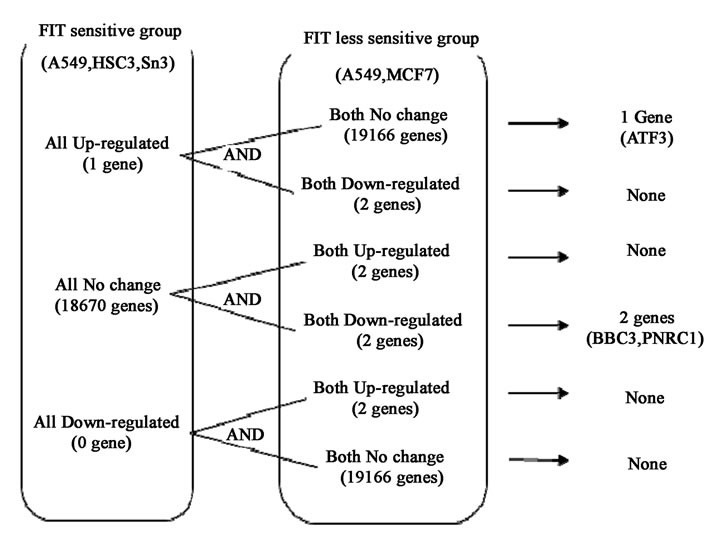
Figure 4. The five cell lines were divided into FIR-sensitive (A549, HSC3 and Sa3) and less sensitive groups (A431 and MCF7) according to the suppression of cell growth by FIR (using 80% of control as a threshold) on day 6 of culture. The genes differentially expressed in FIR-sensitive and the less sensitive groups were extracted. Genes were judged to be up-regulated or down-regulated when log ratios were 1.5 fold or greater
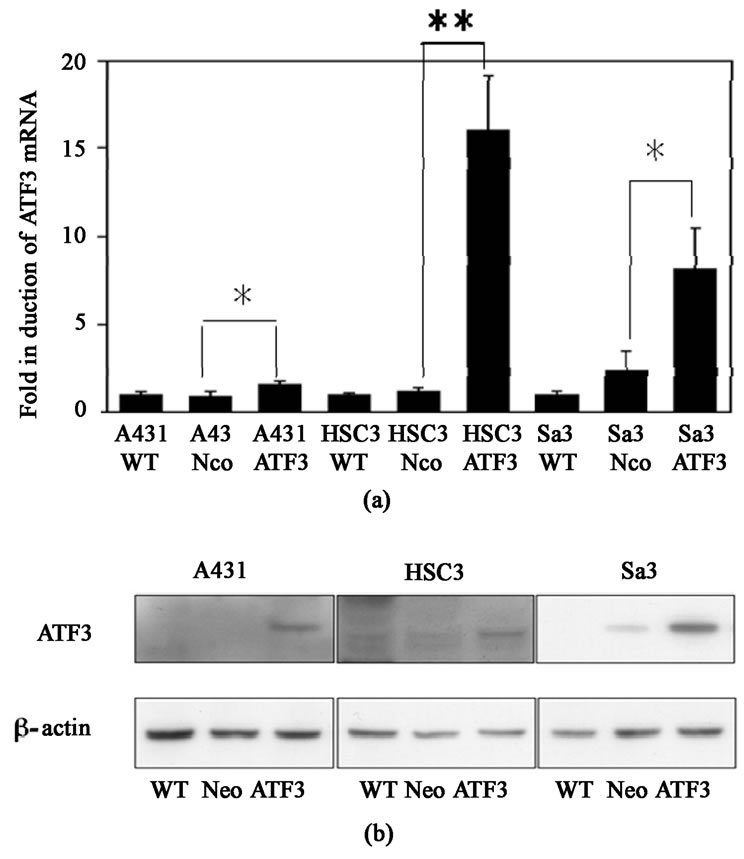
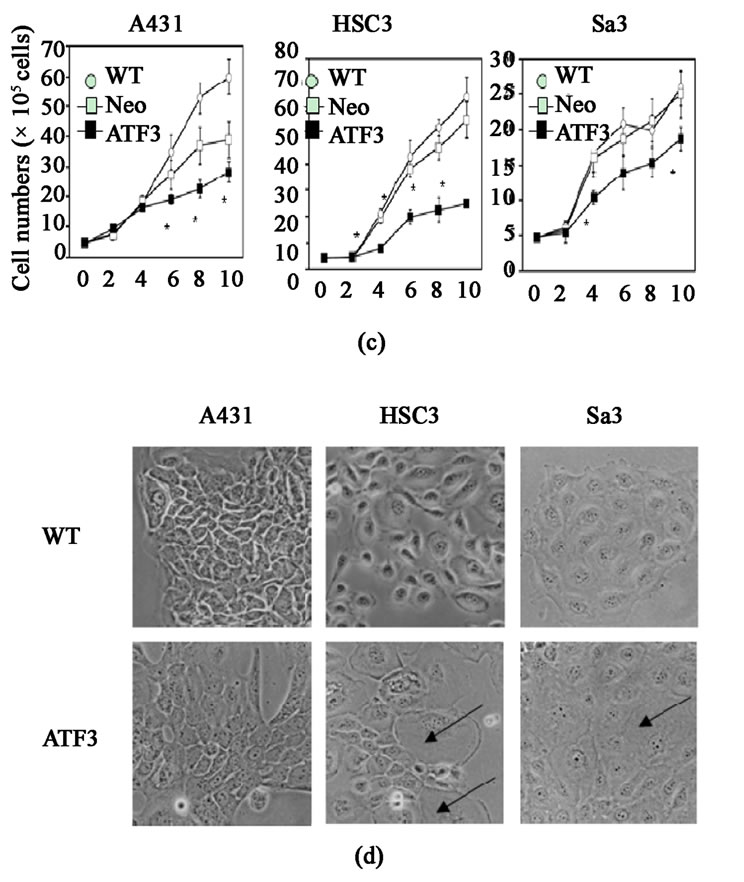
Figure 5. (a) Real-time RT-PCR analysis of ATF3 mRNA in wild-type (A431 WT, HSC3 WT and Sa3 WT), empty vector-transfected (A431 Neo, HSC3 Neo and Sa3 Neo), and ATF3-transfected (A431-ATF3, HSC3-ATF3 and Sa3-ATF3) cells. Values shown in vertical axis are the fold expression relative to wild-type cells and adjusted for actin. *P < 0.05 vs. empty vector-transfected cells; (b) Western blot analysis of ATF3 in wild-type, empty vector-transfected and ATF3- transfected cells; (c) Compared to empty vector-transfected cells, overexpression of ATF3 suppressed cell proliferation from day 6 in A431 cells and from day 4 in HSC3 and Sa3 cells. *P < 0.05 vs. empty vector-transfected cells; (d) Phase contrast image of ATF3-transfected cells. Overexpressing cells of ATF3 induced hypertrophy (arrows) in HSC3 and Sa3 cells
knockdown on proliferation was made sure by WST-1 assay. The effect of knocking down ATF3 using an antisense oligonucleotide on the cell proliferation of HSC3 cells was made sure by BrdU assay (Figure 6(b)). The proliferation of Anti-sense oligonucleotide AS1 cells was inhibited 47.1% by FIR, in the other side, it of LF cells was inhibited 59.4% by FIR (Figure 6(b)). Therefore, the effect of knocking down ATF3 suppressed 20.1% of the effect to inhibit the proliferation by FIR. Similarly, the proliferation of Anti-sense oligonucleotide AS2 cell was inhibited 45.9% by FIR, the effect of knocking down ATF3 suppressed 22.7% of the effect to inhibit the proliferation by FIR. Similar data were obtained in the other two types of cells (data not shown).
5. Discussion
In this study, we showed that FIR radiation suppresses the proliferation of A549, HSC3 and Sa3 cells. In HSC3 and Sa3 cells, this was due to G2 arrest. Two other cell lines, A431 and MCF7, showed almost no growth arrest in response to FIR radiation. A549 is from lung gland, HSC3 is from a tongue epithelium and Sa3 is from upper gingival squamous cell. A431 is from vulva epithelium and MCF7 is from mammary gland. The special characteristics on the cell source could not be found in these results.
We investigated the effect of FIR on gene expression using a DNA microarray and found that FIR radiation tended to induce RNA processing in FIR-sensitive cells, especially A549 and HSC3 cells, and to induce more down-regulated genes than up-regulated genes in all cells except for HSC3 cells (Table 1). These genes affected by FIR seemed to be contained many transcription factors and transcription regulating factors. Generally, it was suggested that the effects of FIR radiation do not promote gene transcription, but suppressed it. Thus, we thought the clue of lower proliferation of the FIR-sensitive cancer cells was the inhibition of cell cycle dependent genes, cause of apoptosis are not induced by FIR.
Formerly, we examined on the expression of the genes competing to the stress to find that the basal expression level of heat shock protein (HSP) 70A controlled the effect of FIR radiation [17]. In addition, it was reported that HSP70 is an antiapoptotic chaperone protein that inhibits mitochondrial release of cytochrome c and blocks procaspase-9 recruitment to the apoptosome complex [18,19]. According to our previously study, apoptosis in the FIR-insensitive MCF-7 and A431 cells relating to their high expression of HSP70A could not be induced. Furthermore, FIR didn’t induce apoptosis even in the FIR sensitive HSC3, Sa3 and A549 cells whether HSP70A expression in these cells is relatively lower. In current study, FIR was found to cause hypertrophy without apoptosis in all three sensitive cell lines, al-
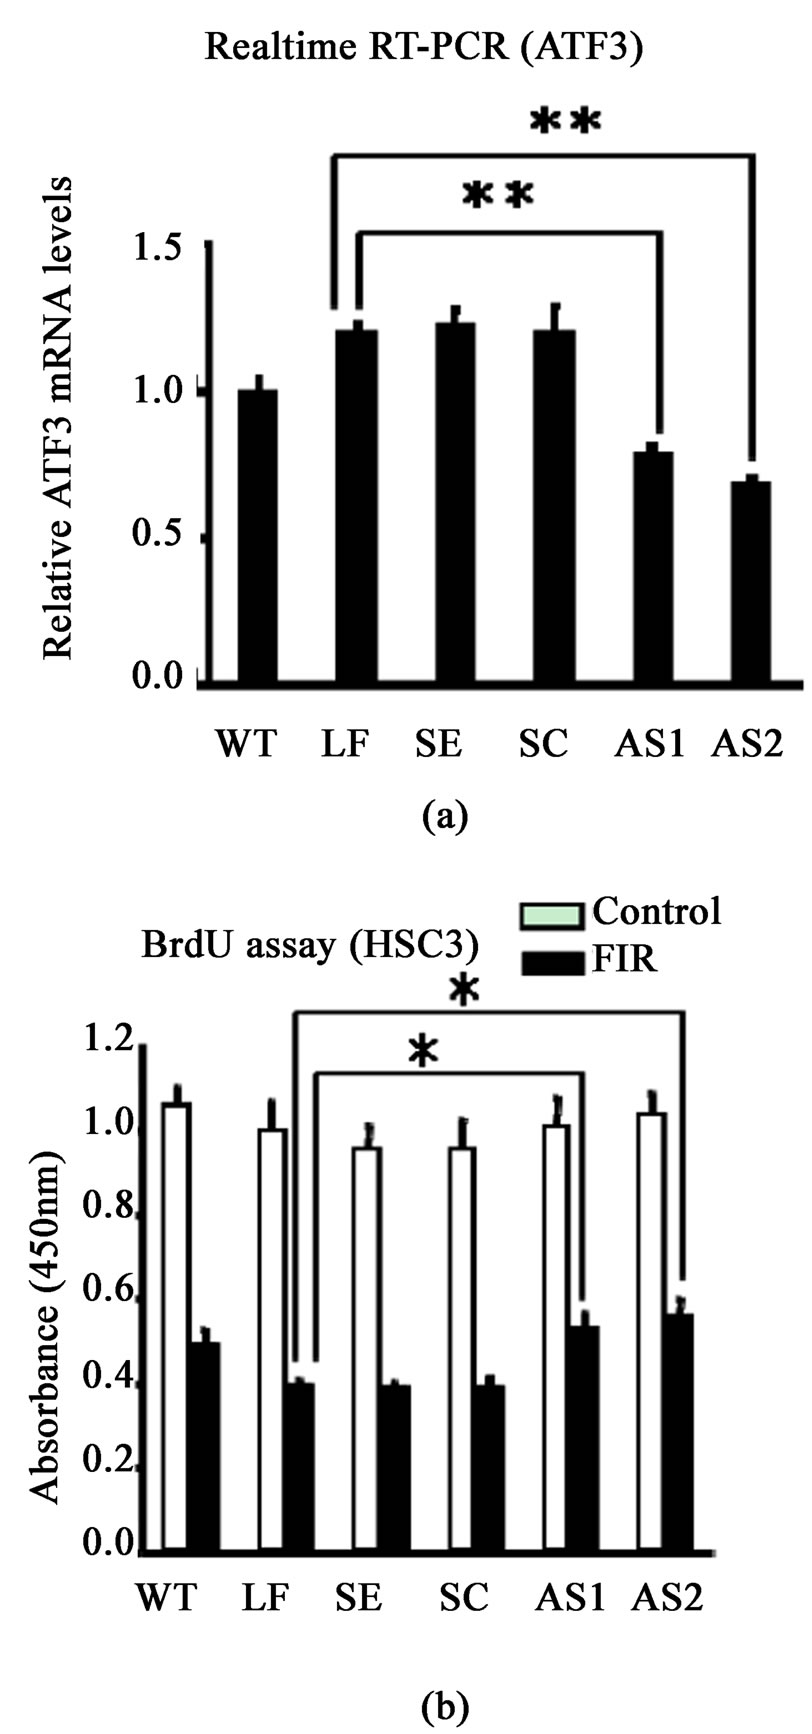
Figure 6. (a) The ATF3 mRNA expression was made sure by real-time RT-PCR of ATF3 in HS C3 cells of ATF3 knockdown on day 4. WT, wild-type cells; LF, only Lipofectamine 2000; SE, sense oligonucleotide; SC, scrambled oligonucleotide; AS1, antisense oligonucleotide 1 (30 nucleotide from 5’ terminal of ATF3 mRNA); AS2, antisense oligonucleotide 2 (30 nucleotides from 120 nucleotide to 150 nucleotide from 5’ terminal of ATF3 mRNA) (n = 3, **p<0.01); (b) The effect of ATF3 knockdown on proliferation of HSC3 cells was made sure by WST-1 assay (n = 6, *p<0.05)
though there was a slight increase of necrosis in the Sa3 cells. And the expression of apoptosis-related genes was not changed in the FIR-sensitive cells. For these findings we calculated there must be another anti-apoptotic mechanism and clue explanation except of HSP70A. Overall, FIR seemed to delay the cell cycle, cause changing in the cytoskeleton, and induce some necrosis without inducing apoptosis. It was suggested that FIR radiation did not directly induce apoptosis of cancer cells in vitro and this indication may be related of natural character of FIR.
Still more, we identified ATF3 as a gene whose expression correlated closely with the growth arrest by FIR. For this reason, the expression of ATF3 was up-regulated by FIR in the FIR-sensitive group but unchanged by FIR radiation in the less sensitive group providing by microarray analysis, thus we speculated ATF3 can be a mediator of FIR. Therefore, the expressions of ATF3 mRNA were activated 1.7, 12.0 and 3.3 fold times in A431-ATF3, HSC3-ATF3 and Sa3-ATF3 cells, respectively and the cell growth arrest effect of FIR is more activated comparing with the Neo-groups. In another hand, this repressor effect of FIR is significantly inhibited by using antisense oligonucleotide of ATF3. These results were supported by the current study, Udagawa et al., reported that the whole body hyperthermia with FIR inhibited the growth of spontaneous mammary tumors in mice [1], Teraoka et al., found that FIR at wavelengths between 4 to 16μm inhibits the growth of HeLa cells in vitro at 37°C [10] and by Fan et al., the overexpression of ATF3 has been previously shown to retard G1 to S phase progression in HeLa cells [16].
ATF3 is a member of the ATF/CREB family of transcription factors [20]. ATF3 mRNA and protein levels are relatively lower in most normal and quiescent cells [15,21,22]. ATF3 appears to participate in the JNK/ SAPK and IFN-PKR pathway [23,24] and activated by many variant of stimulation including cytokines, genotoxic agents, growth factors such as fibroblast growth factor, epidermal growth factor and hepatocyte growth factor, pro-apoptotic stimuli such as lypopolysaccharide, oxidative stress and compounds with antitumorigenic activities such as the phosphatidylinositol 3-kinase inhibitor LY294002, nonsteroidal antiinflammatory drugs, progesterone and dietary polyphenols as a curcumin from the tumeric plant and catechins in green tea [16,20,21, 25,26,27-33]. ATF3 also might be involved in homeostasis, wound healing, regenerating liver, cell adhesion, cancer cell invasion and apoptosis [21,22,34-38].
In our study, the expression of ATF3 has been keeping in the high level even in 4 days after the FIR treatment and staying at the one same level stably and continuously. Most results of the others on the expression level of ATF3 had shown immediate and transient [15,21,22,38]. For example, Fan et al., that treatment of RKO cells with 20 Gy of IR or 10 J•m-2 of UV light results in a rapid induction of ATF3 expression that peaks after 8 h and returns to the basal level within 24 or 36 h for IR and UV light, respectively [16], the induction of ATF3 mRNA and protein was peaked at 1h and 2 h after Doxorubicin treatment in cardiac myocytes [39], ATF3 mRNA is rapidly increased in 30 min after TNF-α stimulation in HUVECs and ATF3 protein was also induced with maximum accumulation in 4 h and involved TNF-α induced HUVECs apoptosis in atherosclerotic region [26,39]. Kawauchi et al., reported that the level of ATF3 increased within 4 h after TNF-α stimulation in HUVECs and protected HUVECs from TNF-α inducible cell death by down-regulating the activity of pro-apoptotic gene p53 [40], ATF3 is induced in ovarian cancer cell lines by progesterone after 4h of culture [31], the increase in ATF3 mRNA was evident in the earliest time point 4h and was maintained through 24 hours of curcumin treatment in some human cancer cell lines [32]. The difference of ATF3 induction period in our study might be related of natural character of FIR. Because FIR is not brither such some rays UV, IR and similarly to physiological response without cytotoxic reaction, and FIR has sub-lethal character, its energy is similar to intracellular molecular energy. Connectively with this notion, some stress stimuli such as anisomycin at a subinhibitory concentration can induce ATF3. Therefore anisomycin treatment stabilized ATF3 mRNA affecting to several AUUUA sequences, which have been demonstrated to destabilize mRNA [38,41-43]. Thus we speculated FIR also may affect to these sequences by similar mechanism as a anisomycin. It is provided any other precisely works. Surely, stably and continuously induction of ATF3 by FIR is caused of stimuli dependent. Our colleagues and others considered that the continuous expression of ATF3 may have a different function on the cells [36].
ATF3 acts as a transcriptional repressor as a homodimer, although the same protein functions as a transcriptional activator in heterodimeric form [38,43]. Then we propound the hypothesis, that ATF3 as a transcriptional repressor under the continuous expression can inhibit the activity of pro-apoptotic genes such a p53., etc [40] although many studies have shown ATF3 is proapoptotic gene [32,36]. In contrast, some works demonstrated that ATF3 is anti-apoptotic gene [26,39,40]. Recently, researchers concurred that ATF3 can play both pro-apoptotic and cell survival role depending on the type of stimulation and cell context [21,26,32,36,39]. In our study, there were shown the cell hypertrophy of FIR-sensitive cell lines without apoptosis. It may be related of stimuli context-FIR and can be explained ATF3 reacted little adaptive response by inducing of FIR in the cancer cells. Therefore, Okamoto et al., reported that ATF3 specifically in the heart under the control of the a-myosin heavy chain promoter have atrial enlargement, and atrial and ventricular hypertrophy similarly to our results providing that ATF3 can be a mediator of FIR. Actually, the cellular biology consists of complex mechanism. Thus only FIR may not induce apoptosis, because its character is sub-lethal. Farther, we should study the effect of FIR in vivo, because there will be the possible that FIR can induce cancer cell apoptosis in vivo. Really FIR will not induce cancer cell death, the cell growth arrest effect of FIR that is reported in currently study remarkably caused of suppression of cell growth.
Liang et al., noticed two main classes of binding sites are placed in the promoter of ATF3 gene. One is the inducible site such as the ATF/CRE, AP1 and NF-kB sites; the other is the site implicated in cell cycle regulation, such as the Myc/Max and E2F binding sites [20]. Certainly, ATF3 may play role on the cell cycle, because there are several relating sites on its promoter. This notion is supported by others study, that ATF3 has been shown to involve cell proliferation, invasion and other function by regulating own target genes such as Thrombospondin, Decorin, E-selectin, gluconeogenic enzymes, Gadd153/Chop10 and Osteocalcin via CREB/activator protein-1 (AP-1) motifs [34,37,44,45]. Thus we speculated FIR induced ATF3 as a its mediator on the sensitive groups of human cancer lines, farther ATF3 influenced to the proliferation of cancer cells by regulating its own target genes, which is attended on the cell cycle and arrested the G2/M phase in vitro. Our this intention is supported by these studies: First on the effect of FIR, Udagawa et al., reported that the whole body hyperthermia with FIR inhibited the growth of spontaneous mammary tumors in mice [1-3], Teraoka et al., found that FIR at wavelengths between 4 to 16μm inhibits the growth of HeLa cells in vitro at 37°C [10]. Second on the antitumorigenic function of ATF3, by Fan et al., have shown that the overexpression of ATF3 prolonged G1/S phase in HeLa cells, consistently to this study by Lu et al., the ATF3 can function the cell growth arrest in the G1/S phase by inhibiting cyclin D1, by Kang et al., ATF3 and Smad3 complex can inhibit the growth of cancer cells by repressing Id1. Third, ATF3 is induced by antitumourigenic agents including nonsteroidal antiinflammatory drugs, the phosphatidylinositol 3-kinase inhibitor LY- 294002, progesterone and dietary polyphenols as a curcumin from the tumeric plant and catechins in green tea [21,25,29-33].
On the theme of these works, we represented the possible molecular mechanism in our study (Figure 7). Our previously study also showed that the limited FIR inhibited growth, invasion and metastasis of human vulva A431epithelial cancer cells by significantly inhibiting the expression of matrix metalloproteinase (MMP) members MMP-1, MMP-9, MMP-10 and MMP-13 [9]. In the consistent, the MMP-2 gene expression which participates in cancer cell invasion is down-regulated by ATF3 via the suppression of p53 trans-activation on the MMP-2 promoterregion [46]. Stearns et al., have re-
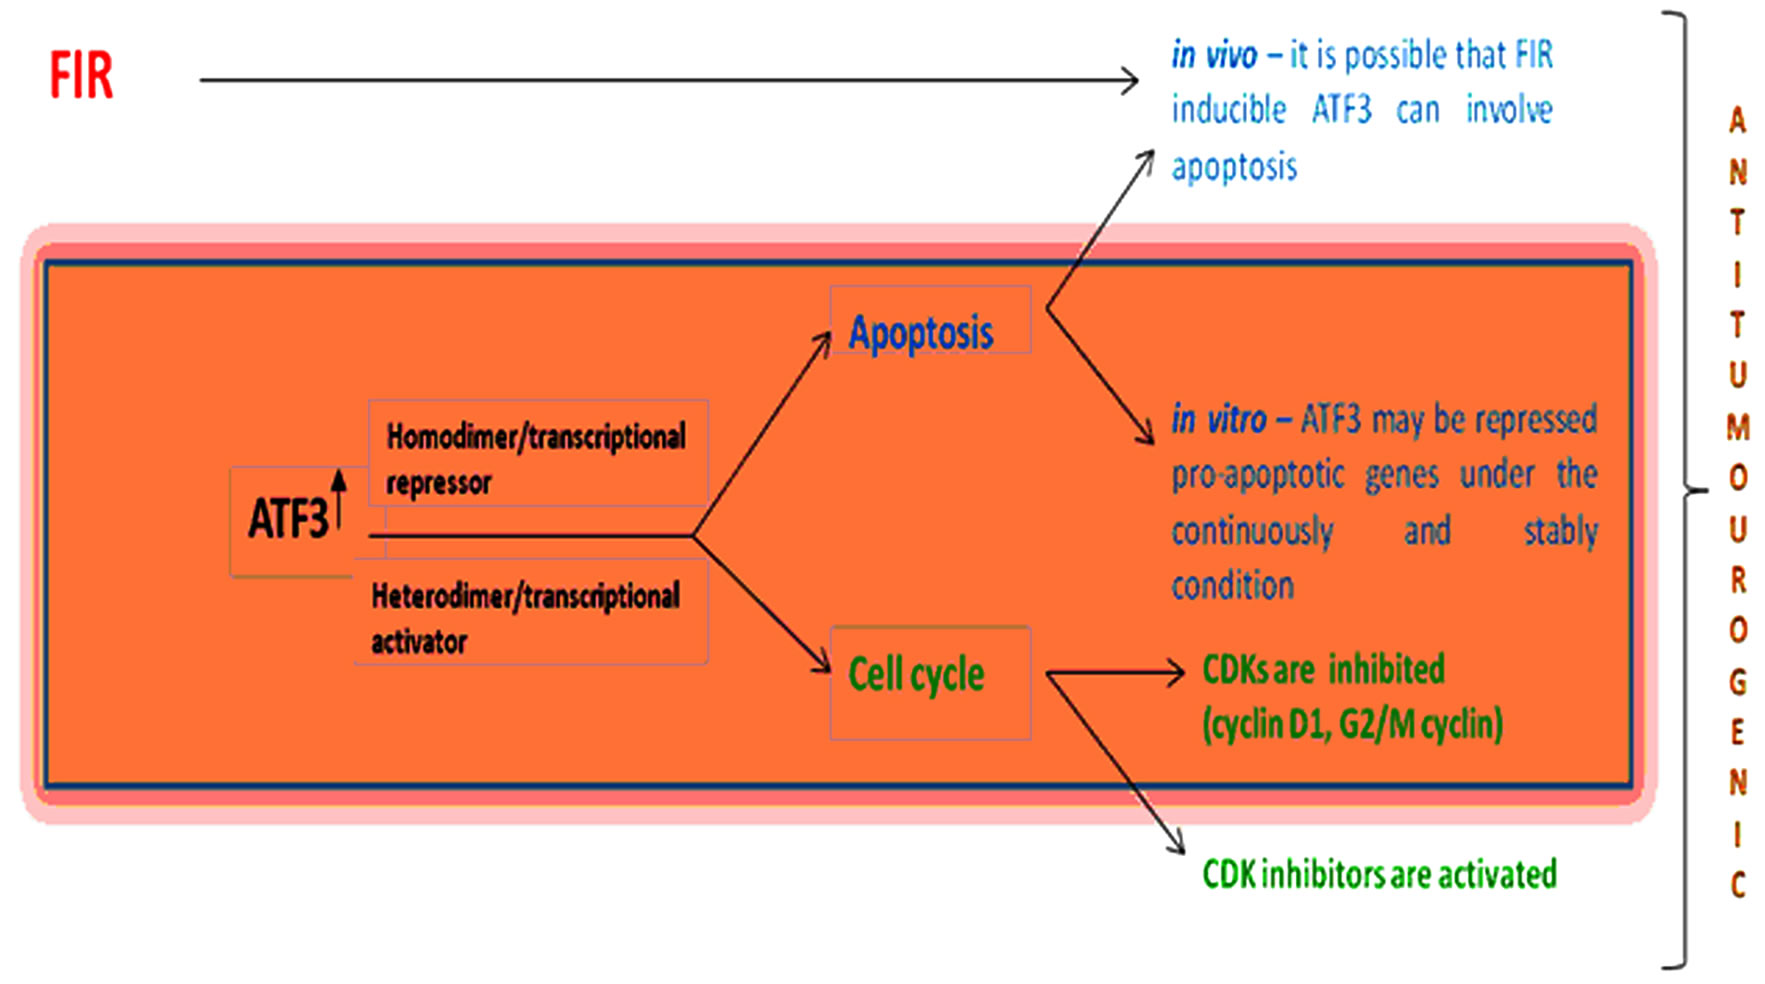
Figure 7. The speculation on the effect of FIR through affecting to ATF3 gene
ported recently that direct binding of ATF3 to the matrix metalloproteinase-2 (MMP-2) promoter leads to interleukin-10- mediated suppression of MMP-2.
Recent literatures indicated that some of the signals can induce ATF3 gene expression do not fit the conventional definition of stress signals [47] and ATF3 as an adaptive-response gene that participates in cellular processes to adapt to extraand/or intracellular changes [47, 48], although there are many studying works reported that ATF3 is a oncogene [22,49,50]. Actually, ATF3 enhances apoptosis in the untransformed MCF10A mammary epithelial cells (spontaneously immortalized mammary epithelial cell line), but protects the aggressive MCF10CA1a cells (high grade malignant cell line) and enhances its cell motility [51]. Similarly to this study, ATF3 is differentially expressed in the metastatic sublines of B16 melanoma but not in the parental B16 cells. Furthermore, introduction of ATF3 into the low metastatic B16 cells can convert it into high metastatic cells [52]. ATF3 was also reported recently to be highly expressed in classic Hodgkin’s lymphoma but not in the non-Hodgkin’s lymphoma, and blockade of ATF3 by siRNA reduced proliferation and viability of the Hodgkin’s lymphoma cells [53]
In conclusion, it was found that a body temperature range of FIR radiation inhibited proliferation of A549, HSC3 and Sa3 cells by G2/M arrest through enhancing the expression of ATF gene and induced cell hypertrophy without apoptosis. We also considered stably and continuously expression of ATF3 may play important roles in the effect of FIR by depending on stimuli context-FIR natural character. These findings can support that FIR may be a effective factor for treatment of cancer.
6. Acknowledgements
This research was supported, in part, by the following grants: Ministry of Economy, Trade and Industry, 41104503; Toseki Matera f19008001.
REFERENCES
- Y. Udagawa, H. Nagasawa and S. Kiyokawa, “Inhibition by Whole-Body Hyperthermia with Far-Infrared Rays of the Growth of Spontaneous Mammary Tumours in Mice,” Anticancer Research, 1999, Vol. 19, No. 5B, pp. 4125- 4130.
- Y. Udagawa and H. Nagasawa, “Effects of Combined Treatment with Coffee Cherry and Whole-Body Hyperthermia on the Growth of Spontaneous Mammary Tumours in SHN Mice,” In Vivo, Vol. 14, No. 3, 2000, pp. 431-435.
- Y. Udagawa, K. Inada and H. Nagasawa, “Inhibition by Single Whole-Body Hyperthermia with Glucose Administration of the Growth of Spontaneous Mammary Tumors in Mice,” Japanese Journal of Hyperthermic Oncology, 2000, Vol. 16, No. 4, pp. 229-236.
- H. Nagasawa, K. Inada, H. Ishigame, S. Kusakawa and Y. Udagawa, “Different Schedules of Whole-Body Hyperthermia with or without Glucose for the Inhibition of Mammary Tumors and Uterine Adenomyosis in SHN Mice,” Bulletin of the School of Agriculture, Meiji University, No. 127, 2001, pp. 43-51.
- Y. Udagawa and H. Nagasawa, “Effects of Far-Infrared Ray on Reproduction, Growth, Behaviour and Some Physiological Parameters in Mice,” In Vivo, Vol. 14, No. 2, 2000, pp. 321-326.
- H. Nagasawa, Y. Udagawa and S. Kiyokawa, “Evidence that Irradiation of Far-Infrared Rays Inhibits Mammary Tumour Growth in SHN Mice,” Anticancer Research, Vol. 19, No. 3A, 1999, pp. 1797-1800.
- S. Inoue and M. Kabaya, “Biological Activities Caused by Far-Infrared Radiation,” International Journal of Biometeorology, Vol. 33, No. 3, 1989, pp. 145-150.
- K. Honda and S. Inoue, “Sleep-Enhancing Effects of Far-Infrared Radiation in Rats,” International Journal of Biometeorology, Vol. 32, No. 2, 1988, pp. 92-94.
- H. Hosokawa, K. Yamashita, J. Ishibashi, N. Ishikawa, H. Morimoto, T. Ishikawa, S. Kitamura and M. Nagayama, “A New Animal Raiser: Effect of Limited Infrared Radiation on Tumor Growth of A431 Cells,” ITE Letters, Vol. 6, No. 6, 2005, pp. 597-602.
- F. Teraoka, Y. Hamada and J. Takahashi, “Bamboo Charcoal Inhibits Growth of HeLa Cells in Vitro,” dental materials journal, Vol. 23, No. 4, 2004, pp. 633-637.
- K. Yamashita, H. Hosokawa, J. Ishibashi, N. Ishikawa, H. Morimoto, T. Ishikawa, et al., “Development of CO2 Incubator with Limited Far-Infrared Radiation for Activation of Glucose Metabolism,” ITE Letters, Vol. 6, No. 5, 2005, pp. 53-57.
- Y. H. Yang, S. Dudoit, P. Luu, D. M. Lin, V. Peng, J. Ngai, et al., “Normalization for cDNA Microarray Data: A Robust Composite Method Addressing Single and Multiple Slide Systematic Variation,” Nucleic Acid Research, Vol. 30, No. 4, 2002, p. e15.
- H. Lowry, N. J. Rosebrough, A. L. Farr and R. J. Randall, “Protein Measurement with the Folin Phenol Reagent,” Journal of Biological Chemistry, Vol. 193, No. 1, 1951, pp. 265-275.
- C. Zhang, J. Kawauchi, M. T. Adachi, Y. Hashimoto, S. Oshiro, T. Aso, et al., “Activation of JNK and Transcriptional Repressor ATF3/LRF1 through the IRE1/ TRAF2 Pathway is Implicated in Human Vascular Endothelial Cell Death by Homocysteine,” Biochemical and Biophysical Research Communications, Vol. 289, No. 3, 2001, pp. 718-724.
- T. Hai, C. D. Wolfgang, D. K. Marsee, A. E. Allen and U. Sivaprasad, “ATF3 and Stress Responses,” Gene Expression, Vol. 7, No. 4-6, 1999, pp. 321-335.
- F. Fan, S. Jin, S. A. Amundson, T. Tong, W. Fan, H. Zhao, et al., “ATF3 Induction Following DNA Damage is Regulated by Distinct Signaling Pathways and Over-Expression of ATF3 Protein Suppresses Cells Growth,” Oncogene, Vol. 21, No. 49, 2002, pp. 7488-7496.
- J. Ishibashi, K. Yamashita, T. Ishikawa, H. Hosokawa, K. Sumida, M. Nagayama, et al., “The Effects Inhibiting the Proliferation of Cancer Cells by Far-Infrared Radiation (FIR) are Controlled by the Basal Expression Level of Heat Shock Protein (HSP) 70A,” Medical Oncology, in Press.
- M. C. Bonnet, R. Weil, E. Dam, A. G. Hovanessian and E. F. Meurs, “PKR Stimulates NF-kappaB Irrespective of its Kinase Function by Interacting with the IkappaB Kinase Complex,” Molecular and Cellular Biology, Vol. 20, No. 13, 2000, pp. 4532-4542
- O. Donzé, J. Deng, J. Curran, R. Sladek, D. Picard and N. Sonenberg, “The Protein Kinase PKR: A Molecular Clock that Sequentially Activates Survival and Death Programs,” EMBOJ, Vol. 23, No. 3, 2004, pp. 564-571
- G. Liang, C. D. Wolfgang, B. P. Chen, T. H. Chen and T. Hai, “ATF3 Gene,” Journal of Biological Chemistry, Vol. 271, No. 3, 1996, pp. 1695-1701.
- T. Hai and M. G. Hartman, “The Molecular Biology and Nomenclature of the Activating Transcription Factor/ cAMP Responsive Element Binding Family of Transcription Factors: Activating Transcription Factor Proteins and Homeostasis,” Gene, Vol. 273, No. 1, 2001, pp. 1-11.
- B. P. Chen, C. D. Wolfgang and T. Hai, “Analysis of ATF3: A Transcription Factor Induced by Physiological Stresses and Modulated by gadd153/Chop10,” Molecular and Cellular Biology, Vol. 16, No. 3, 1996, pp. 1157- 1168.
- S. Guerra, L. A. Lopez-Fernandez, M. A. Garcia, A. Zaballos and M. Esteban, “Human Gene Profiling in Response to the Active Protein Kinase, Interferon-Induced Serine/Threonine Protein Kinase (PKR), in Infected Cells. Involvement of the Transcription Factor ATF-3 IN PKR-Induced Apoptosis,” Journal of Biological Chemistry, Vol. 281, No. 27, 2006, pp. 18734-18742.
- K. Tamura, B. Hua, S. Adachi, I. Guney, J. Kawauchi, M. Morioka, et al., “Stress Response Gene ATF3 is a Target of c-myc in Serum-Induced Cell Proliferation,” EMBO Journal, Vol. 24, No. 14, 2005, pp. 2590-2601.
- K. Yamaguchi, S. H. Lee, J. S. Kim, J. Wimalasena, S. Kitajima and S. J. Baek, “Activating Transcription Factor 3 and Early Growth Response 1 are the Novel Targets of LY294002 in a Phosphatidylinositol 3-Kinase-Independent Pathway,” Cancer Research, Vol. 66, No. 4, 2006, pp. 2376-2384.
- T. Nawa, M. T. Nawa, M. T. Adachi, I. Uchimura, R. Shimokawa, K. Fujisawa, et al., “Expression of Transcriptional Repressor ATF3/LRF1 in Human Atherosclerosis: Colocalization and Possible Involvement in Cell Death of Vascular Endothelial Cells,” Atherosclerosis 2002, Vol. 161, No. 2, pp. 281-291.
- Y. Okamoto, et al., “Transgenic Mice with Cardiac-specific Expression of Activating Transcription Factor 3, a Stress-Inducible Gene, have Conduction Abnormalities and Contractile Dysfunction,” American Journal of Pathology, Vol. 159, No. 2, 2001, pp. 639-650.
- G. Liang, C. D. Wolfgang, B. P. Cheng, T. H. Cheng and T. Hai, “ATF3 Gene,” Journal of Biological Chemistry, Vol. 271, No. 3, 1996, pp. 1695-1701.
- M. R. Thompson, D. K. Xu, et al., “ATF3 Transcription Factor and its Emerging Roles in Immunity and Cancer,” Journal of Molecular Medicine, Vol. 87, No. 11, 2009, pp. 1053-1060.
- F. G. Bottone, Jr, J. M. Martinez, J. B. Collins, C. A. Afshari and T. E. Eling, “Gene Modulation by the Cyclooxygenase Inhibitor, Sulindac Sulfide, in Human Colorectal Carcinoma Cells: Possible Link to Apoptosis,” Journal of Molecular Medicine, Vol. 278, No. 28, 2003, pp. 25790-25801.
- V. Syed, K. Mukherjee, J. Lyons-Weiler, K.-M. Lau, T. Mashima, T. Tsuruo and S.-M. Ho, “Identification of ATF-3, Caveolin-1, DLC-1 and NM23-H2 as Putative Antitumorigenic, Progesterone-Regulated Genes for Ovarian Cancer Cells by Gene Profiling,” Oncogene, Vol. 24, No. 10, 2005, pp. 1774-1787.
- C. Yan, S. Jamaluddin, B. Aggarwal, J. Myers and D. Douglas, “Gene Expression Profiling Identifies Activating Transcription Factor 3 as a Novel Contributor to the Proapoptotic Effect of Curcumin,” Molecular Cancer Therapeutics, Vol. 4, No. 2, 2005, pp. 233-241.
- S. J. Baek, J. S. Kim, F. R. Jackson, T. E. Eling, M. F. McEntee and S. H. Lee, “Epicatechin Gallate-Induced Expression of NAG-1 is Associated with Growth Inhibition and Apoptosis in Colon Cancer Cells,” Carcinogenesis, 2004, Vol. 25, No. 12, pp. 2425-2432.
- E. Allen-Jennings, M. G. Hartman, G. J. Kociba and T. Hai, “The Roles of ATF3 in Glucose Homeostasis. A transgenic Mouse Model with Liver Dysfunction and Defects in Endocrine Pancreas,” Journal of Biological Chemistry, Vol. 276, No. 31, 2001, pp. 29507-29514.
- T. Ishigiro, H. Nagawa, et al., “Inhibitory Effect of ATF3 Antisense Oligonucleotide on Ectopic Growth of HT29 Human Colon Cancer Cells,” Japanese Journal of Cancer Research, Vol. 91, No. 8, 2000, pp. 833-836.
- T. Mashima, S. Udagawa and T. Tsuruo, “Involvement of Transcriptional Repressor ATF3 in Acceleration of Caspase Protease Activation during DNA Damaging AgentInduced Apoptosis,” Journal of Cellular Physiology, Vol. 188, No. 3, 2001, pp. 352-358.
- C. D. Wolfgang, B. P. Chen, J. L. Martindale, N. J. Holbrook and T. Hai, “gadd153/Chop10, a Potential Target Gene of the Transcriptional Repressor ATF3,” Molecular Cell Biology, Vol. 17, No. 11, 1997, pp. 6700-6707.
- J. C. Hsu, T. Laz, K. L. Mohn and R. Tau, “Identification of LRF-1, a Leucine-Zipper Protein that is Rapidly and Highly Induced in Regenerating Liver,” Proceedings of the National Academy Sciences U S A, Vol. 88, No. 9, 1991, pp. 3511-515.
- K. Nobori, H. Ito, M. Tamamori-Adachi, S. Adachi, Y. Ono, J. Kawauchi, S. Kitajima, F. Marumo and M. Isobe, “ATF3 Inhibits Doxorubicin-Induced Apoptosis in Cardiac Myocytes: A Novel Cardioprotective Role of ATF3,” Journal of Molecular and Cellular Cardiology, Vol. 34, No. 10, 2002, pp. 1387-1397.
- J. Kawauchi, C. Zhang, K. Nobori, Y. Hashimoto, M. T. Adachi, A. Noda, et al., “Transcriptional Repressor Activating Transcription Factor 3 Protects Human Umbilical Vein Endothelial Cells from Tumor Necrosis Factor-Alpha-Induced Apoptosis through Down-Regulation of p53 Transcription,” Journal of Biology Chemistry, 2002, Vol. 277, No. 41, pp. 39025-39034.
- G. Brawerman, “mRNA Decay: Finding the Right Targets,” Cell, Vol. 57, No. 1, 1989, pp. 9-10.
- C. A. Beelman and R. Parker, “Degradation of mRNA in Eukaryotes,” Cell, Vol. 81, No. 2, 1995, pp. 179-183.
- B. P. Chen, G. Liang, J. Whelan and T. Hai, “ATF3 and ATF3 yZip. Transcriptional Repression Versus Activation by Alternatively Spliced Isoforms,” Journal of Biological Chemistry, Vol. 269, No. 22, 1994, pp. 15819- 15826.
- S. Perez, E. Vial, H. Van Damm and M. Castallazzi, “Transcription Factor ATF3 Partially Transforms Chick Embryo Fibroblasts by Promoting Growth Factor-Independent Proliferation,” Oncogene, 2001, Vol. 20, No. 9, pp. 1135-1141.
- T. Nawa, M. T. Nawa, Y. Cai, C. Zhang, I. Uchimura, S. Narumi, F. Numano and S. Kitajima, ”Repression of TNF-Alpha-Induced E-Selectin Expression by PPAR Activators: Involvement of Transcriptional Repressor LRF-1/ ATF3,” Biochemical and Biophysical Research Communication, Vol. 275, No. 2, 2000, pp. 406-411.
- C. Yan, H. Wang and D. D. Boyd, “ATF3 Represses 72-kDa Type IV Collagenase (MMP-2) Expression by Antagonizing p53-Dependent Trans-Activation of the Collagenase Promoter,” Journal of Biology Chemistry, Vol. 277, No. 13, 2002, pp. 10804-10812.
- T. Hai, “The ATF Transcription Factors in Cellular Adaptive Responses,” In: J. Ma, Ed., Gene Expression and Regulation, Higher Education Press, Beijing, 2006, pp. 322-333.
- D. Lu, C. D. Wolfgang and T. Hai, “Activating Transcription Factor 3, a Stress-Inducible Gene, Suppresses Ras-Stimulated Tumorigenesis,” Journal of Biology Chemistry, Vol. 281, No. 15, 2006, pp. 10473-1048.
- M. Matsumoto, M. Minami, K. Takeda, Y. Sakao and S. Akira, “Ectopic Expression of CHOP (GADD153) Induces Apoptosis in M1 Myeloblastic Leukemia Cells,” FEBS Letters, Vol. 395, No. 2-3, 1996, pp. 143-147.
- K. Tamura, B. Hua, S. Adachi, I. Guney, J. Kawauchi, M. Morioka, M. Tamamori-Adachi, Y. Tanaka, Y. Nakabeppu, M. Sunamori, J. Sedivy and S. Kitajima, “Stress Response Gene ATF3 is a Target of c-myc in Serum-Induced Cell Proliferation,” The EMBO Journal, Vol. 24, 2005, pp. 2590-2601.
- X. Yin, J. W. DeWille and T. Hai, “A Potential Dichotomous Role of ATF3, an Adaptive-Response Gene, in Cancer Development,” Oncogene, Vol. 27, No. 15, 2008, pp. 2118-2127.
- T. Ishiguro, M. Nakajima, M. Naito, T. Muto and T. Tsuruo, “Identification of Genes Differentially Expressed in B16 Murine Melanoma Sublines with Different Metastatic Potentials,” Cancer Research, 1996, Vol. 56, pp. 875-879.
- M. Janz, M. Hummel, M. Truss, B. Wollert-Wulf, S. Mathas, K. Jöhrens, C. Hagemeier, K. Bommert, H. Stein, D. Dörken and R. C. Bargou, “Classical Hodgkin Lymphoma is Characterized by High Constitutive Expression of Activating Transcription Factor 3 (ATF3), Which Promotes Viability of Hodgkin/Reed-Sternberg Cells,” Blood, Vol. 107, 2006, pp. 2536-2539.