Int'l J. of Communications, Network and System Sciences
Vol. 5 No. 4 (2012) , Article ID: 18524 , 5 pages DOI:10.4236/ijcns.2012.54031
Radar Signal Recognition by CWD Picture Features
DCCS Laboratory, Department of Electrical Engineering, Iran University of Science and Technology, Tehran, Iran
Email: {erfantavakoli, afalahati}@elec.iust.ac.ir
Received February 12, 2012; revised March 12, 2012; accepted March 27, 2012
Keywords: pulse compression; radar; spectrum management; signal recognition
ABSTRACT
In this paper a system for automatic recognition of radar waveform is introduced. This technique is used in many spectrum management, surveillance, and cognitive radio and radar applications. For instance the transmitted radar signal is coded into six codes based on pulse compression waveform such as linear frequency modulation (LFM), Frank code, P1, P2, P3 and P4 codes, the latter four are poly phase codes. The classification system is based on drawing Choi Willliams Distribution (CWD) picture and extracting features from it. In this study, various new types of features are extracted from CWD picture and then a pattern recognition method is used to recognize the spectrum. In fact, signals from CWD picture are defined using biometric techniques. We also employ false reject rate (FRR) and false accept rate (FAR) which are two types of fault measurement criteria that are deploy in biometric papers. Fairly good results are obtained for recognition of Signal to Noise Ratio (−11 dB).
1. Introduction
Sharp sensing of the frequency spectrum and the signal perimeter and diagnosing any signal used for the future of communications spectrum sensing systems and radars are important and effective. The increased use of communication signals in diverse areas such as TV, radar, radio, etc. has necessitated optimal utilization of the frequency spectrum. In [1], automatic radar waveform method is used for electronic waveform (EW) diagnosis, and application of spectrum management comprising diagnosis and analysis methods. This method of diagnosis is composed of a structure of the impact of jamming response and the structure of emission of the radar and cognitive-radio waveforms. In the radar area, an atomic decomposition (AD) method has been examined on the basis of intercepted radio signal and the diagnostic method of radar signals. This method befits linear frequency modulation (LFM) [2]. In [3], this method has been extended by expectation maximization (EM) method. A similar method exists in the aforementioned [4], which has been presented by short time Fourier transform (STFT). Both intercepting methods exhibit a small number of waves. Article [1] considers a method of diagnosis and classification of intercepted radar signal on the basis of pulse compression waveform. In this article, Jarmo Lunden has made an attempt to deal with this compressed signal along with pattern recognition. In these methods, features are extracted from the specified codes, but Jarmo Lunden did not extract enough number of signals from CWD picture, and most of his features were derived from the spectrum signal. Here, more signal features are extract from CWD picture.
In this present manuscript, signal diagnosis system is based on diagnosis and classification of the pulse code founded on signal that is classified into six codes known as LFM, Frank, P1, P2, P3 and P4 poly phase codes as shown in Figure 1.
According to Figure 1, a known signal, say sin(x), sinc(x) and etc. is first selected. In the next step the coding procedure is followed, i.e. the explained signal is now converted to one of the given codes. These codes are explained in [5-7]. In fact, this signal should be changed into one code for transmission via carrier frequency and the channel is an AWGN channel.
The receive signal is formulated in following:
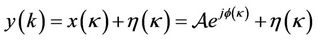 (1)
(1)
where  and
and  are the complex envelope of one received coded signal and the coded received signal transformed respectively; and
  is the assumed AWGN noise.
  is a signal amplitude, and
  is the instantaneous received signal phase. The signal including the periodic coded signal has been emitted a single intercepted radar signal.
To draw the CWD picture, a method discovered by choi and William can be developed [8]. In fact, their method introduces pattern recognition classification techniques to be used for recognizing the received signal.
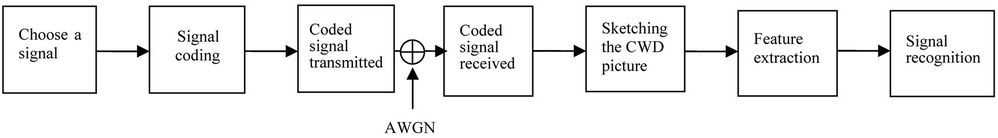
Figure 1. A signal recognition channel.
Choi and Williams put forward a method for drawing CWD picture, and then suggested that pattern recognition classification methods be used for recognizing their signals.
In 2007, Jarmo Lunden extracted the coded signal using a feature of CWD picture [1], but he had some problems, the most important of which is the number extracted features from the CWD picture and applying other features for extraction. In this current paper, the authors attempt to extract more features from the CWD picture only.
For plotting CWD picture the following relation can be performed [5,8].
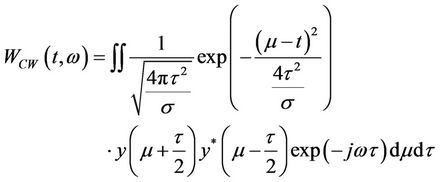 (2)
(2)
And the following relation is employed to plot CWD picture as [8]:
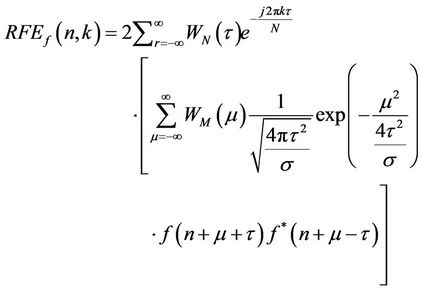 (3)
(3)
Figure 2 shows the CWD graph for SNR = 6 dB.
2. The Proposed Feature Extracting Model
In this section a variety of features which are extracted from CWD picture are examined. We have derived twenty different features using the CWD picture. These features are similar to the biometric features and are categorized into four groups [9-12].
Features extracted from the extreme points, features extracted that are related to the pixel counts, features that are resulted from the histogram, features that describe the intended pixel before extracting features we should define the edge of the pictures as shown in Figure 3.
In this proposed method, primarily, the most right or left extremes and the lowest point could be determined as shown in Figure 4.
Following are the explanations concerned for the above four extaction feature methods
A) Features extracted from the extreme points.
1) Width: difference between the right extreme and the left extreme;
2) Height: difference between the highest point and the lowest point;
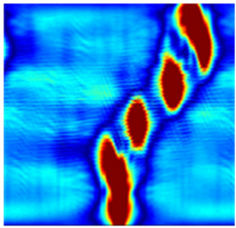
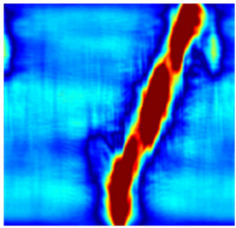
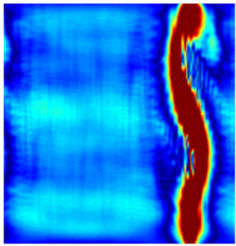
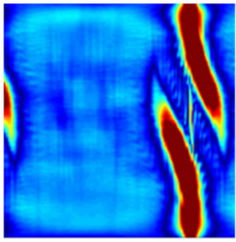
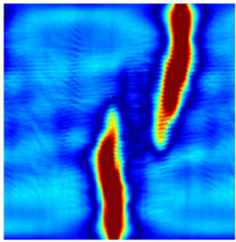
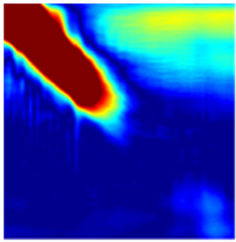
P1 and N = 4;P2 and N = 4;P3 and ρ = 16;P4 and ρ = 16;LFM and ρ = 16;Frank and N = 4;
Figure 2. The CWD graph for SNR = 6 dB.
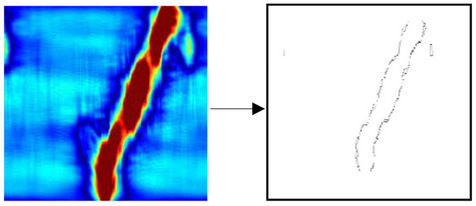
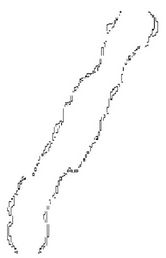
Figure 3. The left picture is for P1 code for SNR = 6 dB and the right picture is the edge of the picture.
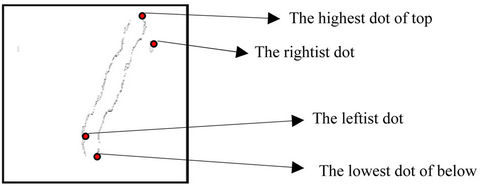
Figure 4. Extraction points consider as required features.
3) Left-to-right span: the Euclidian distance between the left extreme and the right extreme;
4) Highest-to-Lowest span: the Euclidian distance between the highest point and the lowest point;
5) Area: an area which is obtained through multiplying by the height;
6) Height-to-Width ratio.
B) Features that are resulted from the histogram.
1) Maximum value of histogram;
2) Minimum value of histogram;
3) Number of maximum local vertical values of the pixels for which the vertical value is more than the value for horizontal value that have been divided by 2;
4) Number of maximum local horizontal values of the pixels for which the horizontal value is more than the value for vertical value that have been divided by 2.
Vertical and horizontal histogram for P1 code in SNR = 6 dB is shown in Figure 5.
C) Features extracted that are related to the pixel counts.
In this section is determined the coordination points of the CWD diagram edges as shown in Figure 3.
D) Features that describe the intended pixel.
1) Total value of the X-axis coordination points;
2) Total value of Y-axis coordination points;
3) The horizontal gravity center of the diagram is described using 4;
4) The vertical gravity center of the diagram is described using 5 as:
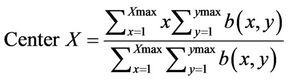 (4)
(4)
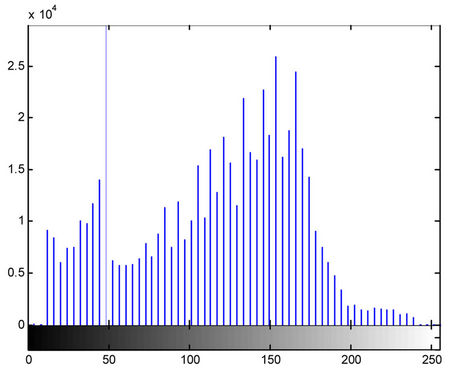 (a)
(a)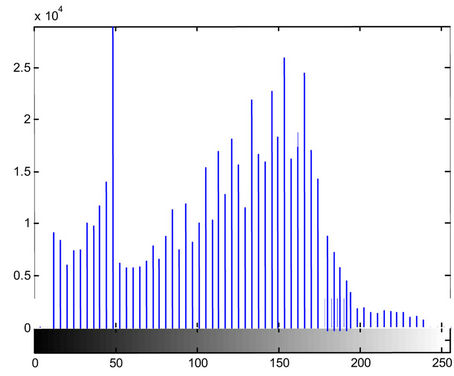 (b)
(b)
Figure 5. Vertical and horizontal for P1 code in SNR = 6 db. (a) Vertical histogram for P1 code in SNR = 6 dB; (b) Horizontal histogram for P1 code in SNR = 6 dB.
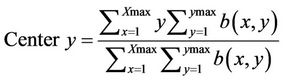 (5)
(5)
A Relation to Fisher’s Linear Discriminant employed to recognize the signal [13,14].
3. Simulation Results
Normal FAR, FRR are used to define the errors observed in many studied biometric papers. In this paper we want to use FAR and FRR for signal recognition but first of all we have to use a data base for recognizing the signal to sketch CWD picture for each group given in table 1.
It is found appropriate to explain FRR and FAR false as:
False Accept Rate (FAR): If, a signal is not a real one (false accept), this signal will erroneously be regarded by the system as part of the intended signals. This error is naturally a too much, one which should be small as much as possible [15].
False Reject Rate (FRR): If, a signal is real and the system wrongly treats it as part of the unreal signals, it is a minor error and yet needs to be corrected as well [15].
In this section five instance pictures for each code is picked and they are (−3, 0, 3, 6, 9) dB then we choose four instance pictures say (−3, 0, 3, 6) dB and for the third attempt three instance pictures (0, 3, 6) dB are chosen.
Considering Figures 6-8, it can be observed that, when the number of instances are raised, better efficiency
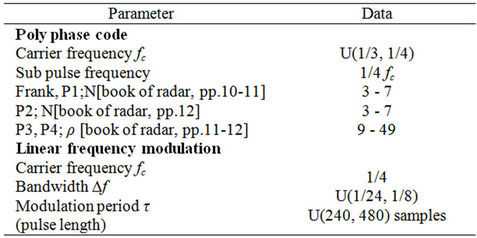
Table 1. simulation parameters, U(0,0) denote a uniform distribution [1].
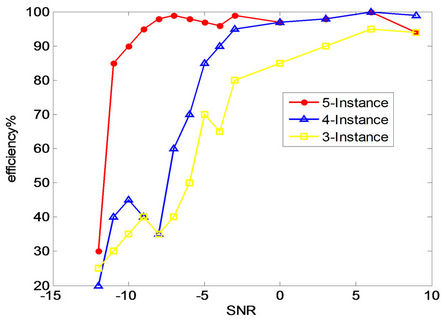
Figure 6. The recognition correction efficiency for various SNRs.
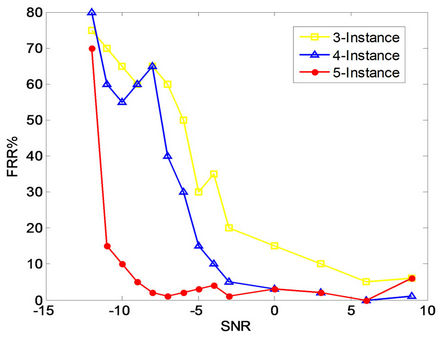
Figure 7. The system FRR error for various SNRs.
is obtained and FRR, FAR are decreased. For five instances a good efficiency of −12 dB is eminent.
The reason why better efficiency under −12 dB is not sufficient can be observed by Figures 9(a)-(c).
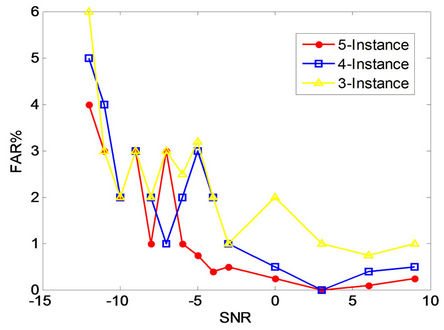
Figure 8. The system FAR error for various SNRs.
 (a)
(a)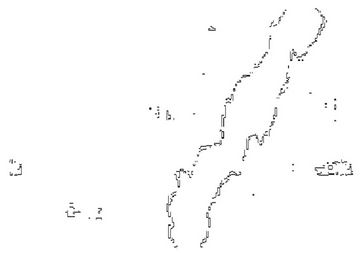 (b)
(b)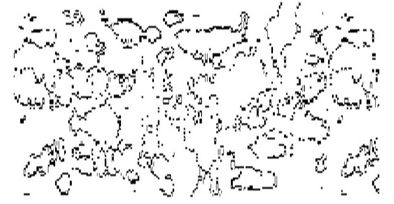 (c)
(c)
Figure 9. The pictures edges for various values of SNR. (a) P1 code with SNR = 9 dB; (b) P1 code with SNR −3 dB; (c) P1 code with SNR −15 dB.
It can be concluded that when the SNR decreases, the CWD picture become irregular and so the picture noise is increased.
4. Conclusions
In this paper, a radar signal is recognized by CWD picture. This is performed for the first time by the two signal fault recognition criteria FAR, FRR. These criteria’s are normally employed for biometric phenomena in this paper after the drawing of CWD picture of the signal a number of features are extracted which are called biometric features. These features can then be employed by the radar for the signal recognition. Indeed, the results obtained here with five instances from the coded signal are recognized with −11 dB with CWD pictures which under this value the picture is totally with noise.
We use CWD graph to recognize the signal. In this study we use biometric technique to recognize the signal. We also recognize −11 dB signal and we use FRR and FAR false for the system these kinds of false were used in biometric techniques.
REFERENCES
- J. Lundén, “Automatic Radar Waveform Recognition,” IEEE Journal of Selected Topics in Signal Processing, Vol. 1, No. 1, 2007, pp. 124-136. doi:10.1109/JSTSP.2007.897055
- G. López-Risueño, J. Grajal and O. Yeste-Ojeda, “Atomic Decomposition-Based Radar Complex Signal Interception,” Proceedings of Institution of Electrical Engineers, Radar, Sonar and Navigation, Vol. 150, No. 4, 2003, pp. 323-331.
- G. López-Risueño and J. Grajal, “Multiple Signal Detection and Estimation Using Atomic Decomposition and EM,” IEEE Transactions on Aerospace and Electronic System, Vol. 42, No. 1, 2006, pp. 84-102. doi:10.1109/TAES.2006.1603407.
- G. López-Risueño, J. Grajal and Á. Sanz-Osorio, “Digital Channelized Receiver Based on Time-Frequency Analysis for Signal Interception,” IEEE Transactions on Aerospace and Electronic System, Vol. 41, No. 3, 2005, pp. 879-898. doi:10.1109/TAES.2005.1541437
- P. E. Pace, “Detecting and Classifying Low Probability of Intercept Radar,” 2nd Edition, Artech House, Norwood, 2004.
- M. Skolnik “Radar Handbook,” 3rd Edition, McGraw-Hill, Boston, 1990.
- B. L. Lewis, F. F. Kretschmer Jr. and W.W. Shelton, “Aspects of Radar Signal Processing,” Artech House, Norwood, 1986.
- H.-I. Choi and W. J. Williams, “Improved Time-Frequency Representation of Multicomponent Signals Using Exponential Kernels,” IEEE Transactions on Acoustics, Speech and Signal Processing, Vol. 37, No. 6, 1989, pp. 862-871.
- A. G. Prasad and V. M. Amaresh, “An Offline Signature Verification System,” IEEE International Conference on Signal and Image Processing Applications, Hubli, 7-9 November 2009, pp. 59-64. doi:10.1109/ICPAIR.2011.5976912.
- I. Barbantan, C. Vidrighin and R. Borca, “An Offline System for Handwritten Signature Recognition,” IEEE 5th International Conference on Intelligent Computer Communication and Processing, Cluj-Napoca, 27-29 August 2009, pp. 3-10. doi:10.1109/ICCP.2009.5284793
- Y. C. Feng and P. C. Yuen, “A Hybrid Approach for Generating Secure and Discriminating Face Template,” IEEE Transactions on Information Forensics and Security, Vol. 5, No. 1, 2010, pp. 103-107. doi:10.1109/TIFS.2009.2038760
- N. Dowson and O. Salvado, “Hashed Nonlocal Means for Rapid Image Filtering,” IEEE Transactions on Pattern Analysis and Machine Intelligence, Vol. 33, No. 3, 2011, pp. 485-499. doi:10.1109/TPAMI.2010.114
- R. O. Duda, P. E. Hart and D. G. Stork, “Pattern Classification,” 2nd Edition, McGraw-Hill, Boston, 2001.
- R. C. Gonzalez and R. E. Woods, “Digital Image Processing,” Prentice-Hall, Saddle River, 2002.
- N. Kwak and C.-H. Choi, “Input Feature Selection by Mutual Information Based on Parzen Windows,” IEEE Transactions on Pattern Analysis and Machine Intelligence, Vol. 24, No. 12, 2002, pp. 1667-1671. doi:10.1109/TPAMI.2002.1114861.