Journal of Intelligent Learning Systems and Applications
Vol.4 No.3(2012), Article ID:22031,7 pages DOI:10.4236/jilsa.2012.43022
Consensus Decision for Protein Structure Classification
![]()
Institut Supérieur de Gestion, LARODEC Laboratory, University of Tunis, Tunis, Tunisia.
Email: Khaddouja.Boujenfa@isg.rnu.tn, Mohamed.Limam@isg.rnu.tn
Received January 2nd, 2012; revised June 1st, 2012; accepted June 8th, 2012
Keywords: Bioinformatics Databases; Classification; Mining Methods and Algorithms; Similarity Measures
ABSTRACT
The fundamental aim of protein classification is to recognize the family of a given protein and determine its biological function. In the literature, the most common approaches are based on sequence or structure similarity comparisons. Other methods use evolutionary distances between proteins. In order to increase classification performance, this work proposes a novel method, namely Consensus, which combines the decisions of several sequence and structure comparison tools to classify a given structure. Additionally, Consensus uses the evolutionary information of the compared structures. Our method is tested on three databases and evaluated based on different criteria. Performance evaluation of our method shows that it outperforms the different classifiers used separately and gives higher classification performance than a free-alignment method, namely ProtClass.
1. Introduction
Protein classification is one of the fundamental problems in bioinformatics. As outlined by Busa-Fekete et al. [1], three main categories of classification methods can be identified. Sequence comparison is the most commonly used approach for protein classification. In this framework, a query protein is compared against other proteins in a database. Then, a sequence with statistically significant similarity is detected and the class of the unknown protein is inferred based on the known class of this similar sequence. When distant sequence similarities are observed in a protein database, methods based on consensus descriptions are the most efficient. For all classes of a protein sequence database, a consensus description is prepared. As with the previous method, the query protein is compared to each of the consensus descriptions and is assigned the class label with the highest similarity.
A more recent type of protein classification is called phylogenomics and is originally introduced by Eisen [2]. Phylogenomics does not just rely on the similarities in sequences, but it also considers the phylogenetic information stored in a tree. This external source of knowledge is accumulated in the fields of taxonomy and molecular phylogeny and used as a basis of protein classification. The phylogenomics approach attempts to overcome systematic errors associated with sequence comparison tools and increases the classification performance.
Using only the sequence information, particularly for very divergent homologs is insufficient for ensuring accurate classification of proteins. The knowledge of the 3D structure of a given protein is useful to improve its function prediction [3-5]. Actually, biologists have shown that structure similarities among a group of related proteins are more conserved during evolution than sequence similarities. These structural similarities play a biological function in given proteins. Thus, combing sequence and structure information can give better performance than using sequence or structure alone. A similar idea is applied to fold recognition problem by Lundstrom et al. [6]. They use a neural-network for consensus prediction and they were able to improve the prediction accuracy. However, their aim in fold recognition is to predict the structure of a protein sequence rather than its classification.
Cheek et al. [7] propose SCOPmap based on an automatic approach to determine SCOP’s [8] superfamily and fold classification of a given structure. The idea is to combine the use of numerous sequence and structure comparison programs on a query protein of known structure. Each program identifies homologous domains using different approaches. Finally, a list of existing homologs is given from the SCOP database and the class label of the query protein is inferred based on labels of those homologs.
Another work proposed by Çamoğlu et al. [9] show that an “ensemble classifier”, namely DTree, combining different component classifiers to infer the SCOP family, superfamily and fold level classification of a given structure can outperform individual components. This consensus decision framework uses component classifiers addressing both sequence and structure information for predicting the classifications of proteins with known structures. A decision tree approach is used to combine classification decisions made by these different classifiers.
Recently, Melvin et al. [10] proposed Sabretooth, a hybrid approach to generate the SCOP superfamily classification of a given query from its associated sequence or structure. The method starts by making a prediction from the amino acid chain using a sequence classification method. When the score of prediction exceeds a certain threshold, the query is classified. Otherwise, a second classifier is used to predict the corresponding class from its 3D structure.
This work proposes a k Nearest Neighbor (kNN)-based method, namely Consensus, which uses the decisions of different sequence and structure comparison tools to determine the classification of a given structure. Unlike previously described methods, Consensus is able to determine the full hierarchy of CATH [11] and SCOP databases and includes most recent and efficient alignment tools. Moreover, the decision of a phylogeneomic method, namely Tree-kNNseq, described in our previous work [12] is also considered. Thus, in addition to sequence and structure similarities, Consensus presents the novelty of using the evolutionary information stored in a tree to infer the class label of a query structure.
This paper is organized as follows. In Section 2, we describe the Consensus method. In Section 3, we review the sequence and structure classifiers used in our proposed framework. In Section 4, we evaluate the performance of our method with individual classifiers and with a free-alignment method, namely ProtClass [13]. We show that it is possible to develop a classifier with better classification performance by combining the decisions of individual tools. Addionally, we show that alignment-based methods give higher classification performance than free-alignment methods. Finally, we conclude in Section 5.
2. Consensus: Protein Classification Using the Decision of Multiple Methods
Given a database T’ of n classified protein structures in m different classes and a query structure L’q, each component classifier is trained to find in the database the NNs proteins to the query. The indicator function If: {L’1, ···, L’n} → {1, ···, m} assigns class labels to protein structures.
In this analysis, we use five classifiers: two sequence and three structure classifiers. The two sequence classifiers are CS-BLAST [14] and Tree-kNNseq [12]. The first method compares a query protein sequence against a database of known proteins and the most similar sequences are returned. It constructs a context-specific sequence profile for the query sequence using a library of context profiles. Then, PSI-BLAST [15] is used to compare this profile to database sequences and the most closely found proteins are returned. The second method, Tree-kNNseq is a weighted NN method, which uses a phylogenetic tree to find the first NN of a query protein.
Three structure classifiers are also used. The first one, FAST [16] builds alignment between two protein structures by a directionality-based scoring scheme to compare intra-molecular residue-residue distances in two structures. GANGSTA+ [17] performs sequential and nonsequential alignments while assigning the type of secondary structure by focusing only on helices and strands.
Finally, ComSubstruct [18] proposes a mathematical framework applied to analyze the local structure of proteins, where local conformations of protein backbones are described using differential geometry of folded tetrahedron sequences.
We denote by Lq the associated sequence of a given query structure and T the sequence train set of the given protein structures. The sequence classifiers are used as follows. The training procedure of CS-BLAST compares the sequence Lq against the whole database T based on the CS-BLAST score. The most similar proteins found in the database are ranked according to the CS-BLAST score under a certain cutoff. Then, the first NN showing the highest score is selected. For Tree-kNNseq, the training procedure is described as follows: For each query sequence Lq, a tree is built with the training set T. Based on the whole tree structure, the set of NNs is determined. The NNs are leaves with the minimum number of edges from the query Lq. To select the first NN, the method finds the protein with the minimum distance from the query.
The structure classifiers are trained as follows: Each structure L’q in the query set is compared to all structures in the training set T’ based on the similarity criteria defined by each classifier. For FAST and GANGSTA+, the protein showing the highest similarity score and the minimum root-mean-square-deviation (RMSD) is selected as the first NN to the query protein. A set of the most similar proteins with identical highest score and lowest RMSD distance can be determined. In this case, all of them are considered as NNs. The ComSubstruct classifier generates several best longest common subsequences (LCSs) between a given query and the train set. These best LCSs are ranked in a decreasing order with respect to the values of Ratios A and B. Only the first best LCS result, which shows the maximum values of Ratios A and B, is considered. The protein structure which gives the first best LCS with the query protein is chosen as the first NN.
After this training procedure, each of the five component classifiers can produce one or more NNs proteins. In the final stage, this set of NNs is used to assign to the query structure L’q the most common class label. Consensus algorithm is outlined in Algorithm 1.
Algorithm 1 Pseudo code for Consensus algorithm Input: A query structure L’q, the associated sequence Lq, the train sets T’ and T, T’ = {L’i}, T= {Li} and I ∈ [1···n]
Output: The most common class to the query structure L’q
Training:
1: For each Li ∈ T and Lq do Compute CS-BLAST distances diq;
2: Select the NN sequence of CS-BLAST, Lk1, with the minimum distance d;
3: Find the NN sequence Lk2 with Tree-kNNseq;
4: For each L’i ∈ T’ and L’q do Compute the SNiq score and RMSDiqfast with FAST;
Compute the GPsiq and RMSDiqGP with GANGSTA+;
Compute the LCSiq using ComSubstruct;
5: Select the set NNfast = {L’i} with maximal SNiq and minimum RMSDiqfast;
Select the set NNgplus = {L’i} with maximal GPsiq and minimum RMSDiqGP;
Select the NN L’k3 with the first best LCS with L’q;
Classification:
6: Compute the common class label:
If (L’q) = If (L’k1 ∪ L’k2 ∪ L’k3 ∪ NNfast ∪ NNgplus);
End
3. Classifiers Used in Consensus Method
3.1. Sequence Classifiers
CS-BLAST is a context-specific version of BLAST for homologous proteins searching in sequence databases, able to provide more sensitive and accurate alignment than BLAST [19]. Effectively, instead of using substitution matrices to find the best alignment similarity score between aligned residues, CS-BLAST creates context specific amino acid similarities from short windows centered on each query sequence residue. First, CS-BLAST constructs a context-specific sequence profile for the query sequence using a library of context profiles. Then, the context-specific case of PSI-BLAST (CSI-BLAST) is used to compare this profile to database sequences. CS-BLAST outputs the hit database protein sequences, each one with its associated similarity score, the High Segment Pair (HSP), sequence alignment and the statistical significance of the similarity (E-values). The latter provides an estimate of the probability of having similarity of this quality with a random string.
This hit database protein sequences are ranked according to the highest similarity scores (1) and the minimum E-values (2). We select E-value as the CS-BLAST distance diq between the query sequence Lq and the train sequence Li.
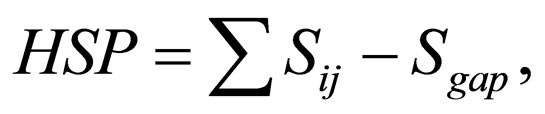 (1)
(1)
where Sij is the similarity score between residue i and j in a given similarity matrix. The statistical significance of the similarity is given by
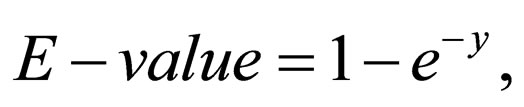 (2)
(2)
where y = kmne–λS, m and n are the lengths of the two compared sequences and S is the HSP score cut-off.
Tree-kNNseq compares the query sequence Lq with a database of classified proteins based on BLAST pairwise method. Then, a distance matrix is constructed from this comparison containing the all versus all dissimilarity values (E-value) between proteins. From this distance matrix, Tree-kNNseq constructs a common tree that includes the member of the database and the query protein. Then, all leaves except the unknown query are labeled. The set of closest neighborhoods where leaves in the tree have the minimum number of edges from the query is determined. Finally, Tree-kNNseq returns the neighbor protein, which has the lowest dissimilarity measure.
3.2. Structure Classifiers
FAST first compares the local geometric properties of two protein structures with M and N residues respectively, and selects a small subset of MN pairs as the vertex set to construct a pair graph G (V,E), where V and E are vertex and edge sets, respectively. Second, the method assigns edges by comparing intra-molecular relationships using a directionality-based scoring scheme that supports sparseness of the graph. Third, it iteratively prunes the graph to eliminate bad vertices, which are residue pairs that are unlikely to constitute the global optimal alignment. With substantially simplified product graph, an initial alignment is detected using dynamic programming. Finally, for optimization FAST enhances the initial alignment by finding additional equivalent pairs and eliminating bad pairs. FAST returns a similarity score SX and the RMSD distance. The similarity score is given by
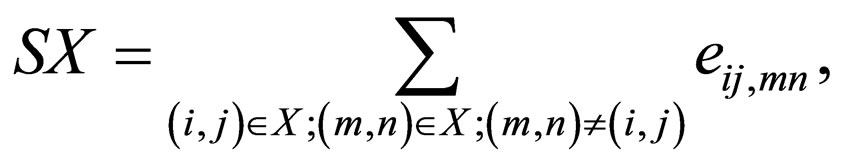 (3)
(3)
where i and m are atoms in the first protein and j and n are atoms in the second protein. eij,mn is the edge weight connecting the two vertices (i,j) and (m,n). The RMSD distance is given by
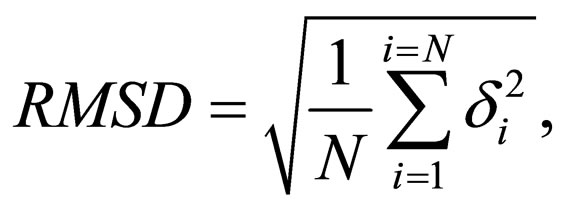 (4)
(4)
where δ is the distance between N pairs of equivalent atoms, usually Cα.
GANGSTA+ finds alignment in a three-stage hierarchical approach starting with an alignment of secondary structure elements (SSEs), where only α-helices and β- strands are considered as SSEs. The method uses a connectivity graph to represent this alignment. In the second stage, and for the highest ranked SSE assignments GANGSTA+ makes preliminary alignment on the residue level using rigid body energy minimization with attractive interactions between Cα atoms belonging to different proteins.
In stage three, the preliminary structural alignment is used to assign the Cα atoms of both proteins to points on the same rectangular grid. Cα atom pairs assigned to the same grid points are used for a more accurate and complete SSE assignment. Finally, stage two is repeated and alignments of residues belonging to loops and coils are added. GANGSTA+ returns the RMSD distance (4) and an alignment similarity score, which weights the RMSD of Cα atoms relative to the number of aligned residues Naligned. The alignment similarity score is given by
 (5)
(5)
ComSubstruct method uses an encoding algorithm to first encode the two 3D structures into binary sequences. This algorithm studies the local structure of a protein, designed as its polygonal chain, by considering all amino acid fragments of length five occurred in the protein. In the optimization step, ComSubstruct uses a dynamic programming algorithm to compute the LCS between the two encoded protein structures. The LCS problem is the simplest form of similarity analysis, where the operation of substitution is eliminated and only insertions and deletions are allowed. A subsequence of a string v is an ordered sequence of not necessarily consecutive characters from v. A common subsequence of two strings is a subsequence of both of them. For example, TCTA is common to both v = ATCTGAT and w = TGCATA.
4. Results
4.1. Assessment of Classification Performance
To assess the classification performance, we calculate the number of true positives (TP), false positives (FP), true negatives (TN), and false negatives (FN) as follows:
1) TP: the number of proteins predicted to belong to positive class and the actual value is positive;
2) FP: the number of proteins predicted to belong to positive class and the actual value is negative;
3) FN: the number of proteins predicted to belong to negative class and the actual value is positive;
4) TN: the number of proteins predicted to belong to negative class and the actual value is negative.
The error rate is given by
 (6)
(6)
denoting the percentage of incorrectly predicted protein classes (FP and FN) within all predictions. The specificity given by
 (7)
(7)
estimates the proportion of actual negative (TN and FP) which are predicted negative (TN). This specificity tests the ability of the classification method to identify negative results. The sensitivity given by
 (8)
(8)
relates the ability of the method to identify positive results. Sensitivity estimates the proportion of actual positive (TP and FN) which are predicted positive (TP).
4.2. Data Sets
To assess the performance of Consensus algorithm, we construct two data sets namely, SCOP95 and CATH95, from the Protein Classification Benchmark collection [20]. This collection contains data sets of sequences and structures with different classification tasks. A classification task is the subdivision of a data set into positive train (+train), positive test (+test), negative train (–train) and negative test (–test) groups.
SCOP95 contains sequences from SCOP database with less than 95% of sequence identity and 10 classification tasks. Five tasks form the SCOP95_S_level data set are protein sequences classified into superfamilies (S) based on families. The five remaining tasks are protein sequences classified into folds (F) based on superfamilies and labeled as SCOP95_F_level data set.
CATH95 data set is created from protein sequences of CATH database with sequence identity greater than 95% and 10 classification tasks. Five tasks form the CATH- 95_H_level data set and protein sequences are classified into homology (H) groups based on similarity groups. The five other tasks designate the CATH95_T_level and protein sequences are classified into topology groups (T) based on homology groups.
An additional data set is constructed from the Lipase Engineering database (LED) [21]. It is a structural database of lipase proteins integrating information on their sequences, structures and functions. These proteins are groups of enzymes, which catalyze the hydrolysis or synthesis of a broad range of water insoluble esters. In this database, enzymes are classified into three classes: GGGX, GX, and Y class [22] of fully and consistently annotated superfamilies.
For each class of the LED database, we define classification tasks in the following way: The positive set is created from a given superfamily. One of the superfamilies is the positive group, where members of the +test and +train are randomly selected. The remaining superfamilies constitute the negative group, where members are randomly divided to give the final –train and –test. A summary of the used data sets is given in Table 1.
4.3. Comparison of Consensus versus Concurrent Methods
The performance of our method is compared to five comparison tools namely, CS-BLAST, Tree-kNNseq, FAST, GANGSTA+ and ComSubstruct when they are used as component classifiers. Also, the performance of Consensus is compared to a free-alignment method, ProtClass. All methods are run with default parameters and experiments are performed on Intel Core 2 Duo with 2.93 GHz CPU and 1.96 Go of RAM.
Performance results for each method, produced on supefamily and fold levels of SCOP95 data set, are respectively shown in Tables 2 and 3. We clearly notice that our method improves the classification performance compared to the six classifiers with respect to all criteria. At the superfamily level, sequence comparison tools outperform structure tools except ComSubstruct, which show similar performance as CS-BLAST and Tree-kNNseq.
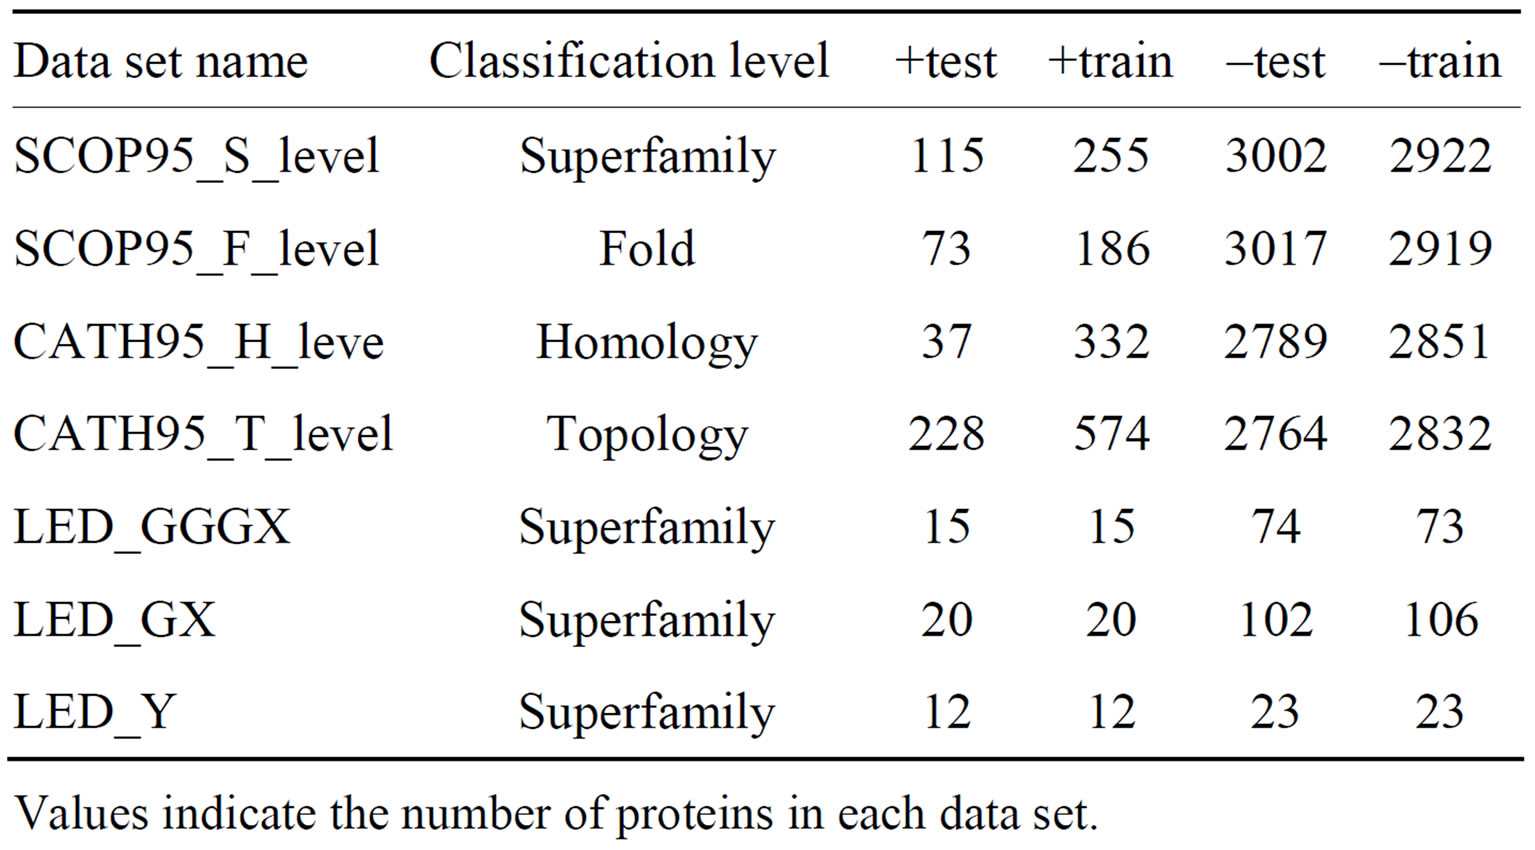
Table 1. Summary of used data sets.
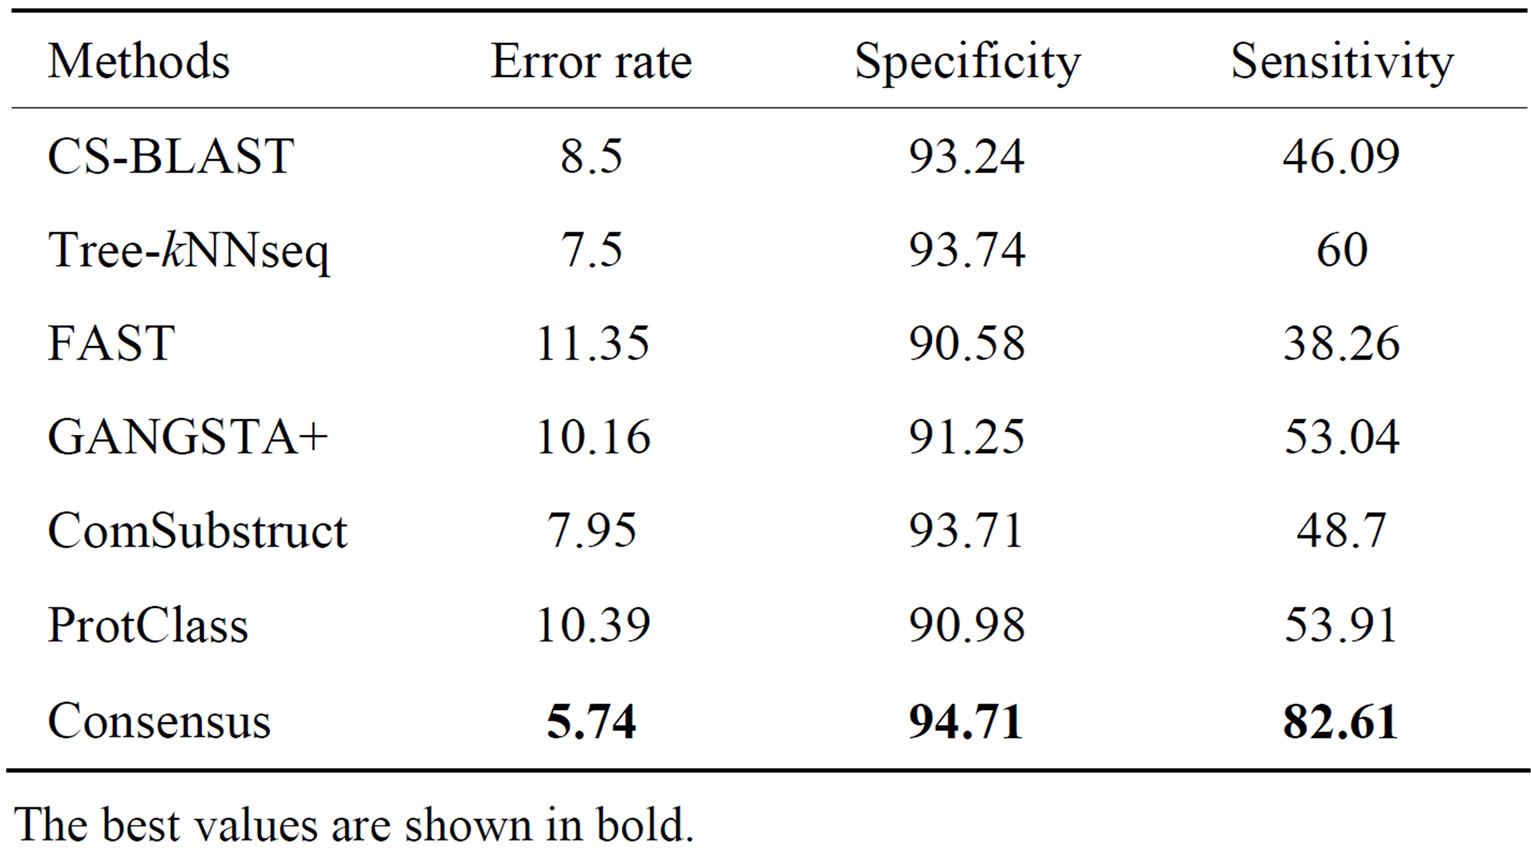
Table 2. Performance of classification methods on SCOP- 95_S_level data set.
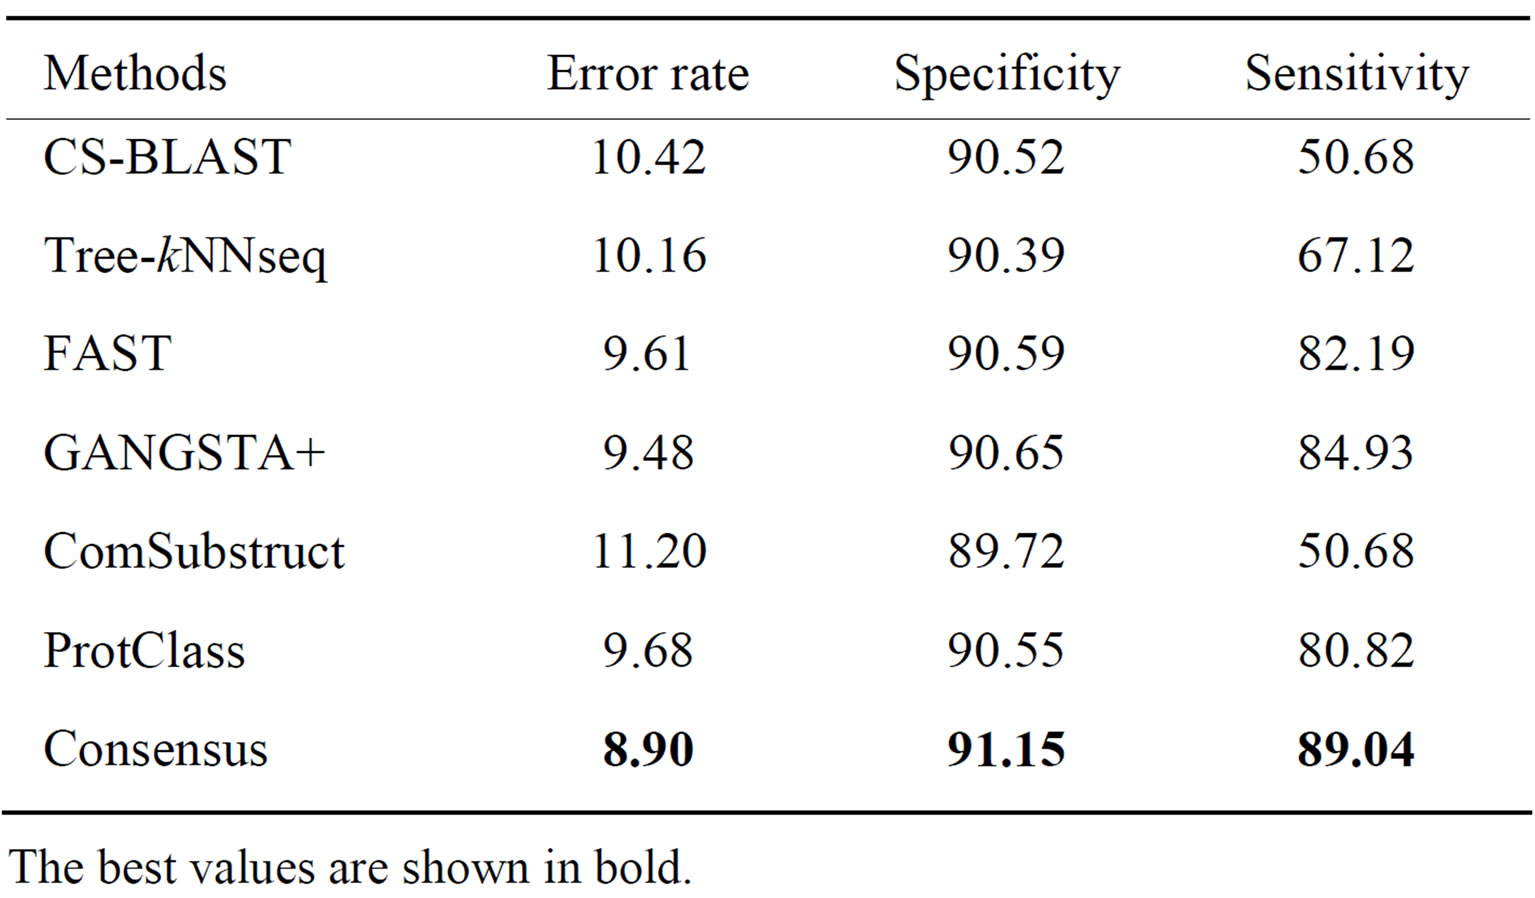
Table 3. Performance of classification methods on SCOP- 95_F_level data set.
The best values are shown in bold.
The best performance among all classifiers is achieved by Tree-kNNseq, which is able to assign 92.5% of query proteins to correct superfamilies with 93.74% and 60.0% of proteins to negative and positive class, respectively. With respect to other methods, Consensus is able to reduce the error rate by 5.61% and to increase the specificity and the sensitivity of classification with 4.13% and 44.35%, respectively.
It is not surprisingly to notice with the exception of ComSubstruct that structure tools outperform sequence tools at fold level of SCOP95 data set. GANGSTA+ gives best performance with respect to all criteria. It is able to correctly assign 90.52% of query proteins to their corresponding fold with 90.65% of queries in negative class and 84.93% in positive class. Our method still improves the performance of individual tools providing 0.58% lower error rate and, respectively 0.5% and 4.11% higher specificity and sensitivity than GANGSTA+. Moreover, Consensus does better than ProtClass. Effectively, it is able to correctly classify 4.65% and 0.78% more proteins than ProtClass respectively on superfamily and fold levels of SCOP95.
Performance results on homology and topology levels of CATH95 data set are shown respectively in Tables 4 and 5. Again, our method provides the best performance among all classification tools with respect to different
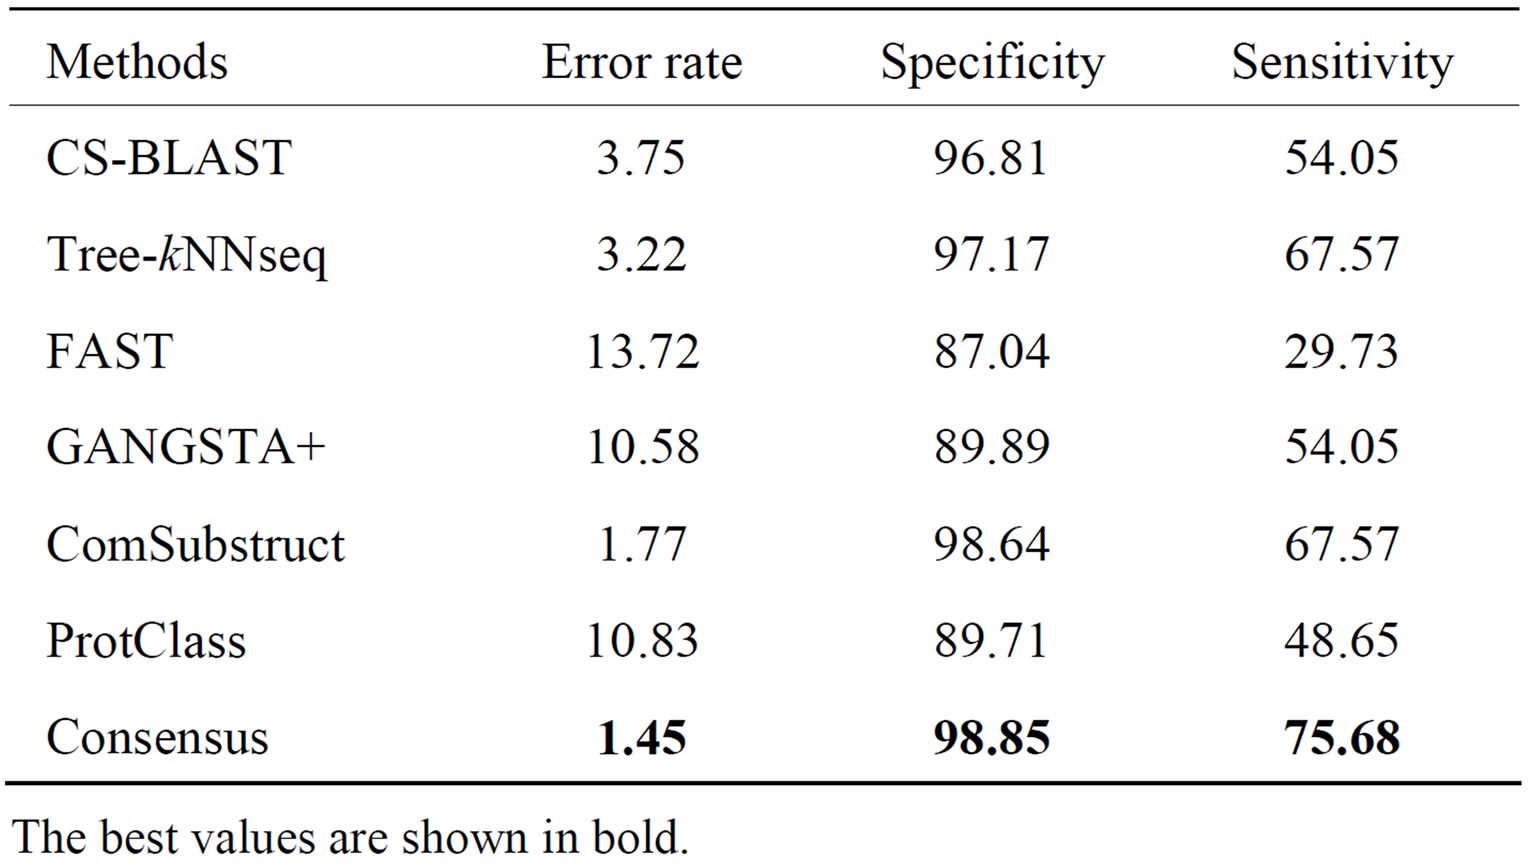
Table 4. Performance of classification methods on CATH95_ H_level data set.
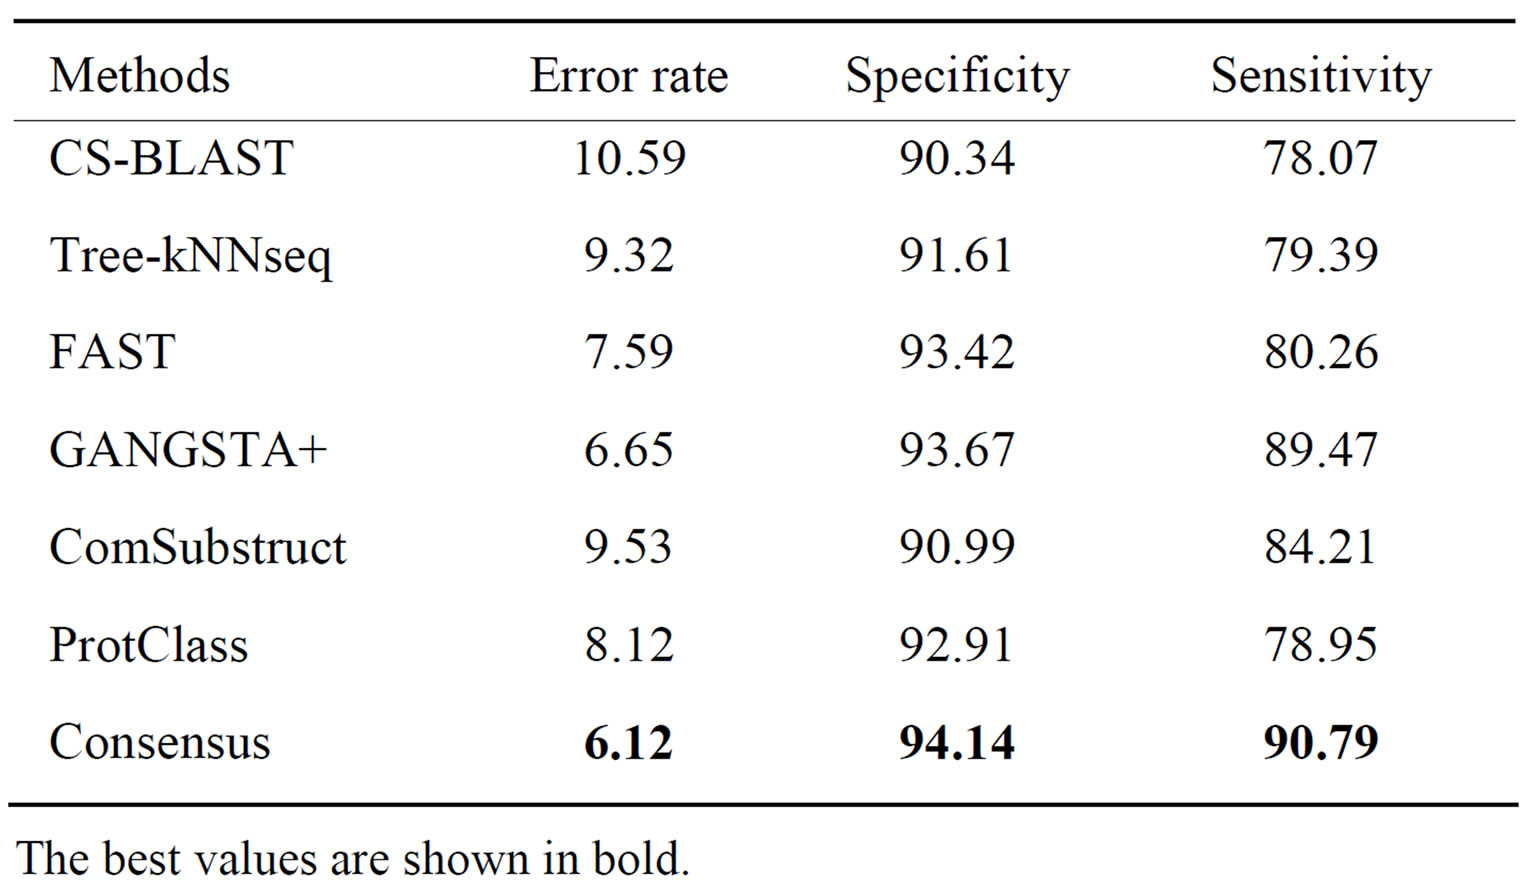
Table 5. Performance of classification methods on CATH- 95_T_level data set.
criteria. At homology level, error rate, specificity and sensitivity are improved respectively by 12.27%, 2.04% and 45.95% using decisions of the five component classifiers. Among all individual classifiers, ComSubstruct performs best.
At topology level, Consensus shows highest performance. It gives respectively, 4.47%, 3.8% and 12.72% better error rate, specificity and sensitivity than other classifiers. Also, it is easy to notice that structure tools do better than sequence tools. Moreover, on the two levels of CATH95 data set, Consensus performs better than ProtClass.
The performance results on LED database for GGGX, GX and Y classes are given respectively in Tables 6-8. Consensus performs better than component classifiers with respect to all criteria. On LED_GGGX, LED_GX and LED_Y data sets, our method is able to improve error rate with 12.36%, 9.02% and 14.29%, respectively.
On GGGX, GX and Y classes, Consensus also improves the specificity with 5.41%, 8.82% and 8.69% and the sensitivity with 46.66%, 10% and 25%, respectively. On overall classes, we notice that structure tools give better performance than sequence tools. On all LED data sets and with respect to all criteria, we notice that Consensus is more accurate than ProtClass.
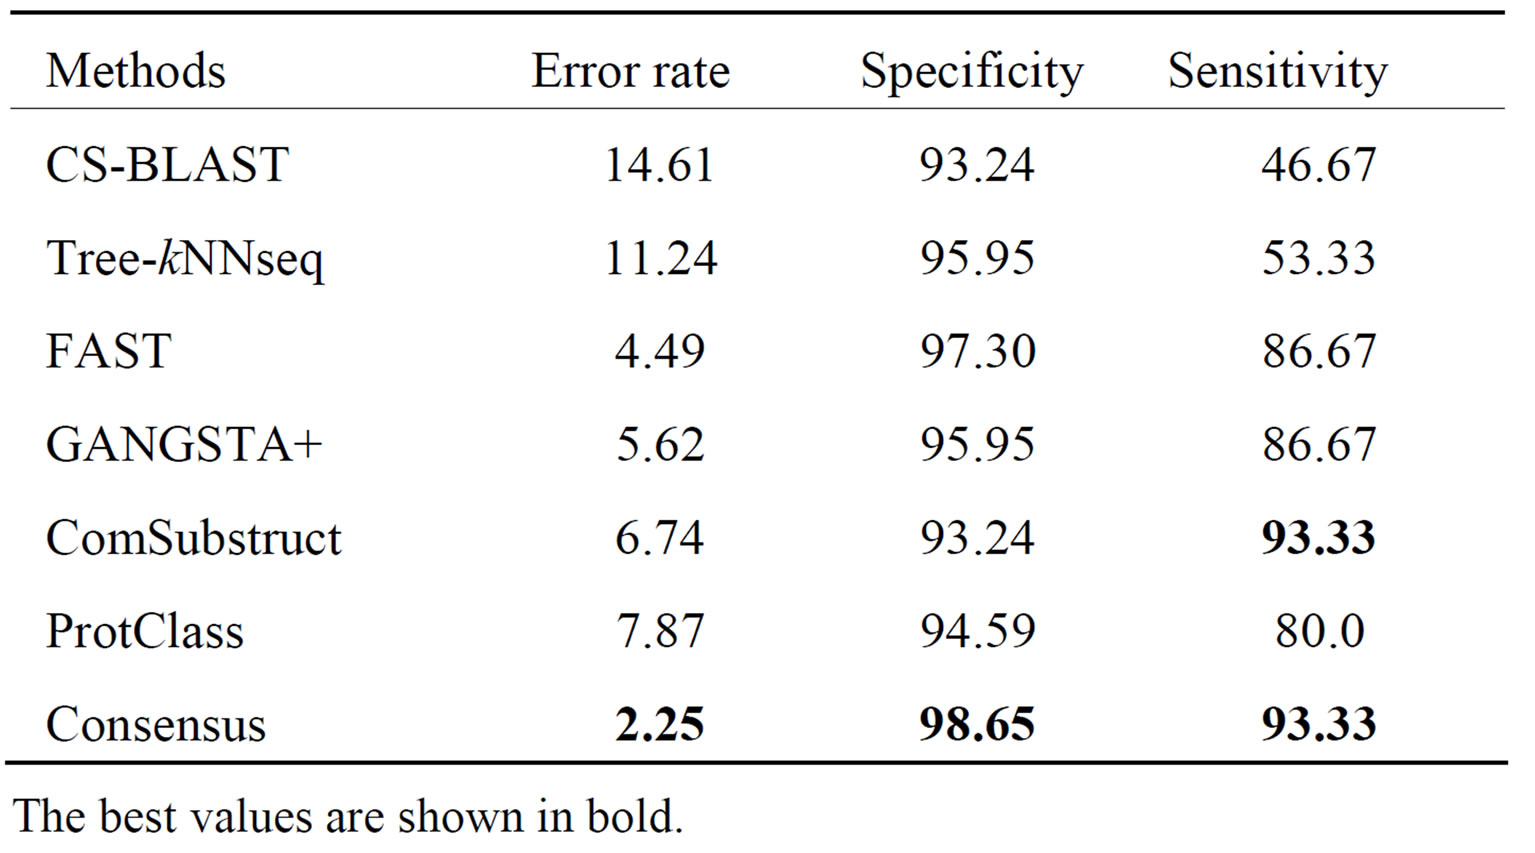
Table 6. Performance of classification methods on LED_ GGGX data set.
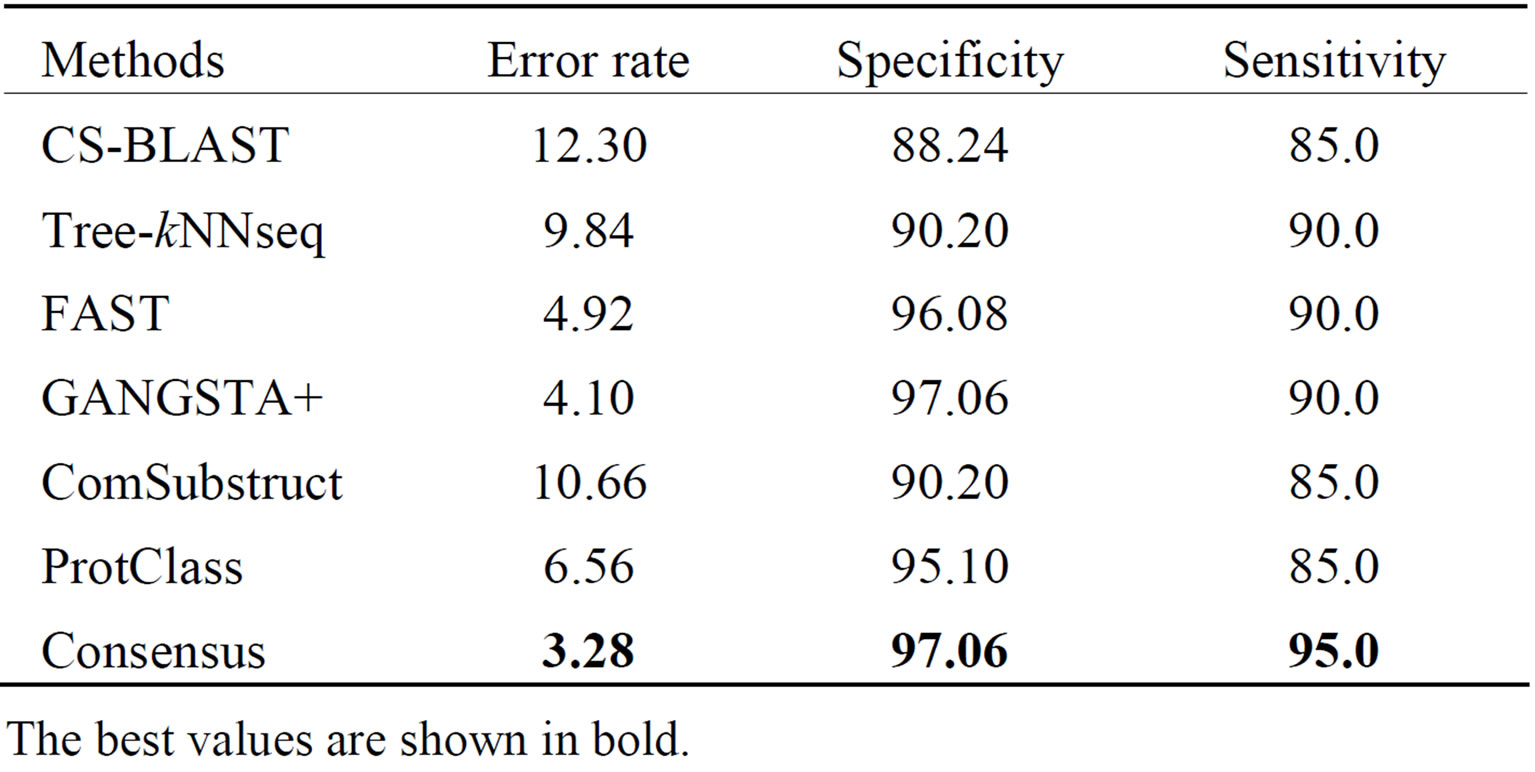
Table 7. Performance of classification methods on LED_GX data set.
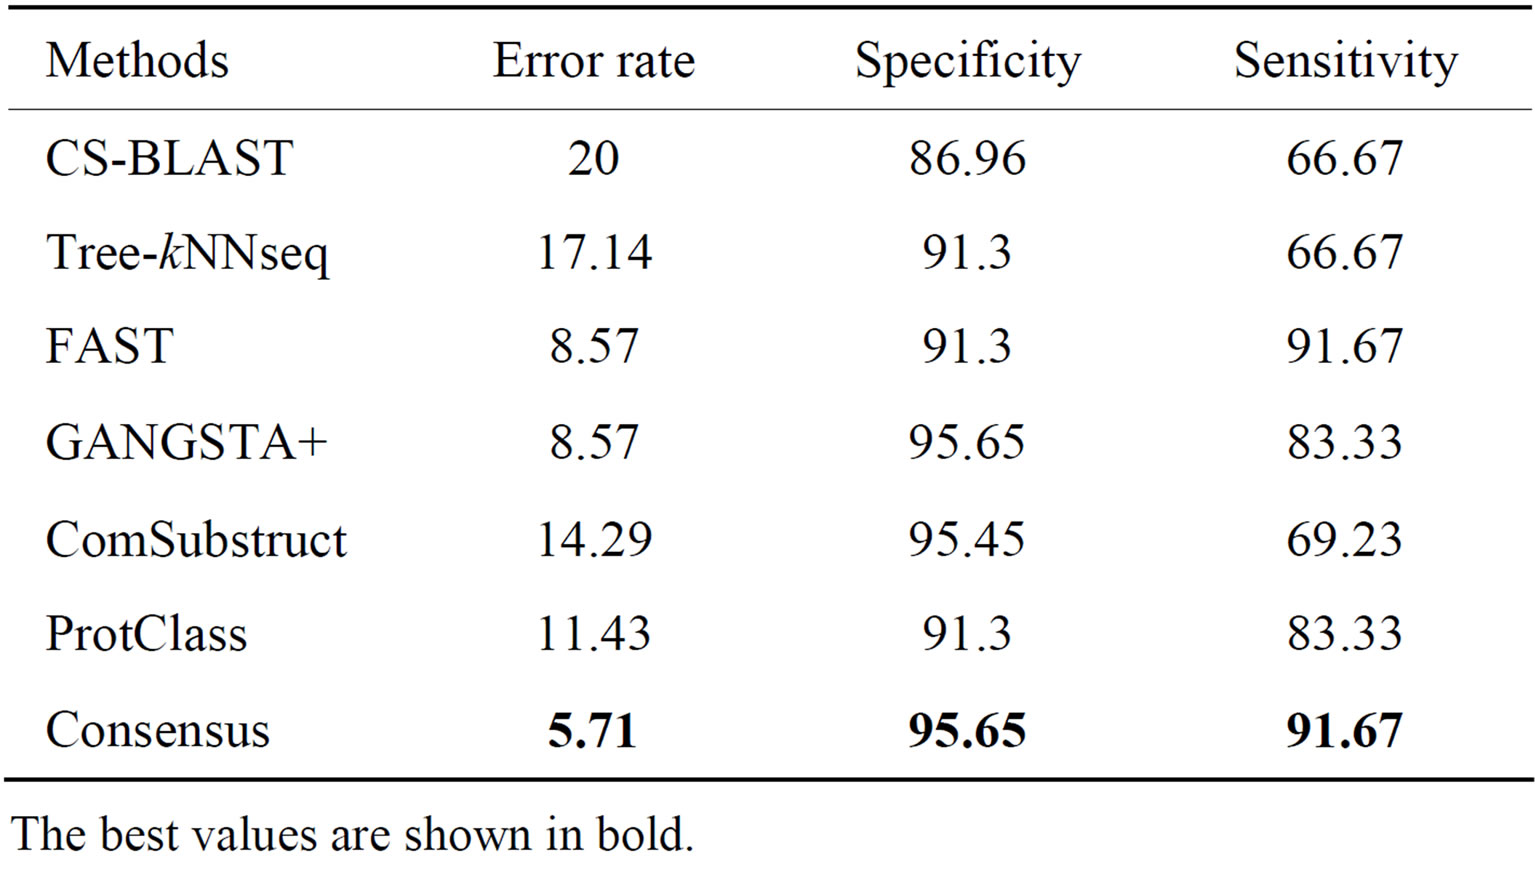
Table 8. Performance of classification methods on LED_Y data set.
It is interesting to notice that Tree-kNNseq [9] outperforms CS-BLAST on overall levels of SCOP95, CATH-95 and LED data sets. This shows that evolutionary information of a given protein improve classification results. Additionally, the best performance of TreekNNseq among other tools in superfamily level of SCOP95 data set enhances classification performance of Consensus.
We conclude from all these experiments that combining sequence and structure tools as a single classifier achieves better classification performance than used separately.
Additionally, Consensus is more performing than ProtClass on all data sets used in this analysis and with respect to all criteria. This is attributed to its sequential and structural alignment mechanisms. But, this alignmentbased classification approach requires high computational cost and makes Consensus extremely slow. Despite the no gain in computational time, Consensus outperforms alignment-independent methods, such as ProtClass.
5. Conclusion
We proposed a new method, namely Consensus for the classification of protein structures, which combines decisions of two sequence and three structure comparison methods to infer the class of a given protein structure. We have shown that our method outperforms the five component classifiers namely CS-BLAST, Tree-kNNseq, FAST, GANGSTA+ and ComSubstruct used separately. In addition, Consensus is more performing than a freealignment method namely ProtClass.
REFERENCES
- R. Busa-Fekete, A. Kocsor and S. Pongor, “Tree-Based Algorithms for Protein Classification,” Studies in Computational Intelligence, Vol. 94, 2008, pp. 165-182. doi:10.1007/978-3-540-76803-6_6
- J. A. Eisen, “Phylogenomics: Improving Functional Prediction for Uncharacterized Genes by Evolutionary Analysis,” Genome Research, Vol. 8, No. 3, 1998, pp. 163-167.
- P. Jain and J. D. Hirst, “Automatic Structure Classification of Small Proteins Using Random Forest,” BMC Bioinformatics, Vol. 11, No. 364, 2010.
- R. Parasuram, J. S. Lee, P. Yin, S. Somarowthu and M. J. Ondrechen, “Functional Classification of Protein 3D Structures from Predicted Local Interaction Sites,” Journal of Bioinformatics and Computational Biology, Vol. 8, No. 1, 2010, pp. 1-15.
- Y. Y. Tseng and W. H. Li, “Classification of Protein Functional Surfaces Using Structural Characteristics,” Proceedings of the National Academy of Science, Vol. 109, No. 4, 2012, pp. 1170-1175. doi:10.1073/pnas.1119684109
- J. Lundstrom, L. Rychlewski, J. Bujnicki and A. Elofsson, “Pcons: A Neural Network-Based Consensus Predictor That Improves Fold Recognition,” Protein Science, Vol. 10, No. 11, 2001, pp. 2354-2362. doi:10.1110/ps.08501
- S. Cheek, Y. Qi, S. S. Krishna, L. N. Kinch and N. V. Grishin, “SCOPmap: Automated Assignment of Protein Structures to Evolutionary Superfamilies,” BMC Bioinformatics, Vol. 5, No. 197, 2004.
- A. G. Murzin, S. E. Brenner, T. Hubbard and C. Chothia, “SCOP: A Structural Classification of Proteins Database for the Investigation of Sequences and Structures,” Journal of Molecular Biology, Vol. 247, No. 4, 1995, pp. 536- 540. doi:10.1016/S0022-2836(05)80134-2
- O. Çamoğlu, T. Can, A. K. Singh and Y. F. Wang, “Decision Tree Based Information Integration for Automated Protein Classification,” Journal of Bioinformatics and Computational Biology, Vol. 3, No. 3, 2005, pp. 717-742. doi:10.1142/S0219720005001259
- I. Melvin, E. Ie, R. Kuang, J. Weston, W. N. Stafford and C. Leslie, “SVMfold: A Tool for Discriminative MultiClass Protein Fold and Superfamily Recognition,” BMC Bioinformatics, Vol. 8, No. 4, 2007, p. S2. doi:10.1186/1471-2105-8-S4-S2
- C. A. Orengo, A. D. Michie, S. Jones, D. T. Jones, M. B. Swindells and J. M. Thornton, “CATH—A Hierarchic Classification of Protein Domain Structures,” Structure, Vol. 5, No. 8, 1997, pp. 1093-1108. doi:10.1016/S0969-2126(97)00260-8
- K. Boujenfa, N. Essoussi and M. Limam, “Tree-kNN: A Tree-Based Algorithm for Protein Sequence Classification,” International Journal on Computer Science and Engineering, Vol. 3, No. 2, 2011, pp. 961-968.
- Z. Aung and K. L. Tan, “Automatic 3D Protein Structure Classification without Structural Alignment,” Jounal of Computational Biology, Vol. 12, No. 9, 2005, pp. 1221- 1241. doi:10.1089/cmb.2005.12.1221
- A. Biegert and J. Söding, “Sequence Context-Specific Profiles for Homology Searching,” PNAS, Vol. 106, No. 10, 2009, pp. 3770-3775. doi:10.1073/pnas.0810767106
- S. F. Altschul, T. L. Madden, A. A. Schaffer, J. Zhang, Z. Zhang, W. Miller and D. J. Lipman, “Gapped Blast and Psi-Blast: A New Generation of Protein Database Search Programs,” Nucleic Acids Research, Vol. 25, No. 17, 1997, pp. 3389-3402. doi:10.1093/nar/25.17.3389
- J. Zhu and Z. Weng, “Fast: A Novel Protein Structure Alignment Algorithm,” PROTEINS: Structure, Function, and Bioinformatics, Vol. 58, No. 3, 2005, pp. 618-627. doi:10.1002/prot.20331
- A. Guerler and E. W. Knapp, “Novel Protein Folds and Their Nonsequential Structural Analogs,” Protein Science, Vol. 17, No. 8, 2008, pp. 1374-1382. doi:10.1110/ps.035469.108
- N. Morikawa, “Discrete Differential Geometry of Tetrahedrons and Encoding of Local Protein Structure,” arXiv: 0710.4596v1.
- S. F. Altschul, W. Gish, W. Miller, E. W. Myers and D. J. Lipman, “Basic Local Alignment Search Tool,” Journal of Molecular Biology Vol. 215, No. 3, 1990, pp. 403-410.
- P. Sonego, M. Pacurar, S. Dhir, A. Kertesz-Farkas, A. Kocsor, Z. Gaspari, J. A. M. Leunissen and S. Pongor, “A Protein Classification Benchmark Collection for Machine Learning,” Nucleic Acids Research, Vol. 35, No. 1, 2007, pp. D232-D236. doi:10.1093/nar/gkl812
- M. Widmann, P. B. Juhl and J. Pleiss, “Structural Classification by the Lipase Engineering Database: A Case Study of Candida Antarctica Lipase A,” BMC Genomics, Vol. 11, No. 123, 2010.
- J. Pleiss, M. Fischer, M. Peiker, C. Thiele and R. D. Schmid, “Lipase Engineering Database—Understanding and Exploiting Sequence-Structure-Function Relationships,” Journal of Molecular Catalysis B-Enzymatic, Vol. 10, No. 5, 2000, pp. 491-508. doi:10.1016/S1381-1177(00)00092-8