Journal of Water Resource and Protection
Vol.6 No.10(2014), Article
ID:48285,14
pages
DOI:10.4236/jwarp.2014.610088
Practical Method Proposed to Estimate Silting’s Rate in Small and Hillside Dams
Naima Alahiane1, Ahmed El Mouden1, Abderrahmane Ait Lhaj2, Said Boutaleb1
1Laboratory of Applied Geology and Geo-Environment, Faculty of Science, Ibn Zohr University, Agadir, Morocco
2National Agency for Development of Oasis Areas and Argan, Administrative District, Agadir, Morocco
Email: n.alahiane@gmail.com
Copyright © 2014 by authors and Scientific Research Publishing Inc.
This work is licensed under the Creative Commons Attribution International License (CC BY).
http://creativecommons.org/licenses/by/4.0/
![]()
![]()

Received 5 April 2014; revised 1 May 2014; accepted 23 May 2014
ABSTRACT
The construction of small dams and hillside reservoirs is a common practice for dealing with erratic and unevenly distributed rainfalls in arid and semi arid areas. Moreover, these small hydraulics structures are recommended as a solution to adapt to climate change in rural areas. They are fundamental for the sustainability of the water resources. However, these dams are potential sinks for upstream sediment. Therefore, it would be useful to monitor and measure the amount of sediments in small dams because it is necessary to understand siltation and better functioning of these vital structures. This control and these measurements require the application of the bathymetry or topography surveys which is too expensive for the responsible of these small dams. In this context, this paper proposes a simple and low cost method called: Triangulation of the estimated silted level. This method is based on direct measurement of the accessible silted level in dam. This new method is compared with another method based on the initial Elevation-Capacity curve of dam, usually used when the bathymetry is not attainable. The results of both of them have been verified with those of the bathymetry and electrical tomography methods and validated the proposal method as the most approximate. Therefore, this method is recommended as a new direct and simple technique to evaluate the amount of silting in small dams and hillside reservoirs.
Keywords:Small Dams, Evaluate Silting, Bathymetry, Triangulation

1. Introduction
Since their conception in the United States, improving their technique by Italians and, due to their low cost and their adaptation to marginal and mountainous areas, the strategy of building hillside and small dams was quickly adopted by many countries especially those of the Mediterranean and Sahel. In Morocco, the technique of mobilization of surface water is not recent considering that for a long time ago some structures have been designed in order to meet specific needs. The structures named “Rhdirs” have been created in the highlands for watering and “Netfias” for drinking water in Souss. Today, due to the opening of Morocco on the U.S. and Italian experience, more than 104 lakes and 54 hillside dams have been built since 1980 [1] .
According to the classification of the International Commission of Large Dams, small and hillside dams are the structures with storage capacities up to about a million cubic meters of water, and having embankments up to a height of about 15 m, their catchment up to a surface of about tens km2 [2] .
These specific structures supply water and regulate the flow that can keep rural communities on site by providing real opportunities for development [3] . Actually, small dams were found to be very important in the communities’ well being as they are put to a number of uses, which are livestock watering, domestic use, irrigation, groundwater recharge, flood amelioration, fishing, etc. Indeed, they are necessary for sustainable development and adaptation to current climate change.
However, the lakes of these dams, which are sediment traps across their catchments, are extremely threatened by siltation which reduces their lifespan while hydrologists recommend that only dams whose life exceeds 30 years may be used for drinking water or irrigation valuations [4] . In fact, siltation’s dam is natural and very old phenomenon, and the bibliography provides us an example of the Marib Dam in Yemen constructed 1100 years AC and Kebbar in Iran in 1300 AD [5] . In addition to reduction of lifespan, siltation causes the elevation of the flood’s magnitude and makes the downstream danger. Furthermore, the safety of embankment is threatened because of the increase of the pressure’s silts on the wall.
Therefore, the control of siltation is an inevitable step either to have global values of erosion rate or sediment yield in watershed [6] [7] . This control is so important for the management and the optimization of these structures. It also allows updating the filling curve of dam (Height-Volume Curve) which may be superseded by subsequent deposition [8] -[13] .
Erosion, sediment yield and siltation have been studied by several researchers [8] [14] -[19] . The majority have been focused on the characterization and regionalization of siltation, and they have been tried to produce practical models and monograph for each area [9] [12] [20] -[24] . Some researchers are oriented to identification and assessment of rate’s erosion based on geometric, hydrological, lithological, geomorphological and climatic characteristics of the watershed [25] -[30] .
There are several modeling tools available to estimate rate’s erosion and sediment transport assessment. One of them, RUSLE (Revised Universal Soil Loss Equation) is commonly used as a base to produce specific models, depending on the area. Models such as watem/sedem [31] , EPM model [32] , SATEEC [33] and AGQ or PISA [34] , require significant data for each watershed which is difficult for small watersheds because of the absence of the monitoring station. So, the direct measurement methods such as bathymetry are more reliable. After bathymetric survey, the silted volume is calculated by different methods: Kolmogorov [14] , the method of average height and general method [8] [15] . Aerial stereography is another method based on overlaying aerial photos of the lake taken at intervals of time from two to five years [9] .
These methods of direct measurement are certainly reliable, but also costly, time consuming and laborious. They are not within the rural communities’ capacities. These communities are the first operators and sometimes the solely responsible who care about the sustainability of these small hydraulic structures.
In this paper, we propose a direct measurement method, which is simple and low-cost to estimate the volume of siltation in small dams and hillside reservoirs. In fact, we have tried to be away from the constraints of empirical equations and to approximate the principle of the bathymetry which is considered as a reliable technique. This proposal method called TESL (Triangulation of the estimated silted level) is based on the survey of a few visible points in the silted surface. We have applied this new method on seven hillside reservoirs in the region of Souss in Morocco. Moreover, we have verified and validated its results by the reliable methods such as bathymetry and electrical tomography.
2. Direct Measurement Techniques Commonly Used for Calculate Rate’s Siltation
Direct measurement of silting’s rate is based on visiting the study area and survey the current state without using the modeling and empirical formulas.
2.1. Bathymetry Survey
The bathymetric approach is based on a simple comparison of reservoirs morphology at two different time periods, first at the time of the construction of the dam and second at the time of the survey. Bathymetric map involves two types of necessary measures: the position and depth measurements [14] [15] [35] .
2.2. Remote Sensing
It based on the repetition of similar satellite images at regular intervals of 2 to 5 years on areas of dams. The remote sensing technique helps to calculate the present storage capacity, which is compared with the original capacity and reduction in capacity over a period of time is attributed to silt deposition. Remote sensing technique for estimating sedimentation is useful only for lakes and reservoirs where rise and fall in water level is a regular phenomenon [9] [36] .
2.3. Calculating the Volume of Siltation
We can find different methods to operate the results of the bathymetry survey and remote sensing. All of them are based on the old methods for calculating volumes between profiles raised.
2.3.1. Kolmogorov Method
This method is based on the average between two sections survey profiles Pa, Pb and a fictitious profile Pc, it is explained on Figure 1 and Equations (1), (2) and (3) [14] .
(1) , (2)
, (2) , (3)
, (3) 
2.3.2. The Method of Average Height
As its name suggests, this method is based on the average silted heights (Equation (4)) on surveys profiles Pa and Pb and the surface that separates them Sab which is shows on Figure 2 [14] .
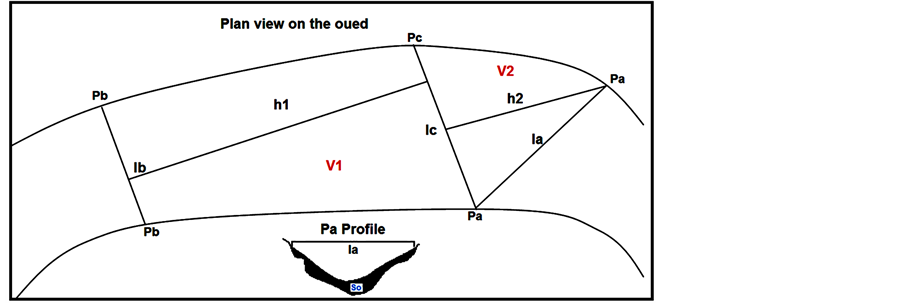
Figure 1. Diagram of the Kolmogorov method.

Figure 2. Diagram of the average height method.
(4) 
2.3.3. The General Method
This method is based on silted sections on the surveys profiles but also takes into account the inclination of sections Pa and Pb on Figure 3 [15] .
(5) 
Now, with the development of topographic software and remote sensing, surveying of the silted areas are automatically integrated into specialized software to calculate directly and easily the volume of sediment in dams.
3. Technique to Estimate the Silting Volume: The Initial Elevation-Area-Capacity Curve of a Dam
In fact, the area-capacity curve is necessary for defining the storage capacity of a reservoir. An area capacity curve is obtained by planimetering the area enclosed within each contour line in the reservoir area before its filling (see Figure 4). The graphical plotting of area and capacity curves rates the surface area and the storage capacity of the reservoir to the elevation of the water surface (see Table 1 and Figure 5).

Figure 3. Diagram of the general method.
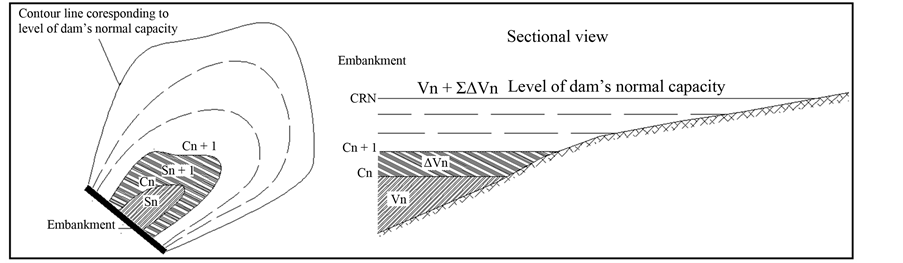
Figure 4. Diagram explaining the initial elevation capacity curve components.

Table 1. Data of the elevation-capacity curve.

Figure 5. Example of elevation capacity curve.
To calculate the silting volume in small dams when the survey bathymetry is not possible technically and financially, the manager of these structures applies generally the initial elevation-area-capacity curve of the dam. One or two employees surveyed the level of silt just on the embankment, and then we projected this level on the elevation-capacity curve which informed us about the volume of “silt”. But this process assumes that the silting is considered like water. It means that the silting move horizontally on the surface of the dam’s basin which is so doubting.
4. The New Proposal Method: Triangulation of the Estimated Silting Level
The application of bathymetric surveying and Remote Sensing in small dams and hillside lakes is not regularly possible. Therefore, a simple and less expensive method is necessary to estimate silting and monitoring its development in small dams. The proposed method consists to build an estimated digital elevation model based on TIN (triangulated irregular network). A TIN is a vector-based representation of the physical land surface or lake bottom, made up of irregularly distributed nodes and lines with three-dimensional coordinates (x, y, and z) that are arranged in a network of no overlapping triangles.
To prepare this estimated digital elevation model for silted surface in dam, we had surveyed a few accessible points on dam’s surface: Figure 6 shows the three surveyed points on the embankment and other accessible points on the surface of silt, although, summer is recommended to survey silting level because of the decrease of water’s level.
Actually, with these few points, we can establish an estimated digital elevation model, and then we can superpose on it the horizontal plan corresponding to the level of normal capacity of the dam which is a data. The difference of the horizontal plan and the estimated digital elevation model represents the new capacity of the dam after the siltation (see Figure 7 and Figure 8). Thus; the volume of the sediment is the difference of the initial capacity and the new calculated capacity.
5. Application of the Proposed Method
5.1. Study Area
The study area consists on seven dams located on the watershed of Souss Massa in center of Morocco (see Figure 9).
The climate is arid to semi-arid. The proximity of the ocean and the influence of the cold current of the Canary Islands mitigate the climate of the area, the mountain barrier of the Anti-Atlas contributes to its protection against the winds from the south. Rainfall is unevenly distributed on the area. The average is about 280 mm and 265 mm in Souss Massa.
The water surface is limited and very irregular. Flows of rivers are erratically within the year. The runoff is only for short periods when it is flooding; sometimes it is so fast and violent. The water potential of the region is estimated at 600 Mm3/year. The minimum and maximum flows recorded are 35 million m3 (1960 to 1961) and 2160 million m3 (1962-1963) (see Figure 10).
The population is currently around 1,680,000 habitants; nearly 53% are in rural areas which have prompted the country, and some NGO (non-governmental organization) to move towards building small dams as a way to satisfy water requirements for rural communities. Today, there are more than 24 hillside dams in the region of
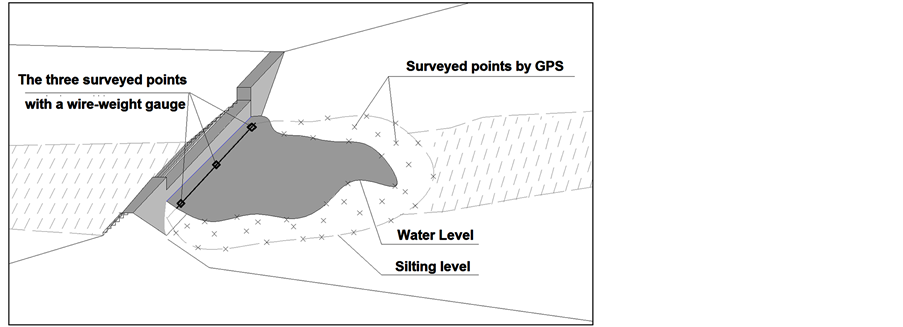
Figure 6. Diagram of the surveyed points necessary for building the digital elevation model estimated of silting.
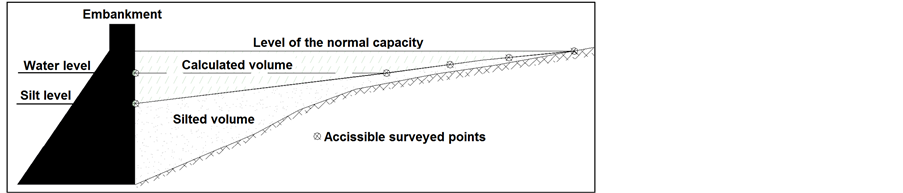
Figure 7. Section of the calculated and silted volume.
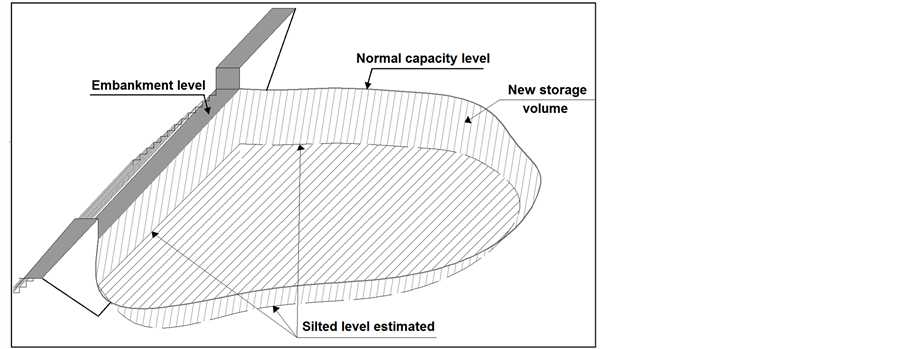
Figure 8. Planer view of the calculated volume (New storage volume).
Souss Massa and it is planned to build more, due to the national program reaching 1000 dams and hill lakes throughout the country.
5.2. Characteristics of Hillside and Small Dams Studied
Table 2 shows some characteristics of the studied dams and their watersheds.
5.3. Materials and Techniques used to Apply the New Proposal Method
5.3.1. The Fieldwork
The equipment required is:
Table 2. Characteristics of hillside and small dams studied.

Figure 9. Geographic situation of the study area.

Figure 10. Structural drought: Rainfall of Taroudant station. (1)1ère période de seheresse (2) Période équilibré (3) Période pluviale (4) 2ème Période de secheresse (5) 3ème Période de secheresse (6) 4ème Période de secheresse.
a) The GPS provides both the geo-positioning point rose and altitude.
b) The wire-weight gauge is used to raise the level of the water and silt at the embankment on three points: the two extremities and the center of the embankment.
H (silt) = H (embankment) − H (measured)
The level of the silt throughout the perimeter of the lake and some accessible points of the dam’s area (dry area) are surveyed by GPS. These measured elevations are corrected by the level of the water which has anaccurate elevation surveyed by the wire-weight gauge. We use this correction because of the inaccuracy of the GPS at elevations.
5.3.2. Data Processing
The process of calculating the volume of sediments on dams consists on seven steps below:
a) Import of the surveyed points by Gps on the software like Covadis or surfer b) Addition of the three points surveyed on the embankment.
c) Building the contour representing the level of the useful dam’s capacity.
d) Establishment of the digital elevation model with the surveyed points e) Superposition of the horizontal plan corresponding to the useful capacity f) Attribution the elevation of the horizontal plan using the initial curve of elevation capacity of the dam.
g) Calculate the existing volume between the horizontal plan and the digital elevation model (see Figure 11).
Finally, the calculated volume is the new useful capacity of dam after siltation, and then we can deduce the volume of silting by the difference of the new and initial useful capacity.
The application of this technique is very affordable compared to other known reliable methods. Nevertheless, it is imperative to check the purpose of validation.
6. Control and Validation of the Proposed Method
The control and validation of the proposed method involved the comparison of its results with those of the following methods:
-The bathymetry survey in the three dams Timicha, Taguenza and Assgherkiys (Figure 12)
-The topographic survey in Tildi (dry lake)

Figure 11. Steps to calculate the sediment volume.
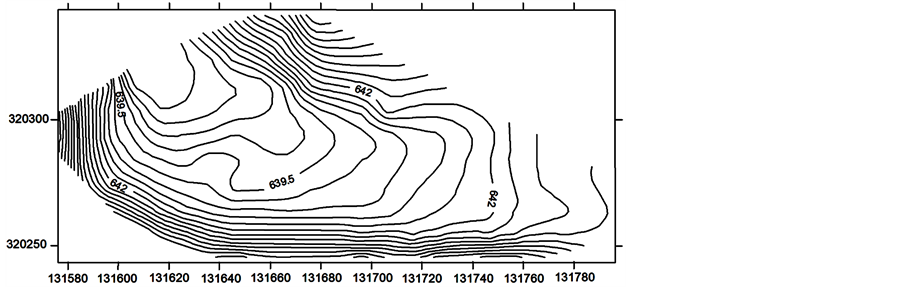
Figure 12. Bathymetry survey of Assgherkiys dam.
-The electrical tomography survey in Tigmi (dry lake).
The above methods are reliable and made on five of seven dams studied, this control gives us a fairly acceptable margin for comparison, control and validation of the new proposed method.
6.1. The Bathymetry Survey in the Three Dams Timicha, Taguenza and Assgherkiys
The bathymetry survey is made by the Agency hydraulic basin Souss Massa Daraa. Data of these surveys are retrieved and processed by the Surfer software to deduce the volume of the silting (Figure 12).
6.2. The Topography Survey in Tildi Dam
For this dam, it was dry, so we didn’t need bathymetry method; the topography survey using a total station was enough.
Surveys are imported from the total station to a computer, and saved in the specific format available for reading points on the software (Covadis, Surfer or other) to build a plan, showed on Figure 13.
6.3. The Electrical Tomography Survey in Tigmi Dam
This method is mainly used for the detection of noble metals, because it is too expensive. But due to the efforts of the team in our laboratory, we had the chance to apply this method in the Tigmi dam which was dry.
In fact, this method is based on the method of electrical resistivity which involves the introduction of an artificially generated electric direct current generally of low frequency (I) according to the source in four electrodes [37] .
The implementation of four profiles in the dam, allowed having the resistivity and thickness of each geological bed in underground toward the profiles. Figure 14 and Figure 15 show the position of surveyed profiles and measures.
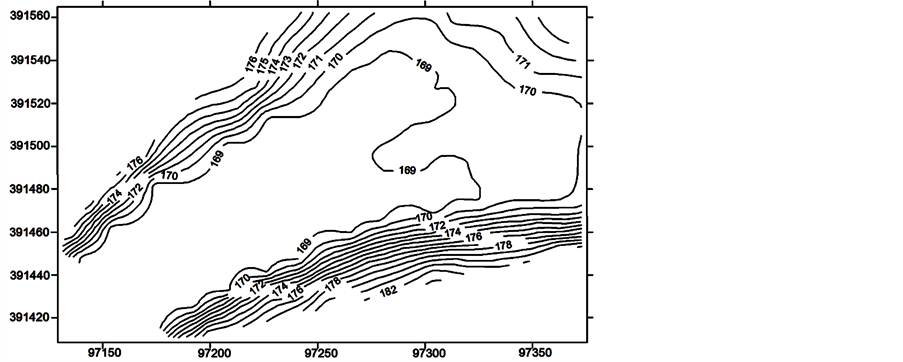
Figure 13. Topography survey of Tildi dam.

Figure 14. Position of the profiles in Tigmi dam.

Figure 15. Electrical tomography survey in Tigmi dam.
7. Results and Discussions
Table 3 and Figure 16 show the measurement results of siltation by the proposed new method Tesl (Triangulation of the estimated silting level), the method of the initial elevation capacity curve and the results of validation methods.
The comparison of the new method results and those of the initial curve commonly used, required the calculation of differences versus validation methods results. These later are shown in Table4
Table 4 shows that the differences between the results obtained by the initial elevation capacity curve method, and those obtained by the validation method (bathymetry) is so significant, the initial elevation capacity curve method underestimates the volume up to 40%. This underestimation decreases if the siltation rate is important. For example, Tildi dam is silted over 90% and showed less difference. This may be explained by silting transport which was by homogeneous decantation and suspension over the entire surface of a lake that induces planar topography of the silt’s surface. This sort of phenomenon is observed in the watersheds with friable lithology as marly limestone (case of Tildi and Tigmi dams). Contrariwise siltation of Assgherkiss and Timichalakes is the result thrusting transport which is generally low and induces the formation of deltas at the entrance of the lake and therefore an irregular surface.
The differences between the results obtained by the new method (Tesl) and those given by the validation methods are acceptable with a slight overestimation does not exceed 2.41% maximum. These results appear very encouraging and very reliable especially because there is no difference between lakes where sedimentation occurs a flat surface and those receiving the materials transported by thrusting and induces an irregular surface.
Generally, the deposition begins at the entrance of the dam by large material by thrusting and forms a delta. Afterward, the smaller materials and fine particles are carried by density currents through the embankment. Figure 17 shows the process of sedimentation of a dam [38] .
The patterns bellow on Figure 18, show the portion of the silted volume by the initial curve method and by the new proposed method. It is noted that the initial method ignores the deltas created by silting at the entrance of the reservoir and the slope of the reservoir.
The new proposed method gives results closer to those of validation methods that are more accurate. This new method is also applicable on both of planer and irregular surfaces, then it can be considered technically a reliable method and deserves to be applied instead of the commonly used method of the initial elevation capacity curve.
The advantage of the new method is that its cost ten to twenty times less than the bathymetry survey. Therefore, it is recommended for users of small dams and hillside dams who generally have limited financial and technical resources.
The new technique has a scientific contribution since it allows the estimation of sediment transport in the sub watersheds and used in the screening of future sites of small dams and hillside lakes.
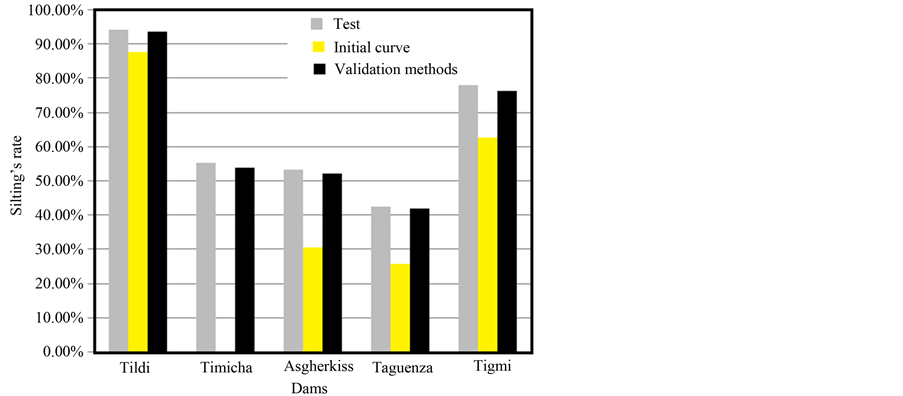
Figure 16. Graph of calculated silting volumes by the three methods.

Figure 17. Process of sedimentation in dam.
Table 3. Calculated Volumes of silting.
Table 4. Differences between validation method results and the others.
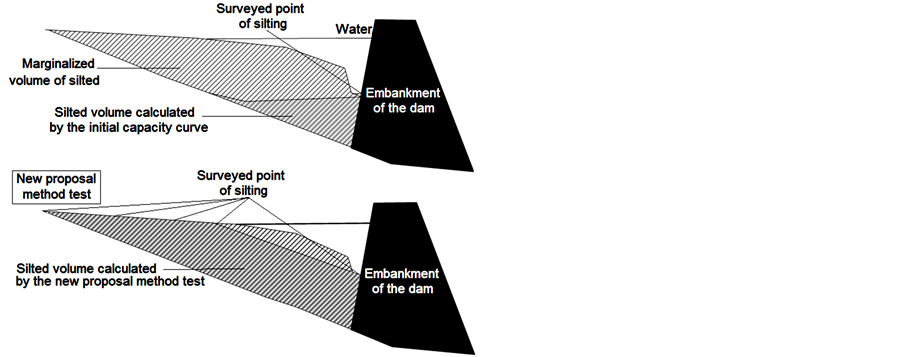
Figure 18. Marginalized volumes by the tow methods.
8. Conclusions
Small dams and hillside lakes which are usually located in fragile environments with low economic activity play a vital role in the sustainable development of these areas. Arid and semi-arid areas are most affected by recurrent drought periods, hence followed by the construction of these dams for water conservation. However, these small hydraulic structures are greatly threatened by siltation, which limits their durability and makes their aim uncertain.
In fact, the scourge of the dams silting is not new. It tormented the managers of these structures due to antiquity and will continue to do it. This is a natural phenomenon; therefore, the prevention remains the most efficient way to mitigate it. The measurement of siltation in dams is an important step to understand and master its operation. This direct measurement of siltation is not always easy and attainable to the responsible of small dams and hillside lakes. In this context, we would like to propose a new method of measuring siltation, less expensive than those currently used. This new method is validated by the more precise method as bathymetry survey and others recognized methods in five hillside dams. Thus, this method could be recommended for the measurement of siltation in the small dams and hillside lakes especially by the NGOs and communities who have limited technical and financial resources.
The adoption of this method will allow studying a larger number of small dams and hillside lakes sites. The measures will help understand the specificity of each sub-basin, then to identify the significant indicators of siltation. Finally, we can use these detected indicators for studying the proposal best sites for the future small dams.
Acknowledgements
The authors are grateful to the members of the HBASMD (Hydraulic Basin Agency Souss Massa Draa), especially Mr. Hamza Elhimri. Also, Mr. Jamal Hallam, Researcher in Soil Science and Environment at CARA (Center of Agronomic Researches Agadir) for his cooperation and assistance.
References
- Benyounes (1985) Les lacs collinaires au Maroc, communication orale faite le 28 Fevrier 1985, au Cefigre (centre de formation international a la gestion des ressources en eau) Valbonne, France, 59-64.
- Albergel, Selmi et Balieu (2000) Les petits barrages dans la zone semi aride mediterraneenne, Seminaire international Montpelier. Hydrologie des zones mediterraneennes, PHI-V Documents techniques en hydrologie No. 51, 168-176.
- Albergel, Nasri, Boufaroua, Marzouk (2004) Petits barrages et lacs collinaires, amenagements originaux de conservation des eaux et de protection des infrastructures aval: Exemples des petits barrages en Afrique du Nord et au Proche-Orient, Secheresse, note de recherche, 78-86.
- Selmi, S., Sai, B. and Hammami, M. (ESA-Mograne) (2001) Mission IRD-Tunisie, La valorisation des ressources en eau aleatoires et non perennes par le developpement de l’olivier autour des lacs collinaires en Tunisie. Sciences et Changements Planetaires/Secheresse, 12, 45-50.
- Gabiecht, J.D. and Garbrecht, G.K.H. (2004) Siltation behind Dams in Antiquity. In: Water Resources and Environmental History, American Society of Civil Engineers, 35-43.
- De Vente, J. and Poesen, J. (2005) Predicting Soil Erosion and Sediment Yield at the Basin Scale: Scale Issues and Semi-Quantitative Models. Earth-Science Reviews, 71, 95-125.
- Romero-Diaz, A., Marin-Sanleandro, P. and Ortiz-Silla, R. (2012) Loss of Soil Fertility Estimated from Sediment Trapped in Check Dams. South-Eastern Spain. CATENA, 99, 42-53. http://dx.doi.org/10.1016/j.catena.2012.07.006
- Claude, J. and Chartier, R. (1977) Mesure de l’envasement dans les retenues de six barrages en Tunisie Campagne de 1975. Cahier Orstom, Serie Hydrologie, 14, 33.
- Lahlou, A. (1982) La degradation specifique des bassins versants et son impact sur l'envasement des barrages. Recent Developments in the Explanation and Prediction of Erosion and Sediment Yield. Proceedings of the Exeter Symposium, July 1982, IAHS Publication No. 137.
- Benmammou, Elouati (2007) Evolution temporelle de l’envasement des retenues de barrages de Tunisie, Revue des sciences de l'eau. Journal of Water Science, 20, 201-210.
- Abdellaoui, Merzouk, Aberkane, Albergel (2002) Bilan hydrologique et envasement du barrage Saboun (Maroc). Revue des sciences de l'eau/Journal of Water Science, 15, 737-748.
- Abdellaoui, B., Merzouk, A., Pepin, Y., Aberkane, M. and Albergel, J. (2009) Simulation du bilan hydro sedimentaire d’un barrage collinaire en zone marneuse mediterraneenne (cas du barrage saboun, Maroc). Revue des sciences de l'eau/ Journal of Water Science, 22, 487-504.
- Serban, G.H. (2011) Silting Evaluation on Gilau Reservoir Using G.I.S Technics. Revis Tariscuri si Catastrophe, 10, 227-237
- Ghorbel, A. and Claude, J. (1982) Mesure de l'envasement dans les retenues de sept barrages en Tunisie: Estimation des transports solides. Institut de recherche pour le developpement en cooperation (ORSTOM), 14.
- Camus, B., Guiguen, N. and Benyouness, M. (1995) Note sur l'envasement de lacs collinaires en zone semi-aride tunisienne. Institut de recherche pour le developpement en cooperation (ORSTOM), 68.
- Garetta, O. (1998) Note sur l’envasement du barrage d’el haouareb Tunis (FRA), Tunis (IRD), Ministere de l’agriculture, 17 p.
- Albergel, J., Pepin, Y., Nasri, S. and Boufaroua, M. (2003) Erosion et transport solide dans des petits bassins mediteraneens. Hydrology of the Mediterranean and Semiarid Regions. Proceedings of an International Symposium, Montpellier, 1-4 April 2003, 373-379.
- Kovacs, A.S., Fulop, B. and Honti, M. (2012) Detection of Hot Spots of Soil Erosion and Reservoir Siltation in Ungauged Mediterranean Catchments. Energy Procedia, 18, 934-943. http://dx.doi.org/10.1016/j.egypro.2012.05.108
- Mazour, M., Morsli, B., Sabir, M., Roose, E. and Arabi, M. (2012) Soixante Annees de Recherches En Cooperation Sur L’erosion Hydrique et La Lutte Antierosive Au Maghreb. Physio-Geo, 6, 43-69.
- Kassoul, M., Abdelgader, A. and Belorgey, M. (1997) Caracterisation de la sedimentation des barrages en Algerie. Revue des sciences de l’eau, 10, 339-358.
- Mahjoub, M.R., Berguaoui, M., Souissi, A. and Bouferoua, M. (2001) Regionalisation de l’envasement des lacs collinaires au niveau de la dorsale tunisienne. Sud Sciences & Technologies, 7, 12.
- Remini, B. and Hallouche, W. (2005) Prevision de l’envasement dans les barrages du Maghreb. Larhyss Journal, 4, 69-80.
- Hentati, A., Kawamura, A., Amaguchi, H. and Iseri, Y. (2010) Evaluation of Sedimentation Vulnerability at Small Hillside Reservoirs in the Semi-Arid Region of Tunisia Using the Self-Organizing Map. Geomorphology, 122, 56-64. http://dx.doi.org/10.1016/j.geomorph.2010.05.013
- Kouhpeima, A., Hashemi, S.A.A., Feiznia, S. and Ahmadi, H. (2010) Using Sediment Deposited in Small Reservoirs to Quantify Sediment Yield in Two Small Catchments of Iran. Journal of Sustainable Development, 3, 133-139.
- Bouras, F., Djebbar, Y. and Abida, H. (2010) Estimation de L’envasement des Barrages: Une Approche non Parametrique. Journal International Environmental Conflict Management, 114-119.
- Ayadi, I., Abida, H. and Djebbar, Y. (2008) Regionalisation de l’envasement des retenues collinaires application aux lacs collinaires de Tunisie centrale. 13th World Water Congress, Montpellier, 1-4 September 2008, p. 14.
- Ayadi, I., Abida, H., Djebbaret, Y. and Mahjoubl, M. (2010) Sediment Yield Variability in Central Tunisia: A Quantitative Analysis of Its Controlling Factors. Hydrological Sciences Journal, 55, 446-458.
- Ayadi, I. and Abida, H. (2012) Spatial Variability of the Sediment Yield in Hillside Reservoirs in the Tunisian Dorsal. 3rd STAHY International Workshop on Statistical Methods for Hydrology and Water Resources Management, Tunis, 1-2 October 2012, p. 14.
- Chikhaoui1, M., Merzouk, A., Lacaze, B. and Madramootoo1, C.A. (2010) Etude de la degradation des sols en milieu semi-aride a l’aide de l’approche neuronale et de donnees multi sources. Revue Teledetection, 9, 139-150
- Bekhti, B., Errih, M. and Adda, M.S. (2012) Modelisation de la sedimentation dans les retenues de barrages en Algerie (barrage Es-Saada). Secheresse, 23, 38-47.
- Krasa, J., Dostal, T., Van Rompaey, A., Vaska, J. and Vrana, K. (2005) Reservoir’s Siltation Measurements and Sediment Transport Assessment in the Czech Republic, the Vrchlice Catchment Study. CATENA, 64, 348-362. http://dx.doi.org/10.1016/j.catena.2005.08.015
- Hashemi, S.A.A. and Khedri, M.A. (2008) Evaluation of EPM Model by Sediment Measurement in Reservoirs of Small Dams. Journal of Science and Technology of Agriculture and Natural Resources, 11, 345-355.
- Lim, K.J., Sagong, M., Engel, B.A., Tang, Z., Choi, J. and Kim, K.S. (2005) GIS-Based Sediment Assessment Tool. CATENA, 64, 61-80. http://dx.doi.org/10.1016/j.catena.2005.06.013
- Ouechtati, S. and Baldassarre, G. (2011) Evaluation du Transport Solide et de L’envasement Dans Le Bassin Versant de Siliana (Tunisie): Cas Des Barrages Siliana et Lakhmess. Bulletin of Engineering Geology and the Environment, 70, 709-722.
- Bruk (1986) Methodes de calcul de la sedimentation dans les lacs et les reservoirs, contribution au Programme Hydrologique Internationale PHI-II Project A.2.6.1 Panel StevanBruk, Rapporteur.
- Kalvit, S.K. and Kulkarni, S.N. (2010) Remote Sensing for Monitoring Sedimentation in Maharashtra’s Lakes. Environmental Information System, Center for Ecological Sciences Indian Institute of Sciences, India. Lake 2010: Wetlands, Biodiversity and Climate Change, Theme (13), 22-24 December 2010, p. 11.
- Rentier, C. (2003) Methode stochastique de delimitation des zones de protection autour des captages d’eau—Conditionnement par des mesures de conductivite hydraulique K, de hauteur piezometrique h et de resistivite electrique ρ, Annexe B; Principe de la tomographie electriqueBictel/e, Universite de liege, Serveur institutionnel des theses de doctorat soutenue le14-03-2003.
- Al-Taiee, T.M. (2005) Distribution of Bed Sediment Material in the Mosul Reservoir, Iraq. Journal of Environmental Hydrology, 12, 1-8.