Journal of Water Resource and Protection
Vol.6 No.6(2014), Article ID:45462,10 pages DOI:10.4236/jwarp.2014.66058
Comparison and Assessment of Success of Models in Watershed Simulation and Management
Maisa’a W. Shammout
Water, Energy and Environment Center, The University of Jordan, Amman, Jordan
Email: maisa_shammout@hotmail.com, m.shammout@ju.edu.jo
Copyright © 2014 by author and Scientific Research Publishing Inc.
This work is licensed under the Creative Commons Attribution International License (CC BY).
http://creativecommons.org/licenses/by/4.0/


Received 24 February 2014; revised 21 March 2014; accepted 17 April 2014
ABSTRACT
In Jordan, Zarqa River Basin (ZRB) has been taken as a case study for applying water management models because of its limited water resources and due to the fact that the basin is dwelling with about 52% of Jordan’s population. The surface water resources are mainly used for agriculture because they are mixed with treated water and cannot be used for domestic purposes. This paper aims to demonstrate the contributions of Models in watershed management that provide indirect ways of assessing and confirming the success of models in water flow simulation. The method includes transferring the computed hydrologic parameters for Zarqa basin’s sub-catchments within Watershed Modeling System (WMS) into Water Resources Model (WRM) and HEC-1 models. Then the results of the HEC-1 and WRM models are compared according to their basin’s simulation with the real basin. The study includes description of the HEC-1, WRM models philosophy, the models representation, and simulation results and analysis of the Zarqa River Basin. Comparing the results of WRM and HEC-1 models proved their simulation efficiency in predicting the flow of Zarqa River Basin. Nevertheless, the philosophy of HEC-1 is a single storm event and is based on values of curve number, while WRM philosophy describes the water flow and availability, and demand and supply balance on a daily basis across the basin. The models’ predictions for the real flow definitely establish the modeling certainty and help the water resources’ developers to incorporate different basin features for watershed representation, simulation, and management. Hence, the certainty of the results in modeling provides indirect ways of assessing the success of models’ simulations.
Keywords:Water Scarcity, Watershed Management, Watershed Modeling System, Water Resources Model, Watershed Simulation

1. Introduction
Jordan is classified among countries of the world with limited water resources and it is considered as one of the lowest on a per capita basis. The available water resources per capita are falling as a result of population growth and are projected to fall from less than 150 m3/capita/year at present to about 90 m3/capita/year by 2025, putting Jordan in the category of an absolute water shortage. The scarcity of water in Jordan is the single most important constrains to the country growth and development because water is not only considered a factor for food production but a very crucial factor of health, survival and social and economical development. As a result of scarcity, the demands and uses of water are far exceeding renewable supply. Groundwater that used for domestic purposes are not enough to satisfy the growing demand for domestic and industrial sectors [1] .
Surface water resources in Jordan are distributed among 15 major basins. Zarqa River Basin is considered as one of the most significant basin with respect to its economical, social and agricultural importance since it is the second main tributary to Jordan River. Zarqa River basin drains an area of about 4120 square kilometres (km2) where about 95% of its area is within Jordan and about 5% is in Syria. The basin suffers several water problems ranging from management, quality and conflict issues as well as allocation among sectors [2] [3] . The water system in the basin is a complex characteristics where surface water mixed with treated effluent are stored at a reservoir located at the outlet of the basin and is used for irrigation in the Jordan valley; groundwater within the basin are used for the three sectors; surface fresh water are pumped to the basin from the Jordan valley for domestic use; and ground water from different basins are transferred to meet the growing domestic demand [4] . The heavy utilization of Zarqa basin has resulted in reducing the base flow of Zarqa River from 5 m3/s to less than 1 m3/s and the discharge of springs from an average 317 MCM prior to 1985 to less than 130 MCM after 2000. Similar conditions are observed in other side wadis. Moreover, about 52% (3.25 million) of Jordan population lives in the basin compared to 6.249 million in the country [5] . Administratively, the basin is located in five governorates, namely; Amman, Balqa’a, Zarqa, Jarash, and Mafraq. Table 1 shows these governorates and their populations.
For these reasons, simulating models for watershed management are needed to represent and simulate the critical situation of Zarqa River Basin. Hydrological data are incorporated into the Watershed Modeling System (WMS) represented in HEC-1 model; the rainfall-runoff simulation, and the WaterWare water resources management information system is represented by using Water Resources Model (WRM); the dynamic water allocation and budget Model. HEC-1 model is developed by the Hydrologic Engineering Centre while the WRM is implemented as web-based distributed client-server systems and provided by Environmental Software SystemsESS, Austria. The results of the HEC-1 and WRM models are compared according to their basin’s simulation. The study includes description of the HEC-1, WRM models philosophy, the models representation, simulation results and analysis of the Zarqa River Basin.
This paper aims to demonstrate the contributions of Models in watershed management that provide indirect ways of assessing and confirming the success of models in water flow simulation.
2. Modeling Tools Philosophy
2.1. HEC-1 Model Philosophy
The HEC-1 model is fully linked with the Watershed Modeling System (WMS) Software. HEC-1 is developed by the Hydrologic Engineering Centre. It is the most commonly-used lumped parameter model available. HEC-1 model is designed to simulate the surface runoff response of a river basin to precipitation by representing the ba

Table 1. Zarqa River Basin Population of the Year 2011.
sin as an interconnected system of hydrologic and hydraulic components. It is a single storm event, and includes several options for modeling and computing total runoff volume of each rain storm.
Precipitation loss is calculated based on supplied values of curve number (CN) and initial surface moisture storage capacity. CN and surface moisture storage capacity are related to a total runoff depth for a storm. Curve numbers in hydrology are used to determine how much rainfall infiltrates and how much becomes runoff.
Each component models an aspect of the precipitation-runoff process within a portion of the basin, commonly referred to as a sub-basin. A component may represent a surface runoff entity, a stream channel, or a reservoir. Representation of a component requires a set of parameters which specify the particular characteristics of the component and mathematical relations which describe the physical processes. The result of the modeling process is the computation of stream flow hydrographs at desired locations in the river basin [6] .
Watershed Modeling System (WMS) Software supports several techniques to be efficient in preparing the initial model requirements. It is used to define watershed characteristics using a Digital Elevation Model (DEM). WMS is used in determining the flow direction and accumulation, stream network, basin outlet, and interior outlets, for creating the entire watershed and its sub-basins using Topographic Parameterization Program (TOPAZ). The average rainfall, area/elevation can be derived for each sub-basin based on hydrologic sub-basin parameters computed by WMS. The results obtained from WMS are used as an input for models; HEC-1 Model, and the Water Resources Model (WRM).
2.2. Water Resources Management Model Philosophy
The water resources model (WRM) is one of the core components of the Water Ware system. It describes the water flow and availability, demand and supply balance on a daily basis across the basin and its elements, based on conservation and continuity laws [7] .
In order to simulate the behaviour of a river basin over time, the river basin is described as a system of nodes and arcs. These nodes represent the different components of a river system as diversions, irrigation areas, reservoirs, etc., and can indicate points of water inflow to the basin, storage facilities, control structures, demand for specific uses. The nodes are connected by arcs which represent natural or man-made channels which carry flow through the river system [8] [9] .
3. The Models Representation of Zarqa River Basin
Any year can be entered into the models and thus will be hydrologically analyzed. To represent Zarqa River Basin, the hydrological year of 2001/2002 is taken because it is an average rainy season with good distribution of rainfall amounts. For that year, all data related to groundwater and wells extraction are available and their records are on daily basis. Other data that are also available concern the flood records at one gauging station, metrological data from 10 stations, and influent and effluent of the four wastewater treatment plants (WWTP).
3.1. Stream Network, Sub-Basins Representation via Watershed Modeling System and HEC-1 Model
Zarqa River Basin (ZRB) is subdivided into an interconnected system of stream network components using topographic maps of 1:50,000 scale and Digital Elevation Model (DEM) with resolution of 30 m. Figure 1 shows the Zarqa River course on topographic map and DEM. The basin is delineated to determine its boundaries, drainage network, and outlet. The basin is divided into 6 sub-basins (SB), namely; Upper Dhleil, Lower Dhleil, Amman, Jerash, Suileh/Ketteh, and Al-Salt sub-basin as shown in Figure 2. These sub-basins are subdivided based on basin slope (BS), rainfall amounts and distribution, urban centres, and hydrological boundaries. In each sub-basin, the catchments contribution to the main stream is determined using the weighted average of the sub-basin according to the rainfall distribution and the hydrological characteristics of each sub-basin to the whole basin. Figure 3 shows the Gages Weights of sub-basin. HEC-1 model within WMS software is run and is verified according to the records of Runoff Gauge at Jerash Bridge (control gauge).
3.2. Stream Network, Sub-Basins Representation via Waterware Applying Water Resources Model
The derived data from WMS are used as input files and initial requirements for running the WRM model. Iden-
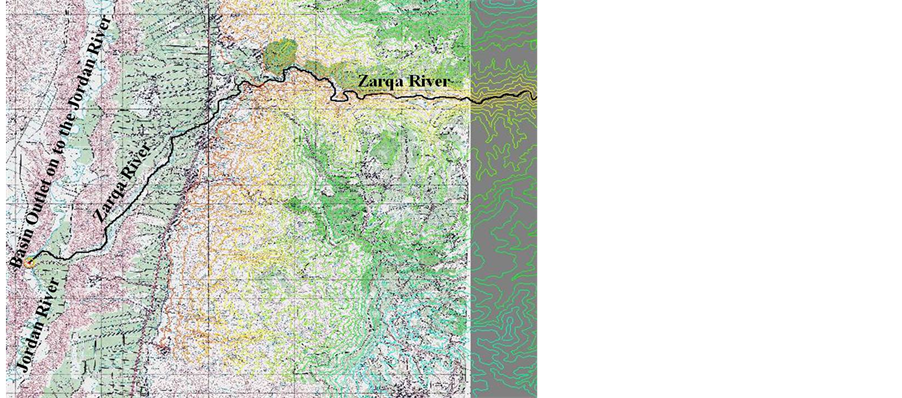
Figure 1. Zarqa River course on the Topographic Map and DEM.
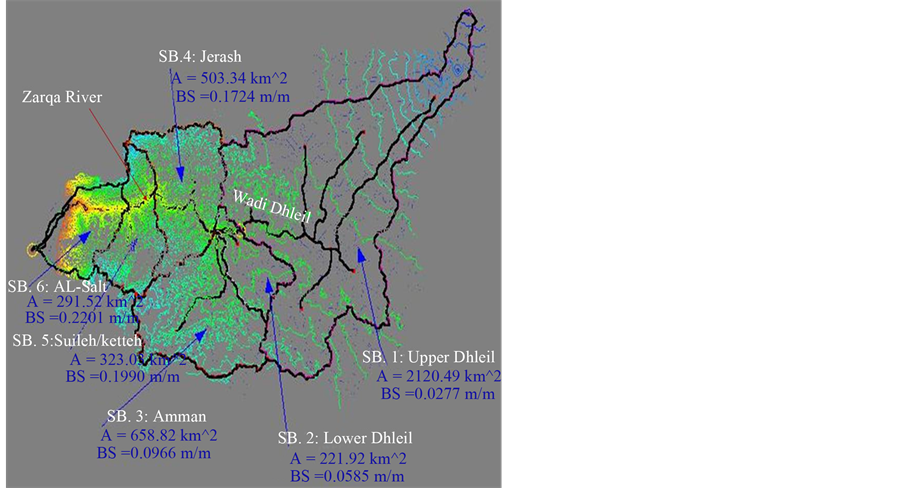
Figure 2. Zarqa River sub-basins.
tification of Zarqa River Basin, sub-basins, streams, and the computed hydrological parameters help in representing and simulating ZRB in terms of nodes and reaches according to facilities provided by Environmental Software Systems-ESS [10] [11] . Thus, all objects of each sub-basin (6-SBs) are displayed on a topology map. The detailed methodology and results of application of WRM for ZRB have been presented in previous papers [4] [12] . Figure 4 shows the displayed nodes. Supply and demand nodes for different purposes namely; agriculture, domestic, and industry data are specified for functional nodes.
The water resource system in Zarqa River Basin is complicated due to the high water demand compared to the limited water supply. In addition, the surface water resources are mainly used for agriculture because they are polluted with treated water and cannot be used for domestic purposes. The total number of groundwater wells in the basin for the studied year is 752 wells, where 740 of them are productive wells. Data for the daily discharges, the coordinates, and the purpose of use of these wells are obtained from the Ministry of Water and Irrigation [13] . Groundwater that is used for domestic purposes is not enough to satisfy the growing demand of domestic and industrial sectors. Therefore, additional water supply is transferred from other basins namely; Azraq, Lajoun,
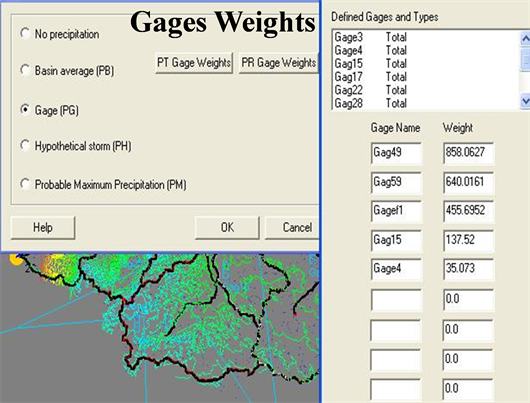
Figure 3. The gages weights of the sub-basins.
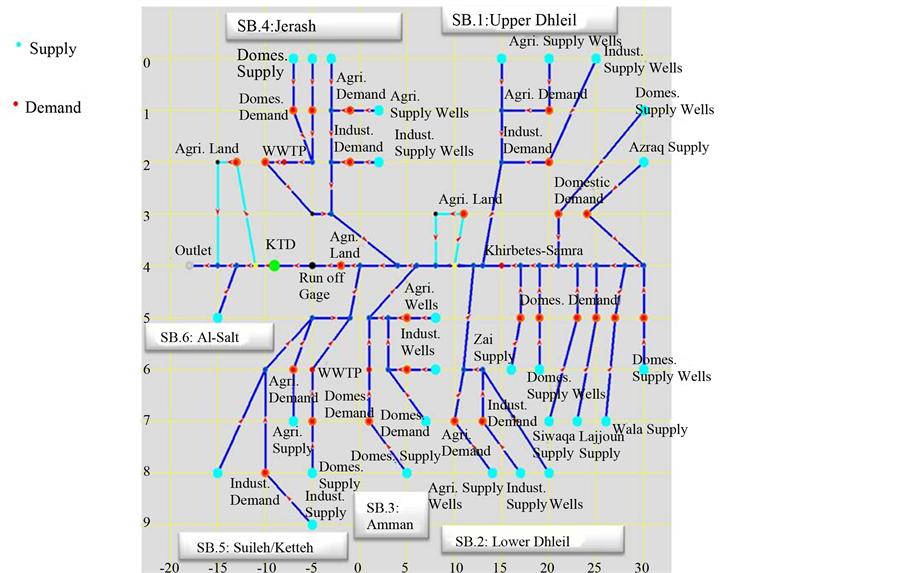
Figure 4. Topology Map of the Zarqa River Basin.
Swaqa, and Zai. The surface water originated from the basin as flood flow mixed with treated water are used partly for irrigation along the river and the rest are stored in King Talal Dam to be released for irrigation downstream and in the Jordan valley. Table 2 and Table 3 show the inter-basin transfer in MCM and the hydraulic load of the wastewater treatment plants in m3/sec.
Furthermore, for each functional node type of the WRM, all input and output data as time series are stored in the data base with its respective node for the hydrological year 2001/2002 to facilitate processing, results, and analysis. The application of WRM for ZRB has been presented in a previous paper [4] with complete description of its components that includes nodes and reaches. The network of ZRB is translated and conceptualized into a topology map of ninety five input-output nodes as shown in Figure 4.
Table 2. Supply from Inter-Basin Transfer (MCM) for the 2001/2002.
Table 3. The hydraulic load of the wastewater treatment plants for 2001/2002.
4. Simulation Results and Analysis
4.1. HEC-1 Model
The data base describes Zarqa Basin in monitoring time series of rainfall, runoff data, and the main components of the HEC-1 model i.e. the curve numbers. Referring to Shammout, 2003 [2] , the average curve numbers for Zarqa River Basin under dry condition are 59, 78 under a normal condition and 89 under a wet condition. During vegetation period, the average curve numbers under dry condition are 52, 72 under a normal condition and 86 under a wet condition.
HEC-1 is run using the huge capability of WMS. The data used for running the model starts from 1/10/2001 to 30/5/2002. Table 4 shows the computed sub-basin’s area, slope, and the rainfall weighted average. It can be seen from Table 4 that the calculated rainfall weighted average in MCM for Upper Dhleil, Lower Dhleil, Amman, Jerash, Suileh/ Ketteh, and Al-Salt sub-basins are 293.11, 32.98, 245.0, 61.49, 147.67, and 130.9 respectively, where the total rainfall is 911.15 MCM. The certainty of HEC-1 application will be deduced from the compatibility of the modeled flow to the actual flow data. For instance, the availability of daily runoff data allows the calibration of the modeled flow with known data series [2] . Therefore, the results of running HEC-1 model are achieved and show that the annual predicted (modeled) runoff volume in MCM is 36.4 from the total rainfall storms. In comparison with measured (actual) total runoff volume of the Runoff Gauge at Jerash Bridge which is 36.6 MCM as shown in Table 5, is compatible to the modeled runoff. Thus, the predicted runoff with a value of 36.4 MCM very well matches the figures of the Ministry of Water and Irrigation [13] and it excludes the effluent of Khirbet es-Samra WWTP.
4.2. Water Resources Model
WRM is run online using the huge capability of ESS server. Table 6 shows the computed water resources in MCM of ZRB using WRM for each SBs.
It can be seen from Table 6 that the calculated surface runoff (flood + base flow) in MCM via WRM for Upper Dhleil, Lower Dhleil, Amman, Jerash, Suileh/ Ketteh, and Al-Salt sub-basins are 6.53, 5.6, 26.13, 28, 28, and 2.8 respectively. The total volume contribution of surface runoff of the 6-sub-basins is 97.1 MCM including the effluent from the treatment plants i.e. (base flow + flood). Besides, the flood gauge station of Jerash Road Bridge is the only gauge in watershed that has complete runoff records and is considered as the control node.
Table 4. The sub-basin’s area, slope, and the rainfall weighted average.
Table 5. Predicted and measured total runoff volume.
Table 6. Water resources of Zarqa River Basin for each sub-basin of the 2001/2002.
Furthermore, the wastewater treatment plant at Khirbet es-Samra can also be considered as a control node for model certainty since the influent amounts as a daily record can be compared with wastewater discharge of the sewer systems. Figure 5 shows the actual data and location of the control node at Jerash Bridge, and Figure 6 shows the analysis of control nodes of Runoff Gauge at Jarash Bridge and Khirbet es-Samra WWTP.
Figure 6 shows the analysis of the control node where the average modeled flow is 2.97 m3/s, which is compatible to the actual measured flow at the gauging station (Jarash Bridge) with a value of 2.96 m3/s. Thus, the total inflow is 93.68 MCM (base flow and flood), which very well matches the figures of the Ministry of Water and Irrigation with a value of 93.32 MCM. Furthermore, it can be seen from Figure 6 that the modeled wastewater treatment plant node at khirbet es-Samra is 63.53 MCM with a maximum flow of 2.43 m3/sec, which matches the figures of the actual data (Table 3) with a value of 2.4 m3/sec.
4.3. Comparison between HEC-1 Model and WRM
Comparing the results of WRM and HEC-1 models proved their simulation efficiency in predicting the flow of Zarqa River Basin. However, the philosophy of HEC-1 is a single storm event and is based on values of curve number, while WRM philosophy describes the water flow and availability, and demand and supply balance on a daily basis across the basin as shown in Table 7.
5. Conclusions
Assessing different modeling tools to produce comparative analysis is achievable and helps considerably the decision makers in managing watershed of scarce water resources. WMS proved its efficiency in preparing the initial models’ requirements and is used to define watershed characteristics using a Digital Elevation Model (DEM). WMS is used in determining the flow direction and accumulation, stream network, basin outlet, and interior outlets, for creating the entire watershed and its sub-basins. The average rainfall and area/elevation can be derived for each sub-basin based on hydrologic sub-basin parameters. The results obtained from WMS are used as an input for models; HEC-1 Model, and the Water Resources Model (WRM).
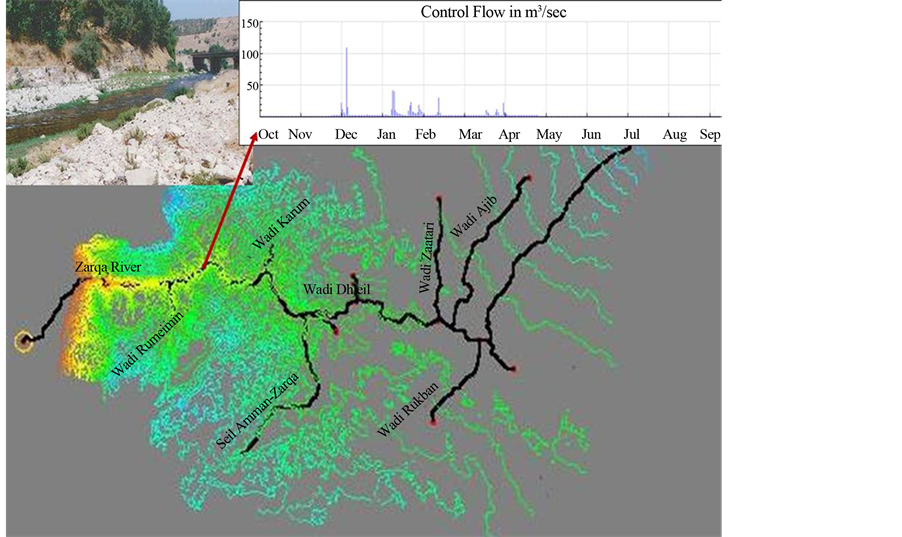
Figure 5. The actual flow data of the control node at Jerash Bridge.
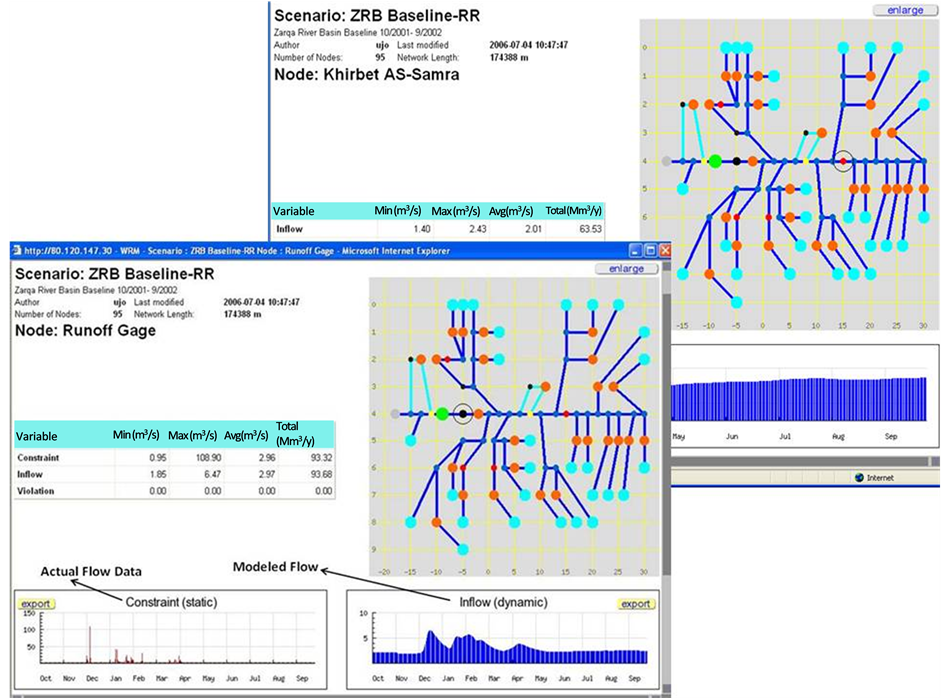
Figure 6. The analysis of the control nodes.
Table 7. Comparison between HEC-1 Model and WRM Model.
The results of running HEC-1 model are achieved and show that the annual predicted (modeled) runoff volume in MCM is 36.4 from the total rainfall storms. In comparison with measured (actual) total runoff volume of the Runoff Gauge at Jerash Bridge which is 36.6 MCM, is compatible to the modeled runoff. Whereas, the results of running WRM show that the total inflow is 93.68 MCM (base flow and flood), which very well matches the figures of the Ministry of Water and Irrigation with a value of 93.32. Besides, the modeled wastewater treatment plant node at khirbet es-Samra is 63.53 MCM with maximum flow of 2.43 m3/sec which matches the figures of the actual data with a value of 2.4 m3/sec.
Comparing the results of WRM and HEC-1 models proved their simulation efficiency in predicting the flow of Zarqa River Basin. Nevertheless, the philosophy of HEC-1 is a single storm event and is based on values of curve number, while WRM philosophy describes the water flow and availability, and demand and supply balance on a daily basis across the basin. The models’ predictions for the real flow definitely establish the modeling certainty and help water resources developers to incorporate different basin features for watershed representation, simulation, and management. Hence, the certainty of the results in modeling provides indirect ways of assessing the success of models’ simulations.
Acknowledgements
The application on WRM was carried out with financial support from the European Commission under FP6 INCO-MED Program; contract INCO-CT-2004-509091.
References
- Jasem, A.H., Shammout, M., AlRousan, D. and AlRaggad, M. (2011) The Fate of Disi Aquifer as Stratigic Groundwater Reserve for Shared Countries (Jordan and Saudi Arabia). Journal of Water Resource and Protection, 3, 711-714. http://dx.doi.org/10.4236/jwarp.2011.310081
- Shammout, M.W. (2003) Land Use Options for Surface Water Management in Zarqa River Basin Using Modeling Tools. Ph.D. Dissertation, The University of Jordan, Amman.
- Shatanawi, M., Shammout, M.W. and Naber, S. (2008) Water Conflicts among Sectors and Environmental Uses in Jordan. OPTIONS Méditerranéennes, Mediterranean Seminars, Water Culture and Water Conflict in the Mediterranean Area, Series A, 83, 159-172. http://ressources.ciheam.org/util/search/detail_numero.php?mot=384&langue=en
- Shatanawi, M. and Shammout, M.W. (2011) Supply-Demand Modeling of Water Resources in Zarqa River Basin in Jordan. International Journal of Applied Environmental Sciences (IJAES), 6, 261-278. http://www.ripublication.com/Volume/ijaesv6n3.htm
- DOS (2011) Statistical Year Book 2011. Department of Statistics, Amman. http://www.dos.gov.jo
- Corps of Engineers (1998) HEC-1 Flood Hydrograph Package. User’s Manual, Hydrologic Engineering Centre, US Army Corps of Engineers, Davis.
- Chow, V.T., Maidment, D.R. and Mays, L.W. (1988) Applied Hydrology. International Edition, McGraw-Hill Book Company, New York.
- http://www.ess.co.at/MANUALS/WATERWARE/wrmmodel.html
- http://www.ess.co.at/WATERWARE
- http://www.ess.co.at/OPTIMA/
- http://www.ess.co.at/OPTIMA/cases.html
- Shammout, M.W., Shatanawi, M. and Naber, S. (2013) Participatory Optimization Scenario for Water Resources Management: A Case from Jordan. Water Resources Management, 27, 1949-1962. http://dx.doi.org/10.1007/s11269-013-0264-9
- Ministry of Water and Irrigation (2002) Open Files. Amman.