Journal of Water Resource and Protection
Vol.5 No.2(2013), Article ID:27688,12 pages DOI:10.4236/jwarp.2013.52019
Long-Term Assessment of Nitrogen Pollution Load Potential for Groundwater by Mass Balance Analysis in the Tedori River Alluvial Fan Area, Japan
1Faculty of Bioresources and Environmental Science, Ishikawa Prefectural University, Nonoichi, Japan
2College of Bioresource Sciences, Nihon University, Nonoichi, Japan
Email: *maruyama@ishikawa-pu.ac.jp
Received November 22, 2012; revised December 23, 2012; accepted December 31, 2012
Keywords: Water Balance; Nitrogen Balance; Groundwater Pollution; Sewage Treatment Water; Pollution from Farmland; Nitrogen Pollution Load Potential
ABSTRACT
To evaluate the nitrogen pollution load in an aquifer, a water and nitrogen balance analysis was conducted over a thirty-five year period at five yearly intervals. First, we established a two-horizon model comprising a channel/soil horizon, and an aquifer horizon, with exchange of water between the aquifer and river. The nitrogen balance was estimated from the product of nitrogen concentration and water flow obtained from the water balance analysis. The aquifer nitrogen balance results were as follows: 1) In the aquifer horizon, the total nitrogen pollution load potential (NPLP) peaked in the period 1981-1990 at 1800 t∙yr−1; following this the NPLP rapidly decreased to about 600 t∙yr−1 in the period 2006-2010. The largest NPLP input component of 1000 t∙yr−1 in the period 1976-1990 was from farmland. Subsequently, farmland NPLP decreased to only 400 t∙yr−1 between 2006 and 2010. The second largest input component, 600 t∙yr−1, was effluent from wastewater treatment works (WWTWs) in the period 1986-1990; this also decreased markedly to about 100 t∙yr−1 between 2006 and 2010; 2) The difference between input and output in the aquifer horizon, used as an index of groundwater pollution, peaked in the period 1986-1990 at about 1200 t∙yr−1. This gradually decreased to about 200 t∙yr−1 by 2006-2010; 3) The temporal change in NPLP coincided with the nitrogen concentration of the rivers in the study area. In addition, nitrogen concentrations in two test wells were 1.0 mg∙l−1 at a depth of 150 m and only 0.25 mg∙l−1 at 50 m, suggesting gradual percolation of the nitrogen polluted water deeper in the aquifer.
1. Introduction
In general, people have a great concern about groundwater quality if they use the groundwater for municipal, industrial and agricultural purposes. Thus, the availability of unpolluted water is a very important factor to their daily life.
In the last few decades, the use of chemical fertilizer applied to farmland has markedly increased. Nitrogen from fertilizer not taken-up by crops percolates through the ground eventually reaching, and thus polluting, groundwater. In addition, the use of wastewater treatment works (WWTWs) has also markedly grown in recent decades in Japan, and nitrogen pollution of groundwater has occurred because wastewater treatment was usually limited to secondary stage processes which do not remove nitrogen. Therefore, nitrogen, not removed by WWTWs flows into the environment eventually reaching and polluting groundwater.
Besides nitrogen pollution originating from agricultural land and WWTWs, there are many sources of nitrogen pollutants such as deposition from precipitation, intake water (where water is taken off to feed irrigation canals), and recharge water from rivers. There are sinks for the removal of nitrogen pollutant components, such as surface and subsurface drainage away from the aquifer, denitrification in paddy fields, and effluent transport in the river. Therefore, to discuss nitrogen pollution of groundwater, all components relating to this pollution must be considered from an integrated (comprehensive) perspective.
Retention time of groundwater is usually very long because of the large capacity of the aquifer and the relatively small rate of recharge. Such characteristics demand that groundwater pollution issues be considered over long periods.
Many hundreds of studies of nitrogen contamination of groundwater have been carried out worldwide. We have listed only a few examples (because of the limitation of space): the nitrogen budget for a late successional hillslope tabonuco forest [1], groundwater contamination by nitrate [2], strategies to reduce nitrate leaching into groundwater [3], impacts of population, food preference and agricultural practice [4], prediction of agriculture derived groundwater nitrate distribution [5], nitrogen cycling with environmental loadings in farming systems [6], distribution of nitrate in groundwater affected by aquitards [7], a new conceptual model of nitrogen saturation on an oak forest [8], and cyclic irrigation of paddy fields at Kasumigaura Lake [9-11].
In addition, investigations of water and nitrogen cycles have also been conducted by many researchers. For example, Burt et al. [12] suggested that atmospheric deposition was important, while Lin [13] investigated the nitrogen cycle of a farm system within a small watershed. Eulenstein [14] investigated leaching of nitrate from water used for agriculture. Brookshire [15] studied the primary conveyors of terrestrial nutrients to rivers, while Borbor-Cordova [16] made a comprehensive study of nitrogen budgets.
Groundwater pollution issues have also recently been very intensively studied. Howden [17] studied nitrate pollution in intensively farmed regions. Hansen [18] investigated groundwater nitrate concentrations and trends in Denmark. Allums [19] examined nitrate concentrations in springs flowing into the lower Flint River Basin, GA, USA. Nagare [20] studied nutrient recovery from biomass cultivated as catch crop, i.e. for removing accumulated fertilizer, and Shao [21] conducted an environmental risk assessment of soil and groundwater contamination.
Many studies on the relationships between groundwater pollution and individual sources of nitrogen pollution are mentioned above. However, integrated approaches including all pollutant components are limited in number. Some long-term risk assessments of groundwater pollution were found [22,23]; these are necessitated by the long residence times associated with water movement in aquifers. Nitrogen balance investigations are also limited in number, despite their importance for the design of effective measures to decrease pollution.
The results of the aforementioned studies could not be applied directly here because water and nitrogen balance issues are strongly dependent upon the characteristics of the site being investigated. The overall goal of this study was to apply a water and nitrogen balance analysis to the Tedori River Alluvial Fan Area, Ishikawa Prefecture, Japan, to clarify both the NPLP over an extended period, and the importance of its source components, to reduce pollutant loads.
The Tedori River alluvial fan area is an important industrial and agricultural region within Ishikawa prefecture that contains many major industries and commercial facilities, as well as an abundance of developed agricultural land, The facilities utilize a lot of groundwater in the area from olden days while the agricultural land, mainly paddy, utilize much surface water from the Tedori River. Therefore, water in the basin is very important for people live in this region.
2. Methods
2.1. The Research Area
2.1.1. Description of the Research Area
The study area comprises a semi-enclosed groundwater basin (Figure 1), and has the characteristics of a typical alluvial fan, formed by the Tedori River. The research
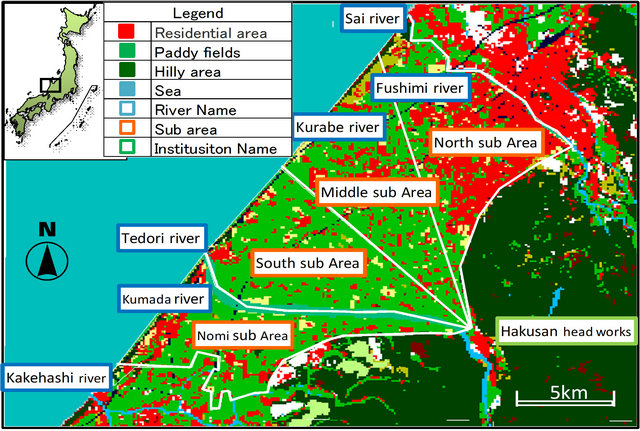
Figure 1. Map of the study area and the sub areas (color).
area is bound by the Sai River on the north-eastern side, the Kakehashi River on the south-western side, mountainous areas on the south-eastern side and the Japan Sea on the north-western side. Both sides of the Tedori River contain developed farmland consisting mostly of rice paddies and both sides of the Sai River and National Route 8, the main highway in the study region, are de veloped residential areas. The total study area contains 17,682 ha of flat land, of which paddies occupy 42.6%, upland fields 2.8%, residential areas 34.2%, road areas 15.0%, and rivers (including canals) 5.3% [24].
The elevation of the top of the fan is about 80 m above sea level and the distance from the top to the end of thefan is 11 km. The mean gradient is 1/140, which is relatively steep. The underground portions of the study area show an excellent aquifer horizon consisting of sand and gravel, with partially contained a clay lens. The region has, therefore, experienced extensive groundwater exploitation.
2.1.2. Small Drainage River in Study Area
Additionally, to confirm the reliability of the nitrogen balance analysis, the nitrogen content of two small rivers in the study area, the Fushimi and Kurahashi Rivers, was analyzed by collecting water quality data after 1993 from the prefectural office. The nitrogen content of the Fushimi River was investigated every month. The river has a 6200-ha catchment area, a predominantly residential area located in the northern part of the study area. The nitrogen content of the Kurabe River was investigated every two months. The river has a catchment area of 1700 ha and is representative of land use in the central part of the study area.
2.2. Water Balance Analysis
Prior to nitrogen balance analysis, water balance analysis was conducted with the aim of clarifying the interrelationships among the various hydrologic components and estimating values for non-observed components for nitrogen balance analysis.
2.2.1. Water Balance Model
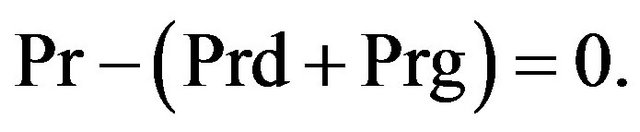
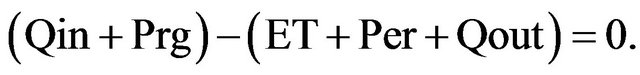
A two-horizon water balance model was applied in the study area to simulate the exchange of water between the channel/soil and aquifer horizon fractions and the Tedori River (Figure 2). The flow among the various components is represented by Equations (1)-(3) [26].
 In the atmosphere:
 (1)
(1)
In the channel-soil horizon:
 (2)
(2)
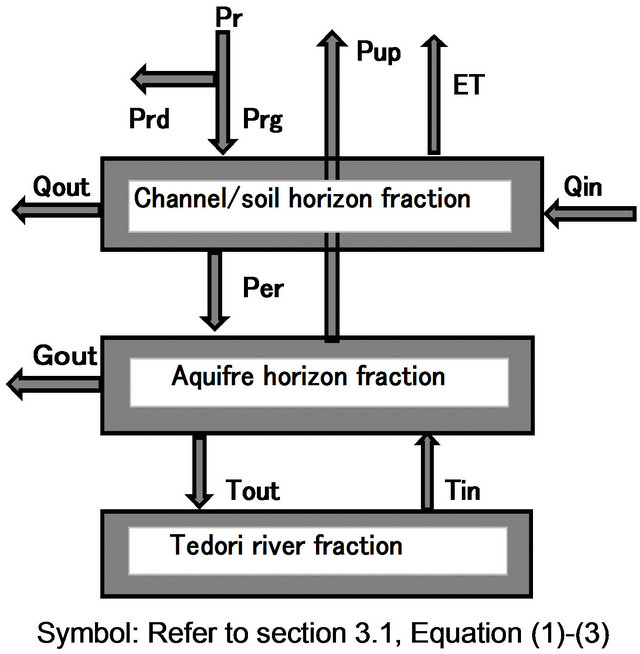
Figure 2. Water balance model and their acronyms in the model [23].
In the aquifer horizon:
 (3)
(3)
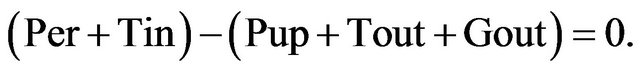
where Pr is precipitation, Prd is direct runoff, Prg is infiltration, Qin is the intake water to the study area from head works (irrigation canal off-take points), ET is evapotranspiration, Per is the percolation from the soil surface, Qout is the outflow discharge from the drainage canal, Pup is pumped water from the aquifer, Tin is recharge water from the Tedori River, Tout is effluent water into the Tedori River, and Gout is discharge from the aquifer to the lower reach of the drainage canal or the Sea of Japan directly.
The water balance model and its components are reported in detail elsewhere [25]; however, a brief summary is provided below.
2.2.2. Elements of the Hydrological Cycle
2.2.2.1. Precipitation and Evapotranspiration (ET)
Precipitation rain data, measured by tipping type automatic gauge, used in this study covered 35 years (1976- 2010) and were collected at the Kanazawa Local Meteorological Observation Station (hereafter Kanazawa), which is located about 10 km from the center of the study area. The mean annual precipitation for the region over the 35 year study duration was 2425 mm, 877 mm of which fell during the irrigation period (13 April to 10 September) and the remaining 1548 mm fell outside of the irrigation period (non-irrigation period). The precipitation in the non-irrigation period includes snowfall. Daily evapotranspiration (ET) over the same period was estimated by the Penman equation using data for Kanazawa. However, the ET of roads (15.0%) and roofs of houses (about 11.5%) was assumed to be zero; thus, only 73.5% of the total ET calculated by the penman equation was applied to the entire study area.
2.2.2.2. Water Use and Percolation Water use (water requirement), investigated by paddy lot, for rice paddies is a very important factor in the analysis because this differs markedly before and after farm land consolidation. Consolidation resulted in soil compaction caused by heavy machinery, with consequent reduction in soil permeability.
Farm land consolidation took place over thirty years between 1965 and 1995 (Figure 3), after which, Murashima [27] investigated water use in 25 test lots of paddy fields in Shichika and 12 test lots in the Miyatake irrigation district. The average water use was 15.6 mm∙day−1 (standard deviation = 5.5 mm∙day−1) over the irrigation period. Prior to farm land consolidation, the average use in 16 paddies during July 1950 was 28 mm∙day−1 [28]. During the land development works water use was assumed to be between 15.6 mm∙day−1 and 28.0 mm∙day−1 in proportion to the areas of developed and undeveloped land, respectively.
The mean percolation in paddies during the irrigation period was estimated as the water use minus Penman evapotranspiration; the evapotranspiration coefficient was assumed to be 0.85. The percolation rate used for the entire study area (17,682 ha) was based on that for the cropped rice area.
Percolation water from irrigation is assumed to travel directly to the aquifer, because the study area has a deep groundwater level and a gravel and sand horizon beneath the topsoil.
2.2.2.3 Discharge in the Tedori River The amount of inflow to, or discharge from, the Tedori River is a very important water balance component. Therefore, we conducted a survey of discharge in several sections of the Tedori River during the irrigation and non-irrigation periods and calculated the difference in discharge between the two sections. Discharge clearly declined in the river stretch between 2.2 and 16.4 km
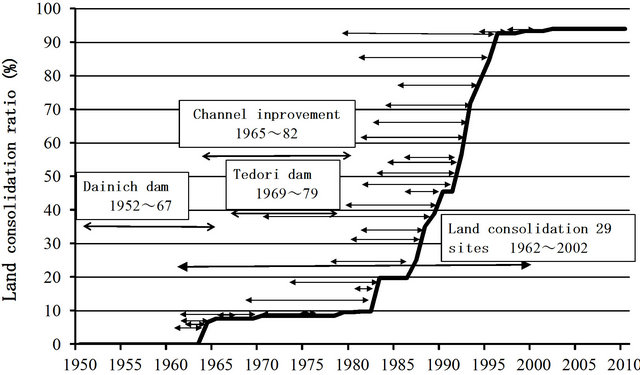
Figure 3. Temporal change of farm land consolidation works in the study area [26].
from the river mouth, indicating that water from the river was recharging the aquifer underlying the area. The discharge between 1.1 and 2.2 km from the river mouth increased slightly, reflecting the inflow of effluent from the area into the river.
2.2.2.4. Pumping Groundwater from Wells Ishikawa Prefecture has reported on the amount of groundwater pumped, investigated by pump capacity multing operation time, from wells in the area [29]. We sorted these data to correspond with irrigation and non-irrigation periods.
2.2.2.5. Intake Water for Paddy Irrigation To assess paddy intake water quantities, we used observed data surveyed at the top of the Shichika irrigation canal from 1976 to 2010. No observations were available for the Miyatake District, thus paddy intake water was estimated based on water right discharges between two the Districts. Five yearly averages observed intake water quantities are shown in Figure 4.
2.2.2.6. Estimation of Direct Runoff and Infiltration from the Ground Surface To estimate percolation and direct runoff, runoff analysis was conducted, using a ratio of precipitation volume to direct runoff for various land uses (Figure 5) [30].
Land use areas were determined from statistical data for Ishikawa Prefecture. Direct runoff from rotational use of upland paddy areas was estimated using of those runoff ratio. Direct runoff from the paddy areas during the irrigation period was estimated using the runoff ratio for the non-irrigation period. The roof area percentage for residential areas (33.7%) was determined using GIS information in which the runoff ratio was assumed to be 100% [31].
Based on the above procedure, the amount of direct runoff and percolation from the ground surface for various land uses was estimated using daily precipitation and ET over 35 years divided into five-yearly intervals (1976- 2010).
2.3. Nitrogen Balance Analysis
2.3.1. Nitrogen, Sources, Content and Loads
Based on the water balance analysis, the nitrogen pollution load potential (NPLP) was estimated principally from the product of water flow volume and nitrogen concentrations (hereafter total nitrogen, TN). The nitrogen balance model was constructed from the water balance components adding nitrogen loads from farmland, effluxent from WWTWs and denitrification in paddies (Figure 6). Nitrogen concentration data were investigated over three years (2007-2009) from surface and groundwater.
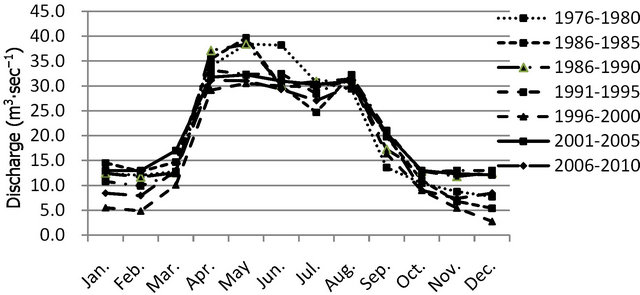
Figure 4. Monthly change of intake (irrigation) water in the study area.

Figure 5. Relationship between precipitation and runoff ratio for different land uses [26].
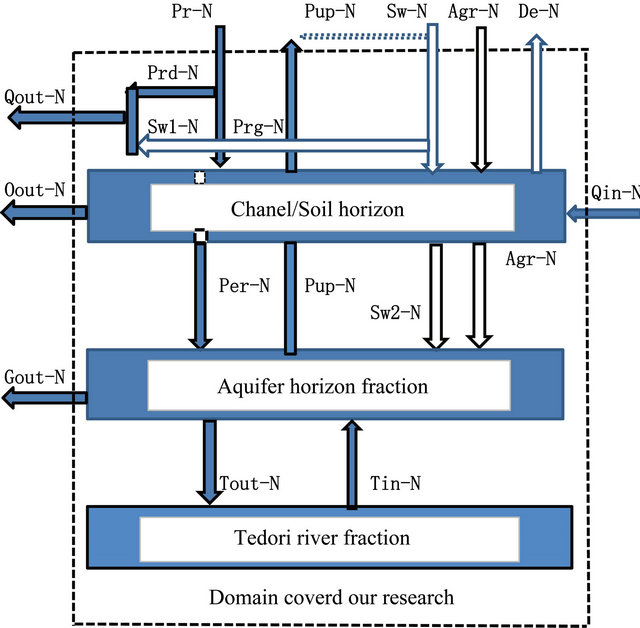
Figure 6. Nitrogen balance model and their symbols in the model [23].
2.3.2. NPLP from Wet and Dry Atmospheric Deposition
Nitrogen deposited by precipitation was monitored at weekly intervals over an extended period by the Ishikawa Environment and Health Research Institute [32], located 10 km from the study area. In addition to wet deposition from precipitation, there is dry deposition of nitrogen from the atmosphere. Atmospheric deposition showed remarkable seasonal changes with high deposition during winter and low deposition during the summer season. This was due to the influence of seasonal winds from Siberia.
2.3.3. NPLP from Intake (Irrigation) Water
The observed volume of intake water (the water extracted from the river into irrigation canals, investigated H~Q curve) is shown in Figure 4 and the nitrogen concentration was observed at the Hirose sampling site near the Hakusan Head works. The NPLP in intake water is shown in Figure 7. The nitrogen concentration of intake water was low during the irrigation period and high during the non-irrigation period because of rainfall deposition [30,31].
2.3.4. NPLP from Percolation Water
The nitrogen concentration of percolation water, equals to surface water, was measured at 53 surface locations four times during the irrigation period and three times during the non-irrigation period [35]. The average concentration was 0.39 mg∙l−1 and 0.57 mg∙l−1 during the irrigation and non-irrigation periods, respectively.
2.3.5. NPLP from the Tedori River
The nitrogen concentration of recharge water from the river was calculated according to the observed data; 0.36 mg∙l−1 during irrigation and 0.48 mg∙l−1 during the nonirrigation period in the upand mid-stream portions of the river. The effluent (river outflow) water concentration was determined to be 1.18 mg∙l−1 and 1.11 mg∙l−1 during the irrigation and non-irrigation periods, respectively [35].
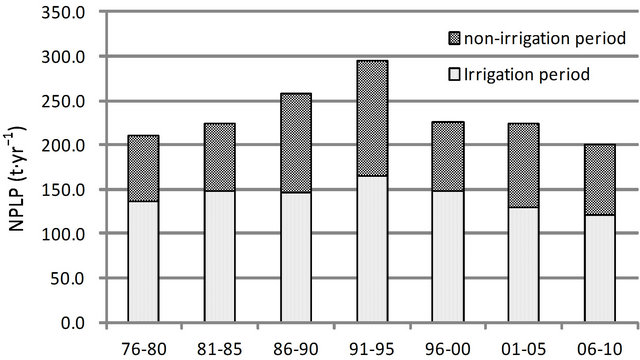
Figure 7. Yearly change of NPLP in intake water [33,34].
2.3.6. NPLP by Pumping of Water
The nitrogen concentration of the pumped (aquifer) water was assumed to be the average nitrogen concentration of the groundwater observed from 53 points across in the entire study area [35]. The concentration was not markedly different between the irrigation and non-irrigation periods.
2.3.7. NPLP of Surface Drainage Discharge
The NPLP in surface drainage water was based on measured nitrogen concentrations and estimated surface drainage flows. The concentration was measured near the Sea of Japan, four times at 5 - 6 sites during the irrigation period (n = 22, σ = 0.19), and four times at 6 - 8 sites during the non-irrigation period (N = 28, σ = 0.17) [35]. The nitrogen concentration was measured by appliance for continuous micro flow (OVATTRO 2ch-TNTR mulch).
2.3.8. NPLP of Groundwater Discharge
Similarly, the NPLP in groundwater discharge was estimated from measured nitrogen concentrations and estimated groundwater discharge. The nitrogen concentration was investigated at 63 locations during the irrigation period (σ = 0.60) and at 55 locations (σ = 0.70) during the non-irrigation periods [35].
3. Result of Water and Nitrogen Balance Analysis
In this section, we explain how the water and nitrogen balance analysis of each individual component of the entire system was performed.
3.1. Water Balance
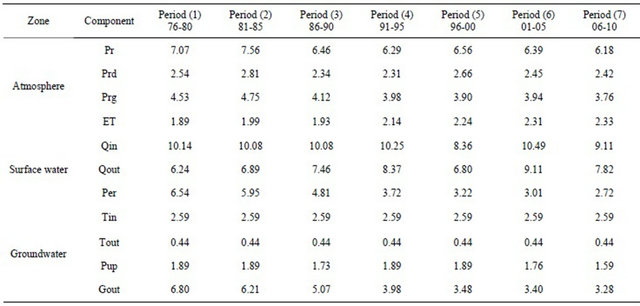
Water balance analysis was conducted as outlined above [36]. Table 1 shows the temporal change of water balance components in which the acronyms are defined in Equations (1)-(3).
In the table, Qout was estimated by the imbalance of channel/soil horizon in Equation (2) 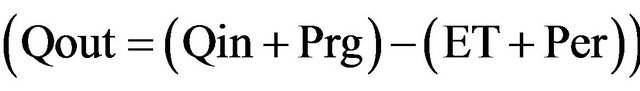 and Gout in Equation (3) was also estimated by the imbalance of aquifer horizon
 .
.
In the atmosphere zone, Pr, Prd and Prg were relatively constant. In the surface water zone, Qin was relatively constant except in period 5. Per showed a remarkable decrease because of the decrease in water demand caused by land development, in response to which Qout also gradually increased. In the groundwater zone, Tin and Tout were assumed constant throughout study period due to the lack of observational data and Pup was shown to be a relatively constant. Gout showed a marked decrease consistent with the decrease in Per. These results have a significant influence on the following nitrogen balance analysis.
3.2. Nitrogen Balance
3.2.1. NPLP from Farmland
NPLP from farmland was assessed in previous studies [37,38]; NPLP was estimated as the difference in nitrogen between fertilizer application rate and the yields of various crops. The fertilizer input was determined from standard application rates for various crops, as recommended by the local government office in the study area. The cultivated crops were rice, soybean, barley, vegeta-
Table 1. Temporal change of water balance components in every five years over 35 years (mm∙day−1).
bles, and orchard fruits. The nitrogen content in the unit yields for crops was determined from standard tables of food composition. The yield of crops was determined from statistical data collected by the prefectural govern ment for crops every five years. NPLP shows remarkable temporal changes (Figure 8).
The peak of NPLP occurred in 1990 at around 1000 t∙yr−1, decreasing gradually thereafter to about 400 t∙yr−1 during the period 2005-2010. The largest NPLP source was rice cultivation, because of the large total cropping area. The second was horticultural crops; vegetables and orchards, due to heavy fertilizer per unit area application rates.
3.2.2. NPLP from WWTWs
Nitrogen in effluent from WWTWs is a very important factor for NPLP, and existing estimates were available for the study [41]. In the study area WWTWs only provide secondary stage treatment, which does not remove nitrogen (whereas tertiary treatment removes nitrogen completely); consequently, large quantities of nitrogen flow into the environment.
NPLP from WWTW was estimated from population equivalent nitrogen loads for various WWTWs; These were 4.8 g∙person−1∙d−1 for activated sludge, 1.6 g∙person−1∙d−1 for the oxidation ditch method (a kind of public sewage treatment), 6.1 g∙person−1∙d−1 for the rural sewage method, 6.5 g∙person−1∙d−1 for combined septic tanks, and 7.6 g∙person−1∙d−1 for night soil septic tanks [42]. Data from the Prefectural Government show how both the number and types of WWTWs gradually changed with time.
The peak WWTW NPLP was about 800 t∙yr−1 in 1994 (Figure 9) [42]. With the application of public WWTWs, which discharge directly into the Japan Sea, the NPLP within the study area had gradually decreased from approx. 600 t∙yr−1 in 1984 to approx. 100 t∙yr−1 in 2010.
3.2.3. NPLP from the Other Components
The nitrogen balance analysis results for the irrigation period and non-irrigation periods are presented in Tables 2 and 3 respectively; the NPLP was obtained from the product of the volume of each component and its nitrogen concentration (acronyms refer to Table 1).
Tables 4 shows the input and Table 5 shows output of the NPLP which obtain by adding irrigation and nonirrigation periods (Tables 2 and 3). In the two tables, the first term of the acronyms indicate the water balance components and second term shows nitrogen.
The difference between the input and output is the pollution amount, i.e. the mass of pollutant stored in each horizon. In addition, denitrification (De-N) from planted paddy was estimated as 17.1 kg∙ha−1 from the test paddy [24] (Table 5).
The total input of nitrogen peaked 2155 t∙yr−1 at period
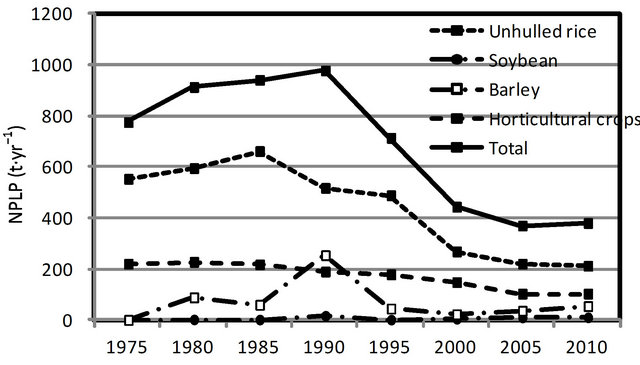
Figure 8. Temporal change of NPLP for various crops from farmland [39,40].
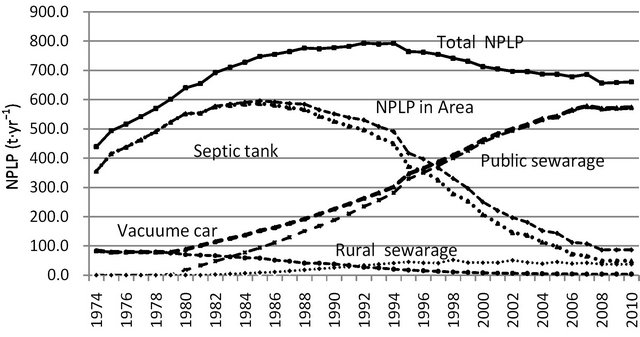
Figure 9. Temporal change of NPLP from various WWTWs [41,43].
(3), after which rapidly decreased 1035 t∙yr−1 at period (7). The dominant input components were Agr-N and SwN mentioned detail in following section. The other components keep relatively constant (Table 4).
The total output of nitrogen peaked 1141 t∙yr−1 at period (1) after which rapidly decreased. The dominant decreased component is Gout-N, while Qout-N is gradually increased. The De-N gradually decreased because of paddy area decreasing. The other components maintained relatively constant (Table 5).
The difference of input and output, index of pollution of the study area peaked 1129 t∙yr−1 at period (3), after which markedly decreases 174 t∙yr−1 at period (7). The main reason of the phenomena was remarkable decreasing of Sw-N and Agr-N in the input component.
4. Discussion
In this section, we discuss nitrogen balance analysis in the aquifer horizon for all components, including the NPLP of farmland and WWTWs presented in the former section, and whether these indicate pollution of the aquifer.
One objective of our research was to determine the extent of groundwater pollution. Figure 10 shows the change of input components for the nitrogen balance in the aquifer horizon. The total NPLP peaked in the period
Table 2. Calculation process in irrigation period from water balance analysis and nitrogen concentration.
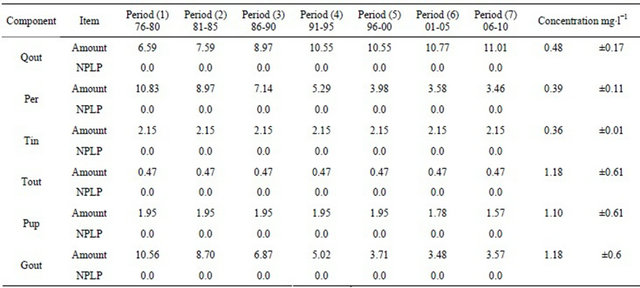
Unit: Amount (mm∙day−1), NPLP (t∙yr−1).
Table 3. Calculation process in non-irrigation period from water balance analysis and nitrogen concentration.
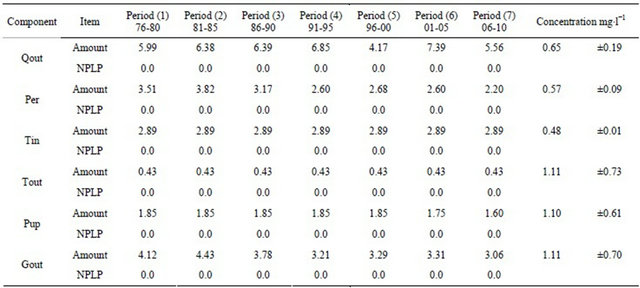
Unit: Amount (mm∙day−1), NPLP (t∙yr−1).
Table 4. Temporal change of input components from Tables 2, 3, Figures 8 and 9 (t∙yr−1).
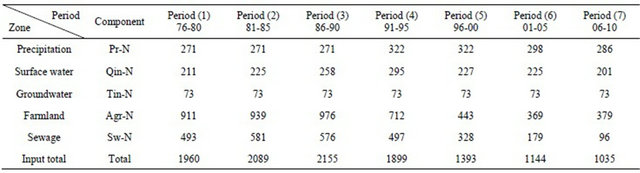
Table 5. Temporal change of output components from Tables 2, 3, Figures 8 and 9 (t∙yr−1).
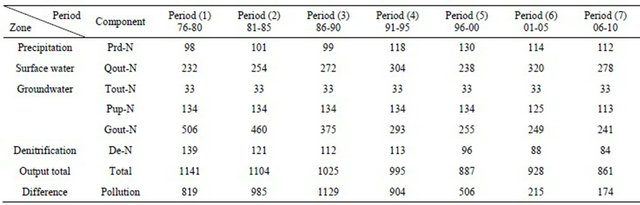
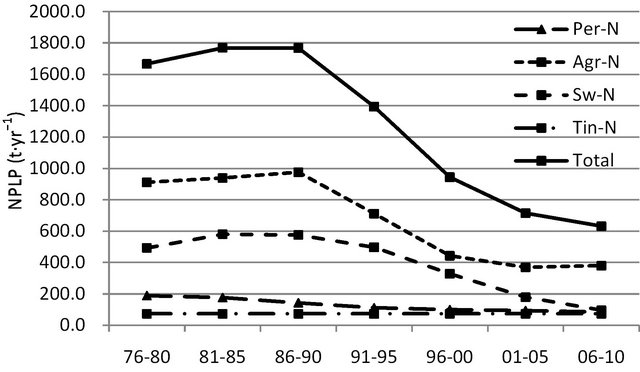
Figure 10. Temporal change of NPLP input in the aquifer horizon with time.
1981-1990 at 1800 t∙yr−1. After that it rapidly decreased to about 600 t∙yr−1 in the period 2006-2010. The largest component was NPLP from farmland at 1000 t∙yr−1 in the period 1976-1990, after which NPLP decreased markedly to about 400 t∙yr−1. The second largest component was effluent from WWTWs (600 t∙yr−1 in the period 1986- 1990), which decreased significantly to about 100 t∙yr−1 in the period 2006-2010. The other items contributed around 100 - 200 t∙yr−1. Therefore, to further reduce Npollution in the study area, NPLP from farmland and WWTW effluents would have the highest priority for reduction, despite their significant decreases in recent times.
The changes in output components are shown in Figure 11. The total output peaked between 1976 and 1980 ataround 700 t∙yr−1, gradually decreasing to about 400 t∙yr−1 by 2006-2010. The largest output was groundwater discharge (Gout-N) which also decreased relatively rapid. The other components were relatively stable.
The difference between input and output, the nitrogen pollution load of the aquifer horizon, is shown in Figure 12 including input and output components. The NPLP peaked in the period 1986-1990 at about 1200 t∙yr−1, gradually decreasing to about 200 t∙yr−1 in the period 2006-2010.
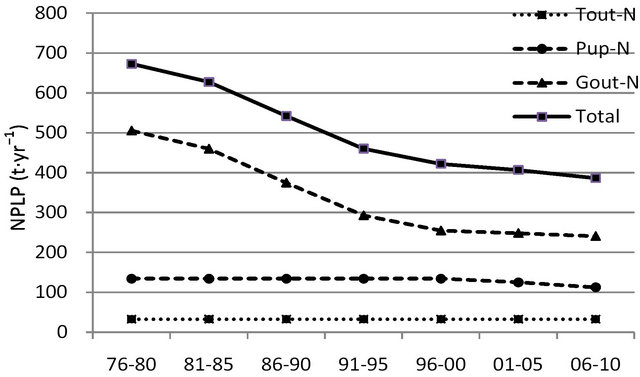
Figure 11. Temporal change of NPLP output in the aquifer horizon with time.
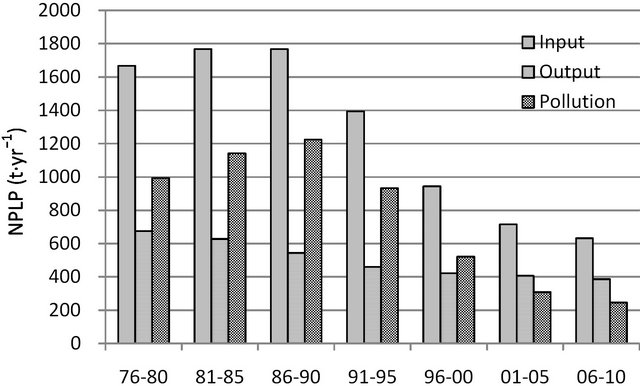
Figure 12. Temporal change of the pollution NPLP in the aquifer horizon with input and output components.
The remaining issue is the accuracy of the groundwater discharge (Gout), which was estimated during the water balance analysis. Further investigation into the accuracy of Gout is necessary in future research.
4.1. Comparison between the NPLP and Nitrogen Concentration of the Small Rivers
Figure 13 shows the nitrogen concentration of the Fushimi River located in the northwest of the study area. The peak of nitrogen concentration was between 1996
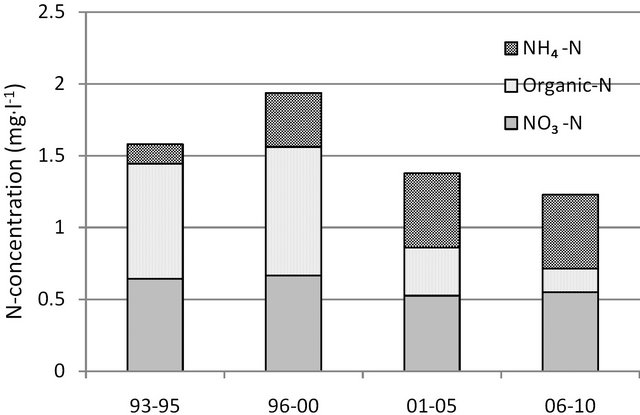
Figure 13. Temporal change in nitrogen concentration in the Fushimi River.
and 2000 at around 2.0 mg∙l−1, gradually decreasing to about 1.2 mg∙l−1 reflecting the NPLP decline in the aquifer horizon.
N-concentration in the period 1993-1995 was fewer than in 1996-2000 is probably because the residential area had not yet been developed.
Figure 14 shows the nitrogen concentration of the Kurabe River which drains farmland in the study area. The peak in nitrogen concentration of about 1.45 mg∙l−1 was between 1993 and 1995, gradually decreasing to around 1.00 mg∙l−1. The temporal change in nitrogen concentration is similar to that in the Fushimi River, and reflects the decline in groundwater pollution estimated by the nitrogen balance analysis for the aquifer horizon (Figure 12).
The nitrogen concentration was low around the Tedori River and high in the northern part of the study area around the Fushimi river. We theorize that this is because of the recharge from the Tedori River and the sewage treatment water originating from predominantly unconnected public sewage facilities.
If we divide these into ground or surface water, the accuracy of the data may improve. We surmise that the discharge of the small river during low flow periods will consist mainly of groundwater discharge (Gout). This is because the river nitrogen concentration at low flow is quiet similar to the groundwater concentration, while the discharge during higher river flows and from irrigation canals near the Japan Sea are likely to consist mainly of surface water discharge (Qout).
Sw-N assumed to be percolate into aquifer directly, but a part of it flow out into canal. If we can estimate the dividing ratio of Sw1-N and Sw2-N in Figure 6, Sw-N can be estimate more accurately.
4.2. Comparison of Nitrogen Concentration in the Test Wells
We set up two test wells on our campus to depths of 150 and 50 m. The nitrogen concentration at 150 m was 1.0
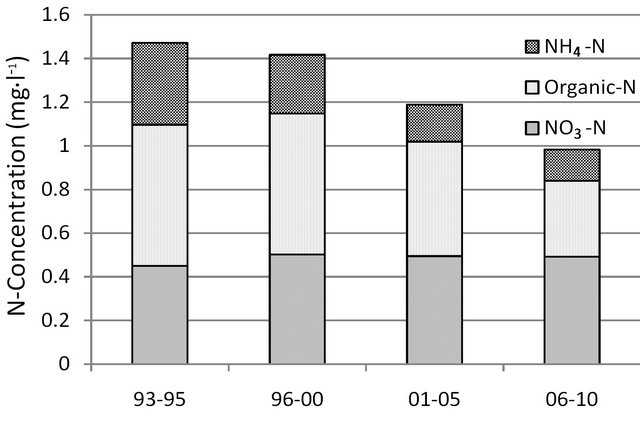
Figure 14. Temporal change in nitrogen concentration in the Kurabe River.
mg∙l−1 while at 50 m the concentration was about 0.25 mg∙l−1 in recent years. This fact demonstrates that the N-polluted water has gradually seeped into the deeper zone. In addition, the water collected from the deeper well shows that the age of the contributing rainfall was greater than 60 years as indicated by radioactive tritium analysis.
5. Conclusions
The purpose of this research was to evaluate long-term nitrogen pollution potential (NPLP) in the Tedori River Alluvial Fan area. First, to conduct the water and nitrogen balance analysis, a two layer model was applied consisting of a soil/channel horizon and an aquifer horizon with exchange of water with the river. Second, water balance analysis was conducted over 35 years at five year intervals, to demonstrate the temporal change of NPLP and to evaluate all of the relevant components, including those without measurements. Finally, the actual nitrogen balance analysis was conducted. In addition to the above analysis, NPLP estimates for farmland and sewage treatment from existing studies were taken into consideration.
The overall results, from the perspective of inputs and outputs of nitrogen to and from the aquifer horizon were as follows: 1) In the aquifer horizon, the total NPLP peaked in the period 1981-1990 at 1800 t∙yr−1, thereafter decreasing rapidly to about 600 t∙yr−1 in the period 2006- 2010. The largest component was NPLP from farmland at 1000 t∙yr−1 in the period 1976-1990, after which the NPLP decreased markedly to about 400 t∙yr−1. The second largest component was WWTW effluent (600 t∙yr−1 in the period 1986-1990), which decreased to about 100 t∙yr−1 by 2006-2010; 2) The difference of input and output, used as an index of groundwater pollution, had a peak of about 1200 t∙yr−1 between 1986 and 1990, gradually decreasing to about 200 t∙yr−1 by 2006-2010; 3) The temporal changes in NPLP coincide with the nitrogen concentrations of the rivers in the study area. The nitrogen concentrations of test wells at depths of 150 and 50 m suggest that nitrogen pollution is gradually percolating deeper into the aquifer.
6. Acknowledgements
We sincerely thank Ishikawa Prefecture for providing valuable data. We also thank the researchers conducting the study entitled “Normal hydrologic cycle as a core of irrigation water in the Tedori River basin” at Ishikawa Prefectural University, supported by the Ministry of Agriculture, Forests and Fishery, for many valuable comments.
REFERENCES
- T. J. Chestnut, D. J. Zarin, W. H. McDowell and M. Keller, “A Nitrogen Budget for Late-Successional Hillslopetabonuco Forest,” Puerto Rico, 2005, p. 46.
- V. Tsioumas, V. Zorapas, E. Pavlidou, I. Lappas and K. Voudouris, “Groundwater Contamination by Nitrates and Seawater Intrusion in Atlanta Basin (Fthiotida, Greece),” Environmental Earth Sciences, 2011.
- R. K. Shrestha, L. R. Cooperband and A. E. Mac Guidwin, “Strategies to Reduce Nitrate Leaching into Groundwater in Potato Grown in Sandy Soils: Case Study from North Central USA,” American Journal of Potato Research, Vol. 87, No. 3, 2010, pp. 229-244.
- Z. Q. Xiong, J. R. Freney, A. R. Mosier, Z. L. Zhu, Y. Lee and K. Yagi, “Impacts of Population Growth, Hanging Food Preferences and Agricultural Practices on the Nitrogen Cycle in East Asia,” Nutrient Cycling in Agro Ecosystems, Vol. 80, No. 2, 2007.
- M. X. Wang, G. D. Liu, W. L. Wu, Y. H. Bao and W. N. Liu, “Prediction of Agriculture Derived Groundwater Nitrate Distribution in North China Plain with GIS-Based BPNN,” Environmental Geology, Vol. 50, No. 5, 2006.
- L. Liang, T. Nagumo and R. Hatano, “Nitrogen Cycling with Respect to Environmental Load in Farm Systems in Southwest China,” Nutrient Cycling in Agro Ecosystems, 2005, p. 73.
- T. Nishikiori, T. Takamatsu, A. Kohzu, Y. Nakajima and M. Watanabe, “Distribution of Nitrate in Groundwater Affected by the Presence of an Aquitard at an Agricultural Area in Chiba, Japan,” Environmental Earth Science, 2012, pp. 307-310.
- G. M. Lovett and C. L. Goodale, “A New Conceptual Model of Nitrogen Saturation Based on Experimental Nitrogen Addition to an Oak Forest,” Ecosystems, Vol.14, No. 4, 2011.
- T. Kitamura, H. Kuroda, M. Yamamoto, M. Negishi and T. Tabuchi, “Water and Mass Balance in Paddy Field Area with a Cycle Irrigation System Situated Along Kasumigaura,” Japan Society Irrigation and Drainage Engineering, Vol. 269, 2010, pp. 35-41.
- H. Kubota, T. Tabuchi, Y. Takamura and S. Suzuki, “Water and Mass Balance (N, P) in Paddy Field Along Lake Trans,” JSIDRE, Vol. 84, 1979, pp. 22-28.
- T. Kubota and H. Kobayashi, “A Simulation of Nitrogen Flow and Runoff Model for Rural Area Based on Spatial Distribution Pattern of Cropping Types,” The Association of Rural Planning, 2000, pp. 229-235.
- T. P. Burt, T. P. Howden, F. Warrall, M. J. Whelan and M. Bieroza, “Nitrogen in United Kingdom Rivers; Policy and Its Outcomes since 1970,” Environmental Science & Technology, Vol. 4, No. 1, 2010, pp. 175-181.
- S. Lin, “Characteristics of Nitrogen Cycling in Farm Systems in a Small Watershed of Three Gorges Reservoir Area,” China Environmental Science, Vol. 31, No. 3, 2010, pp. 632-638.
- F. Eulenstein, “Model Based Scenario to Optimize the Regional Nitrogen Balance and Reduce Leaching of Nitrate an Surface of an Agriculturally Used Water Catchment,” Nutrient Cycling in Agro Ecosystems, Vol. 8, No. 1, 2008, pp. 33-49.
- E. N. Brookshire, “Maintenance of Terrestrial Nutrient Loss Signatures during In-Stream Transport,” Ecology, Washington DC, 2009.
- M. J. Borbor-Cordova, E. W. Boyer, W. H. McDowell and C. A. Hall, “Nitrogen and Phosphorus Budget for a Tropical Watershed Impacted by Agricultural Land Use, Guayas, Ecuador,” Biogeochemistry, Vol. 79, 2006, pp. 135-161.
- N. J. K. Howden, T. P. Burt, F. Worrall, S. Mathias and M. J. Whelan, “Nitrate Pollution in Intensively Farmed Regions: What Are the Prospects for Sustaining HighQuality Groundwater?” Water Resources Research, Vol. 47, No. 11, 2011, Article ID: W00L02.
- B. Hansen, T. Dalgaard, L. Thorling, B. Sorensen and M. Erlandsen, “Regional Analysis of Groundwater Nitrate Concentrations and Trends in Denmark in Regard to Agricultural Influence,” Biogeosciences, Vol. 9, No. 8, 2012, pp. 3277-3286.
- S. E. Allums, S. P. Opsahl, S. W. Golladay, D. W. Hicks and L. M. Conner, “Nitrate Concentrations in Springs Flowing into the Lower Flint River Basin, Georgia USA,” Journal of the American Water Resources Association, Vol. 48, No. 3, 2012, pp 423-438.
- H. Nagare, T. Fujiwara, T. Inoue, S. Akao, K. Inoue, M. Maeda, S. Yamane, M. Takaoka, K. Oshita and X. Sun, “Nutrient Recovery from Biomass Cultivated as Catch Crop for Removing Accumulated Fertilizer in Farm Soil,” Water Science and Technology, Vol. 66, No. 5, 2012, pp. 1110-1116.
- X. H. Shao, X. Hu, J. Shan, L. X. Liao, J. Y. Tan and C. Kwizera, “Environmental Risk Assessment of Soil and Groundwater Contamination with Bio-Organic Fertilizer Application,” Journal of Food, Agriculture & Environment, Vol. 10, No. 2, 2012, pp. 1209-1212.
- V. Aparicio, J. L. Costa and M. Zamora, “Nitrate Leaching Assessment in a Long-Term Experiment under Supplementary Irrigation in Humid Argentina.”
- A. Gutierrez and N. Baran, “Long-Term Transfer of Diffuse Pollution at Catchment Scale: Respective Roles of Soil, and the Unsaturated and Saturated Zones (Brevilles, France),”
- Hokuriku Regional Agricultural Administration Office, “Annual Report of Agriculture, Forestry and Fishery of Ishikawa Prefecture 2004-2005,” 2006.
- M. Yoshida, T. Maruyama, F. Noto, K. Takase and H. Takimoto, “Analysis of Return Flow of Irrigation at Test Paddy in the Tedori River Alluvial Fan Srea,” Japan Society of Irrigation and Drainage Engineering, 2012, in Press.
- T. Maruyama, M. Yoshida, K. Takase, H. Takimoto and F. Noto, “Assessment of Nitrogen Pollution Load Potential for Groundwater by Mass Balance in the Tedori River Alluvial Fan Areas, Japan,” Sustainable Agriculture Research, Vol. 2, No. 1, 2013, pp. 76-90.
- K. Murashima, “Research on Normal Hydrologic Cycle as a Core of Irrigation,” Annual Report 2008, 2009, pp. 35-38.
- Hokuriku Regional Agricultural Administration Office, “Report on Works of Tedori River Irrigation Project,” Hokuriku Regional Agricultural Administration Office, 1969, p. 36.
- Nanao City, “Investigation Report on Conservation of Groundwater in Ishikawa Prefecture,” Nanao City, 2007, p. 50.
- T. Maruyama, S. Kobayashi and T. Mitsuno, “Evaluation of Groundwater Recharge by Precipitation. Association of Upland Agriculture Promotion of Japan,” Upland Agriculture, Vol. 66, 2011, pp. 2-10.
- Geographical Survey Institute, “Geographic Information System (GIS),” 2010. http://www.gsi.go.jp/kiban/index.html
- Ishikawa Prefecture, “Investigation Report on Environment and Air,” Research Institute of Ishikawa Environment and Health, 2006-2010.
- T. Maruyama, M. Yoshida, K. Takase and H. Takimoto, “Research on Nitrogen Balance in the Mountainous Tedori River Basin of Japan,” Journal of Japan Society of Hydrology and Water, 2012, in Press.
- Ishikawa Water Supply Office, “Annual Report of Water Quality 1976-2010,” Ishikawa Water Supply Office.
- Y. Hayase, “Analysis of Water Quality of Flow, Forest and Paddy Dynamics in the Tedori River,” Study on Normal Hydrologic Cycle as a Core of Irrigation Water Annual Report, 2008, p. 55, 2009, p. 83, 2010, p. 73.
- T. Maruyama, F. Noto, H. Horino, K. Nakamura, K. Murashima, T. Yoshida and H. Takimoto, “Analysis of Water Balance at the Tedori River Alluvial fan Areas in Japan,” Journal of Japan Society of Hydrology and Water Resources, Vol. 2, No. 1, 2012, pp. 20-29.
- T. Maruyama, H. Takimoto, I. Hashimoto, D. Nakade and K. Murashima, “Evaluation of Nitrogen Load Potential from Agricultural Land,” Objective Yield and Standard Fertilizer Usage, Association of Upland Agriculture Promotion of Japan, Vol. 615, 2010, pp. 1-11.
- T. Maruyama, I. Hashimoto, H. Takimoto and D. Nakade, “Assessment of Nitrogen Pollution Loads from Farmland, Japan, by Objective Yield and Standard Fertilizer Uage,” Paddy Water Environ, Vol. 7, 2009, pp. 151-159.
- T. Maruyama, F. Noto, H. Takimoto, K. Nakamura, and T. Onishi, “Assessment of the Long-Term Variation in the Nitrogen Pollution Load Potential from Farmland to Groundwater in the Tedori River Basin,” Paddy Water Environ, Vol. 9, 2011, pp. 441-449.
- T. Maruyama, F. Noto, K. Murashima, I. Hashimoto and K. Kitada, “Analysis of the Nitrogen Pollution Lord Potential from Farmland in the Tedori River Alluvial Fan Areas in Japan,” Paddy Water Environment, Vol. 8, No. 3, 2010, pp. 293-300. doi:10.1007/s10333-010-0202-x
- T. Maruyama, F. Noto, H. Takimoto, K. Nakamura, M. Yoshida, T. Onishi and S. Kawashima, “Assessment from Sewage Treatment Water of Long-Term Changes of Nitrogen Pollution Load Potential in the Tedori River Alluvial Fan Area, Japan,” Paddy Water Environment, Vol. 9, 2011, pp. 451-459.
- T. Maruyama, F. Noto, T. Takahashi, T. Tsuchihara and T. Tanaka, “Analysis of Nitrogen Pollution Load by Dmestic Wste Wter Teatment in the Tedori River Alluvial Fan Areas, Trans,” Japan Society Irrigation and Drainage Engineering, Vol. 269, 2010, pp. 113-119.
- T. Maruyama, F. Noto, T. Takahashi, K. Nakamura and T. Onishi, “Assessment of Environmental Nitrogen Pollution Load Potential from Sewage Treatment Water in the Tedori River Alluvial Fan Area, Japan,” Paddy and Environment, Vol. 9, No. 2, 2011, pp. 267-274. doi:10.1007/s10333-010-0248-9
NOTES
*Corresponding author.