Journal of Water Resource and Protection
Vol.4 No.11(2012), Article ID:24491,12 pages DOI:10.4236/jwarp.2012.411112
Nitrogen Leaching from Saybrook Soil Amended with Biosolid and Polyacrylamide
Department of Biological Systems Engineering, University of Wisconsin, Madison, USA
Email: *mailapalli@wisc.edu
Received August 6, 2012; revised September 14, 2012; accepted October 2, 2012
Keywords: Biosolid; Polyacrylamide; Ammonium; Nitrate; Nitrogen; Leachate
ABSTRACT
In this study, Nitrogen leaching following surface application of biosolid with and without polyacrylamide (PAM) coating was investigated using soil column experiments. Three treatments including bare soil (C), a commercially available biosolid (BS) and PAM coated biosolid (PAM + BS), were applied to manually packed (bulk density: 1.3 g·cm–3) growth chamber soil columns (GC columns: 5 cm diameter by 40 cm long) and greenhouse soil columns (GH columns: 15 cm diameter by 40 cm long). The application rates for BS and PAM + BS were 729 and 740 kg/ha, respectively. The GC columns were incubated for 60 days in a dark chamber at 25˚C and no crop was grown in the columns. The GH columns were incubated for 60 days in a greenhouse and Ryegrass (seed rate: 252 kg/ha) was grown in these columns under 16 h daylight and at about 25˚C. The columns were irrigated weekly using 270 mL DI-water for GC columns and 850 mL for GH columns and leachate was analyzed for Ammonium (NH4-N), Nitrate (NO3-N) and total Nitrogen (TN). The GH column experiments were repeated with three times greater biosolid application rate (2187 kg/ha) while keeping the PAM and Ryegrass seed rate constant. The leachate volume and NH4-N, NO3-N and TN concentration/load were not significantly different among the treatments for the GH columns but were significantly different during the incubation period. The same was true for GC columns with the exception of NO3-N and TN concentration/load which, overall, were higher for the BS and PAM + BS treatments than for the C treatment. In the beginning of the incubation, the leachate from all treatments (GC and GH) contained the highest NH4-N concentrations (>USEPA target level: 0.1 mg/L) and decreased, in some cases rapidly, to near zero. The NO3-N concentrations were highest in the middle of the incubation and greater than the USEPA target level (10 mg/L). The NO3-N concentrations were lower for cropped GH columns compared to GC columns due to NO3-N uptake by plants. The three fold increase in biosolid application rate did not increase NH4-N concentrations in leachate but did increase NO3-N and TN concentrations/loads in leachate on average 2.5 to 2.7 times. The non-significant differences among treatment means for NH4-N, NO3-N and TN concentrations/loads for the GH columns suggest that land application of biosolid (with or without PAM) to cropped silt loam landscapes at the rates considered may be safe within the context of groundwater pollution.
1. Introduction
Biosolids are derived from sewage sludge and their application to agricultural land and lawn gardens is now extensively practiced as it is cheaper than inorganic fertilizers [1] and is a cost-effective method of disposal [2]. Biosolids can provide organic matter, water, nitrogen (N), phosphorus (P), sulfur (S), and micronutrients for crop production at a low or negative cost for the producer, and improve physical condition of the soil [3]. In the US, approximately 3.4 million dry tons of biosolids are land applied annually to farm, forests, range lands, mine lands, and other land use types [4-6]. In recent years, researchers have focused on biofuel crop production using biosolids as a promising supplier of nutrients [7]. However, the need to effectively dispose of biosolids will continue to be a challenge as the world population increases.
In addition to nutrients, biosolids can also contain metals, pathogens and toxic organic compounds and create a nuisance to the environment if they are not properly treated prior to land application. Sludges that are treated to reduce but not eliminate pathogens are called Class B and those that are treated with a goal of pathogen elimination are called Class A [8,9]. Class A biosolids that meet the EPA standards for nine elements (arsenic, cadmium, copper, lead, mercury, molybdenum, nickel, selenium, and zinc) may be distributed without restriction and without labeling as to their origin or pollutant content [8]. However, the EPA has suggested that sewage sludges are low risk as compared to hazardous waste [10]. If the concentration of metals, pathogens, toxic organic compounds in biosolids already meets the international or national standards for agricultural reuse, the application rate may depend mainly on the biosolids N:P content and the crop N:P requirement. A sustainable and acceptable option for the long-term management of biosolids must be environmentally friendly, economically viable, and socially acceptable [11].
Land application of biosolids is generally via injection or surface application with and without incorporation into the soil [9]. Application of biosolids is prohibited for any land use when the ground is frozen [12]. On pasture land and forests, the material tends to be applied to the soil surface, as incorporation is more difficult than on crop land [4]. In agricultural lands, biosolids cakes are often disked into soil [4]. Land application of biosolids can improve agricultural productivity by increasing soil organic matter content and fertility [7,13,14]. Nitrogen mineralization in biosolid treated soils releases  that may serve as either a major plant nutrient or as a substrate for nitrification [15]. Enhanced nitrification increases soil NO3-N, which may then leach and potentially elevate groundwater NO3-N concentrations.
It appears that most biosolids have a small amount of soluble nitrate that is released at initial application and then the slow decay of organic matter releases nitrogen that is quickly scavenged by crops [16,17]. At a monitored biosolids spreading site in Colorado, nitrate in groundwater was found to have no net change; modest increases or decreases in concentrations over time balanced out [18]. In New Hampshire, Estes and Zhao [19] determined that biosolids applied to cropland had a minimal effect on groundwater quality because of the slow nitrogen release. In Pennsylvania, Shober et al. [20] found that long-term biosolids application to cropland increased soil nitrogen, implying that loss of nitrogen by leaching was slight.
Since biosolids are slightly hydrophobic, they can easily be transported in surface runoff and may affect quality of surface water bodies. Mailapalli and Thompson [21] investigated the effect of Polyacrylamide (PAM) coated biosolid on sediment and P-transport under simulated rainfall. They found that the biosolid coated with PAM reduced sediment export by 77% and phosphorus (dissolved reactive phosphorus and total phosphorous) export by 50% to 67% compared to the amount transported from uncoated biosolid; the sediment and phosphorus loads were similar to loads for bare soil (unfertilized) conditions. The PAM coating made the biosolid prills more hydrophilic and heavier, which kept the prills in place on the soil surface, preventing them from being transported in surface flows. Furthermore, PAM generally binds soil particles together and improves soil aggregate stability, which facilitates less transport of soil particles in runoff. However, increased soil aggregate stability can lead to increased infiltration and possibly increased nutrient transport to groundwater. Therefore, it is important to understand the effect of PAM coated biosolid on leachate quality. The objective of this research was to investigate the effect of biosolid and PAM coated biosolid application on Nitrogen (Ammonia-N, Nitrate-N, Nitrite-N and total N) leaching.
2. Materials and Methods
Soil column experiments were conducted in the Walnut Street Greenhouse facility of the University of Wisconsin (UW)—Madison to investigate leachate quality following application of a commercially available biosolid. Two sets of experiments were conducted: 1) Column experiments were conducted in a growth chamber (GC) and a greenhouse (GH) from May 12 to July 12, 2011 and 2) GH column experiments were repeated from Sep 2 to Nov 2, 2011.
2.1. Field Soil
The soil used to pack the columns was obtained from the top layer (0 - 30 cm) of Field #602 at the UW-Arlington Agricultural Research Station (Arlington, WI). The soil was air-dried and passed through a 2 mm sieve. The soil physical and chemical properties were analyzed at the UW Soil Plant Analysis Laboratory (SPAL) and the soil properties are presented in Table 1. Although the soil used for the two rounds of experiments was from the same field, soil properties were slightly different because
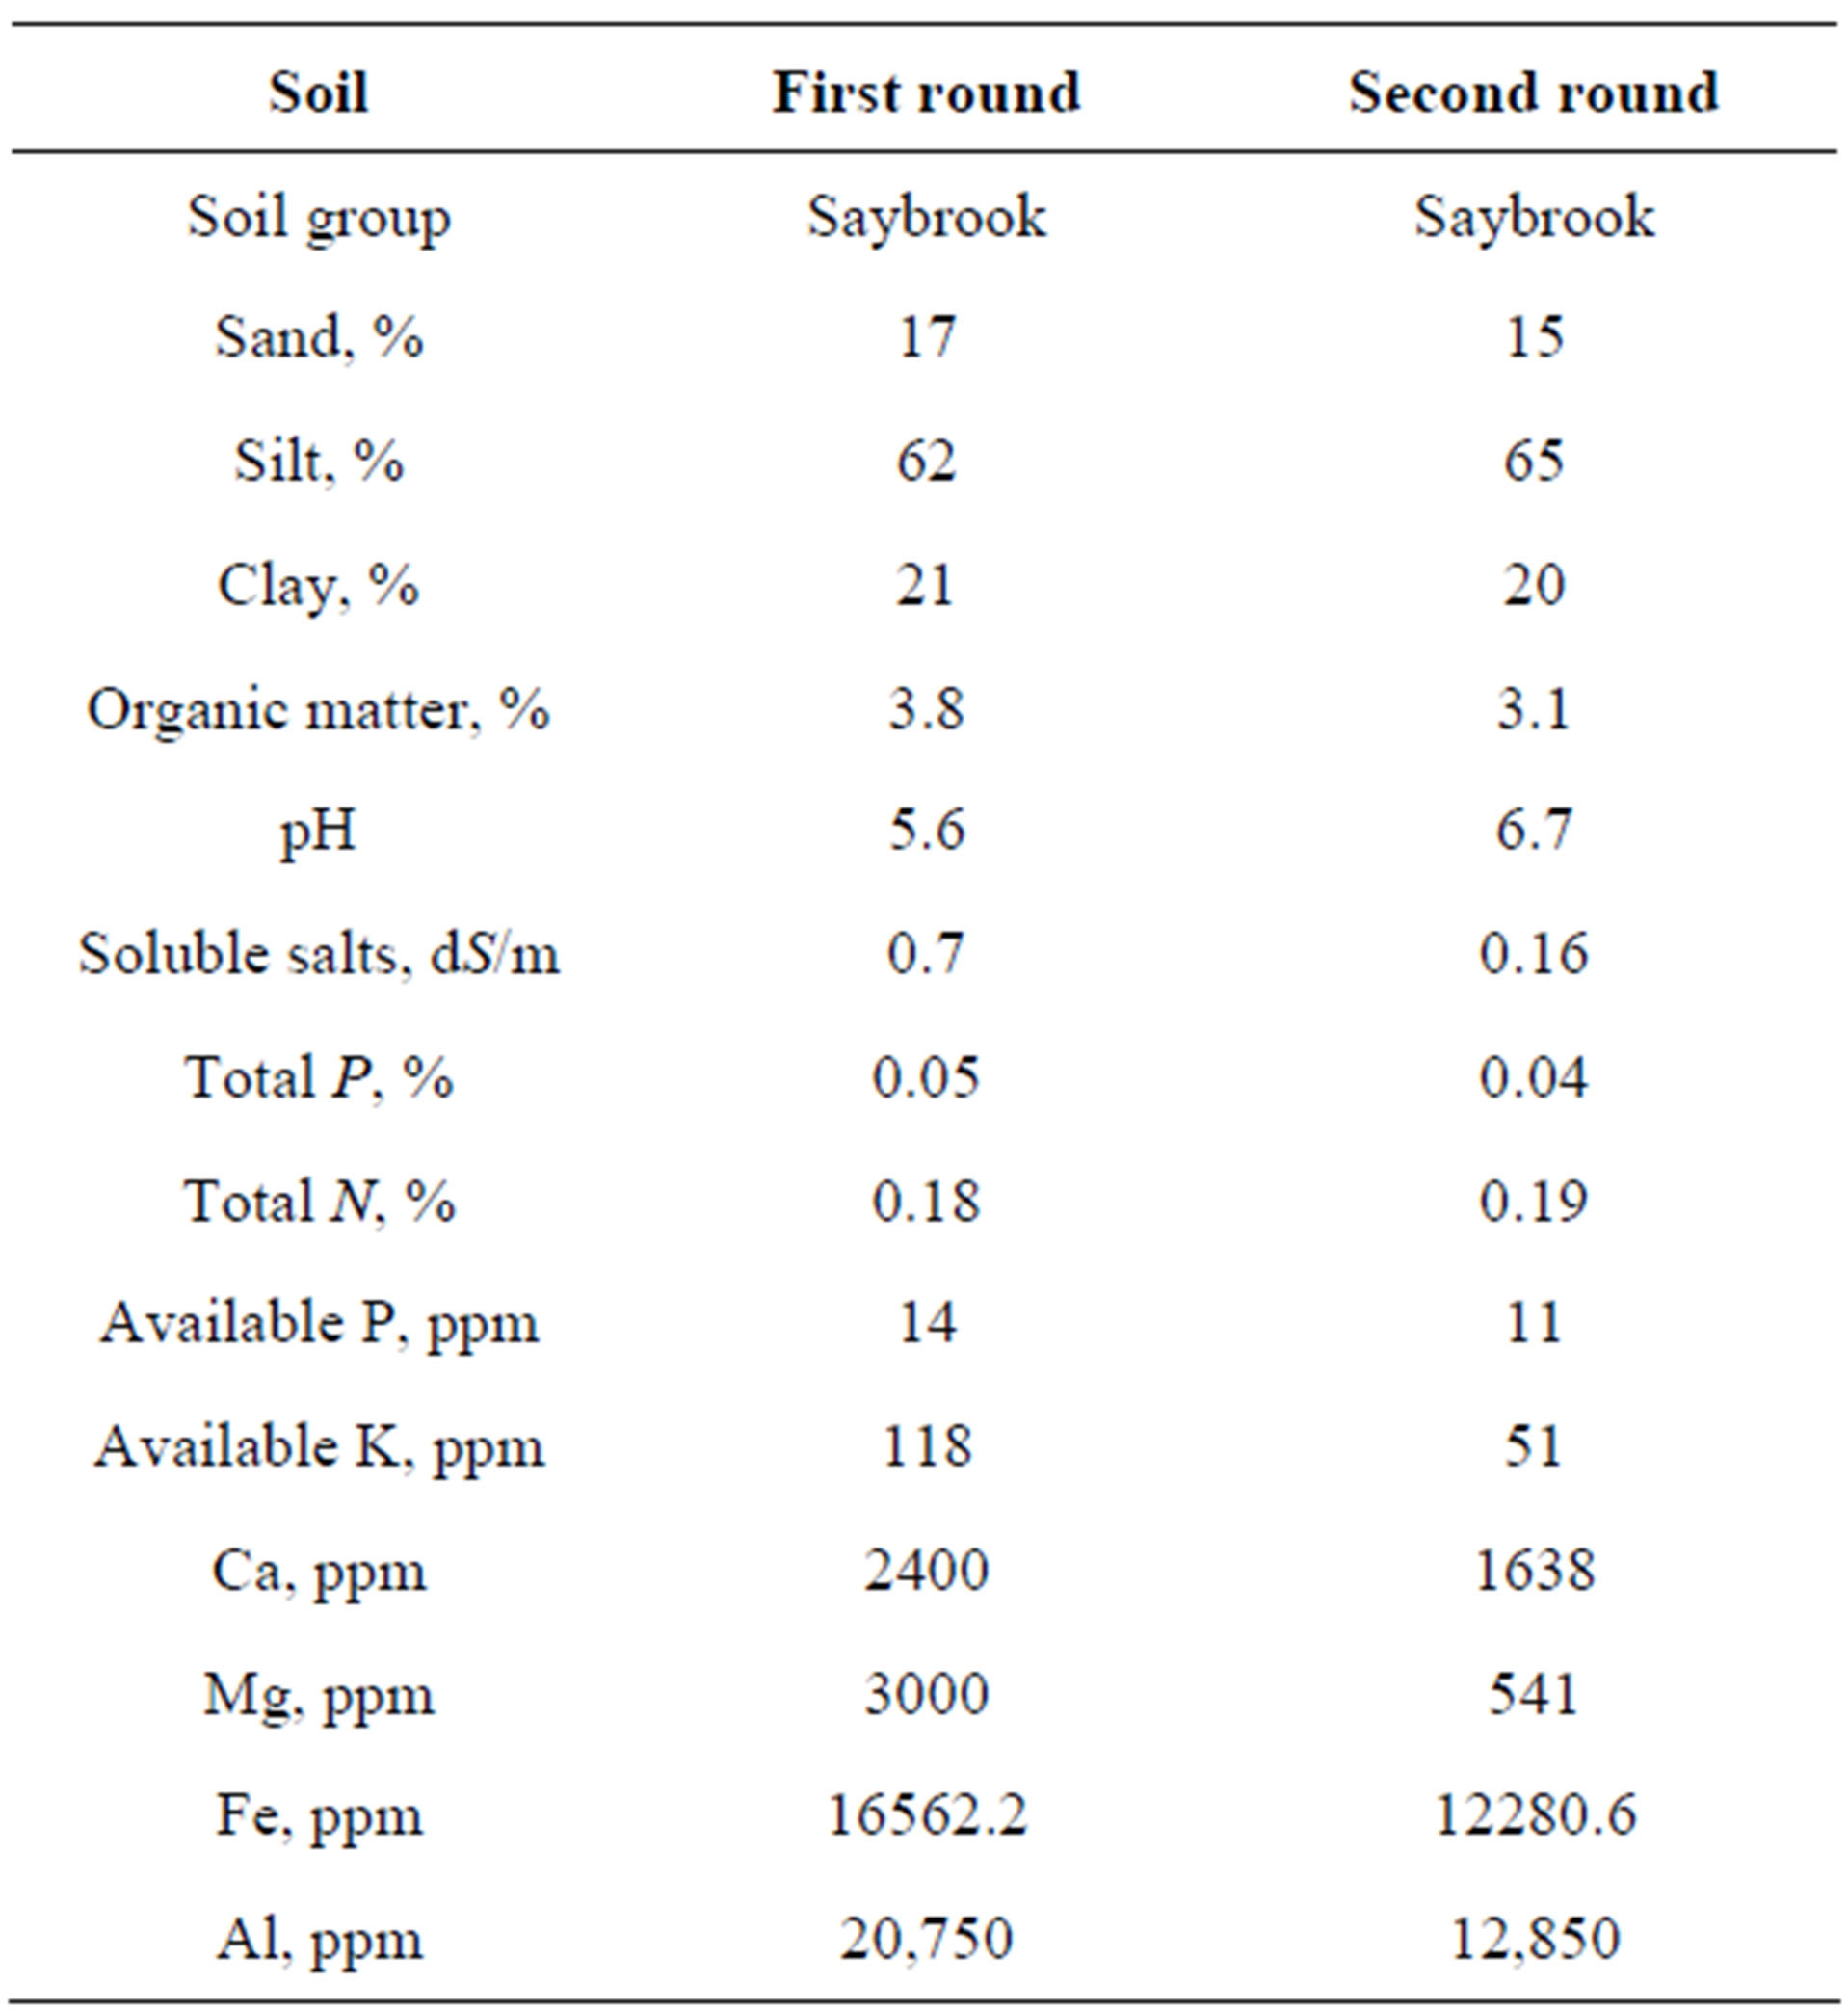
Table 1. Characteristics of the soil used in the experiments.
it was collected from different locations within Field #602.
2.2. Soil Column Design
Acrylic PVC columns of 15-cm and 5-cm diameters were used in the GH and the GC studies, respectively. The length of the column was 40-cm for both GH and GC columns. Figure 1 shows a schematic view of the PVC column. Three layers of cheese cloth were attached to the bottom of each column with a rubber band and tape to prevent soil loss through the bottom. Each column was plugged into a PVC cap with a drain hole in the bottom that allowed leachate to drain into a collection bottle. The GH and GC columns were drained into 250 mL and 100 mL bottles, respectively. The columns were kept on 15.2-cm wood blocks to facilitate free drainage into the collection bottles.
2.3. Packing of Soil Columns
Soil packing was performed to achieve a soil bulk density (BD) of 1.3 g/cm3. Each GH column was initially filled with pea gravel of 950 g up to 3-cm of column height. The pea gravel used in each GC column (5-cm dia.) was 110 g. The mass of field soil (<2 mm) used for GH and GC soil columns was approximately 7843 and 923 g, respectively. The soil for each column was divided into seven lifts and each lift was used to pack 5-cm of column height. Soil was manually packed using a PVC disc with diameter just smaller than the inner diameter of the column. The top 2-cm of each column was
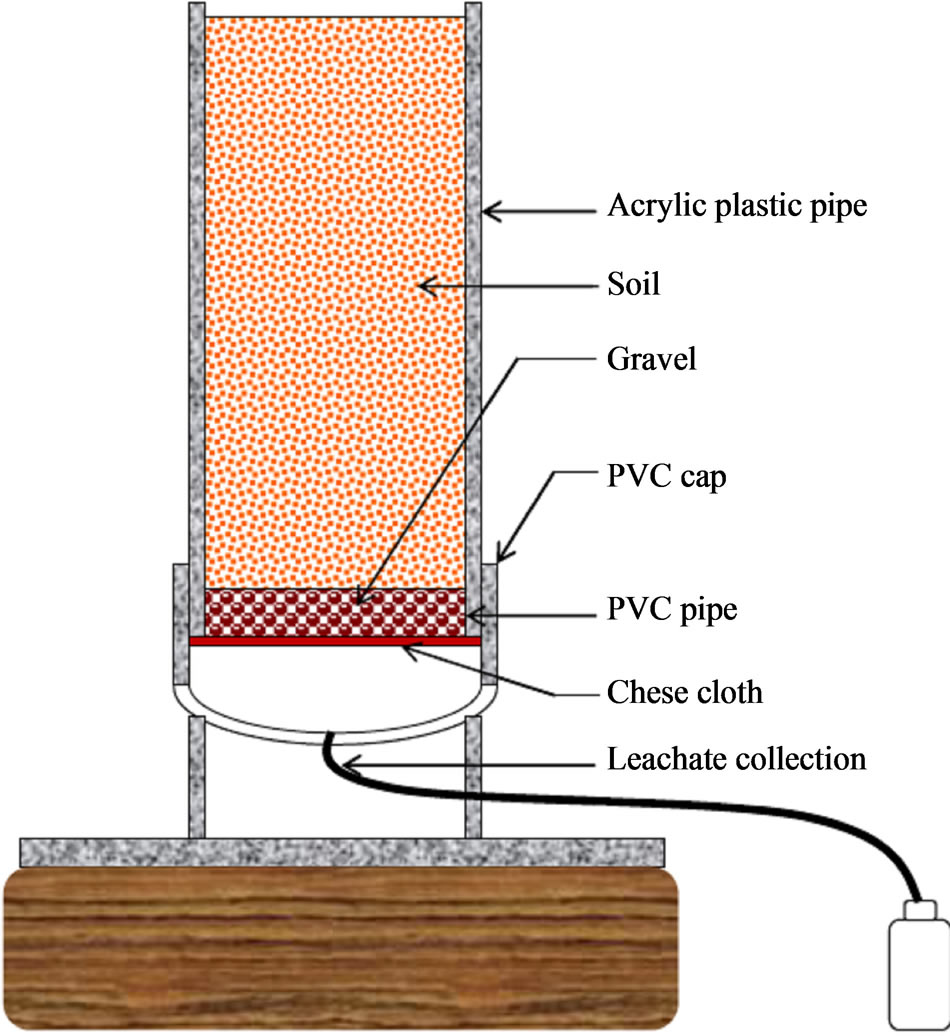
Figure 1. Schematic view of soil column and setup.
kept free to facilitate watering and crop growth. Therefore, the effective soil column height was 35-cm for both GH and GC columns.
The columns were placed in plastic tubs with negligible disturbance to the soil and watered (DI) from the bottom up to 2/3rd column height. The soil columns remained in the tubs for about 48 hours to achieve complete saturation. The saturated columns were carefully plugged into the PVC caps and glued together. The soil columns were allowed to drain for 24 hours and weighed to measure pot holding capacity (PHC), which is similar to field capacity (FC). The PHC was measured as the volume of water left in the soil after 24 hours of free drainage (PHC, cm3/cm3). The BD of the soil columns varied from 1.27 to 1.29 g/cm3 and the PHC varied from 31 to 32%, which are close to those of the parent soil (FC = 32% @ BD = 1.2 g/cm3). The BD and PHC were not significantly different among the soil columns (Pr > 0.05).
2.4. Treatments
The treatments considered in the first round of experiments were 1) Bare soil (C), 2) Biosolid (BS: 728 kg/ha) and 3) PAM coated Biosolid (PAM + BS: 728 kg/ha + 11.2 kg/ha PAM). The biosolid pellets were coated with liquid PAM (1.0%) and fines (0.5%). Details on the PAM and PAM coating method are available elsewhere [21]. The GH column experiments were repeated (second round experiments) with three times greater biosolid application rate while the PAM rate was the same as it was in the first round. Hence, the treatments considered in the second round of experiments were 1) C, 2) BS (2184 kg/ha) and 3) PAM + BS (2184 kg/ha + 11.2 kg/ha PAM). The biosolid pellets were coated with liquid PAM (0.38%) and fines (0.13%). Ryegrass was grown in GH soil columns for both experiments. Table 2 presents the application rates for the biosolid, PAM and ryegrass seed (252 kg/ha) for both rounds of experiments. All treatments were replicated three times in all experiments.
2.5. Experimentation
The soil columns were setup randomly in the greenhouse and growth chamber. The temperature and relative humidity in the greenhouse varied from 24˚C to 27˚C, and 55% to 60%, respectively. Daylight was maintained for 16-hours per day inside the greenhouse. The columns in the growth chamber were kept under dark conditions and at 25˚C. The soil columns were irrigated weekly using DI-water until the volumetric soil moisture exceeded the PHC by 30% to simulate conditions of irrigated soil in the field [22]. Extra DI water (20% of PHC) was provided to the columns to produce enough leachate for the analysis. The treatments (Table 2) were applied by hand
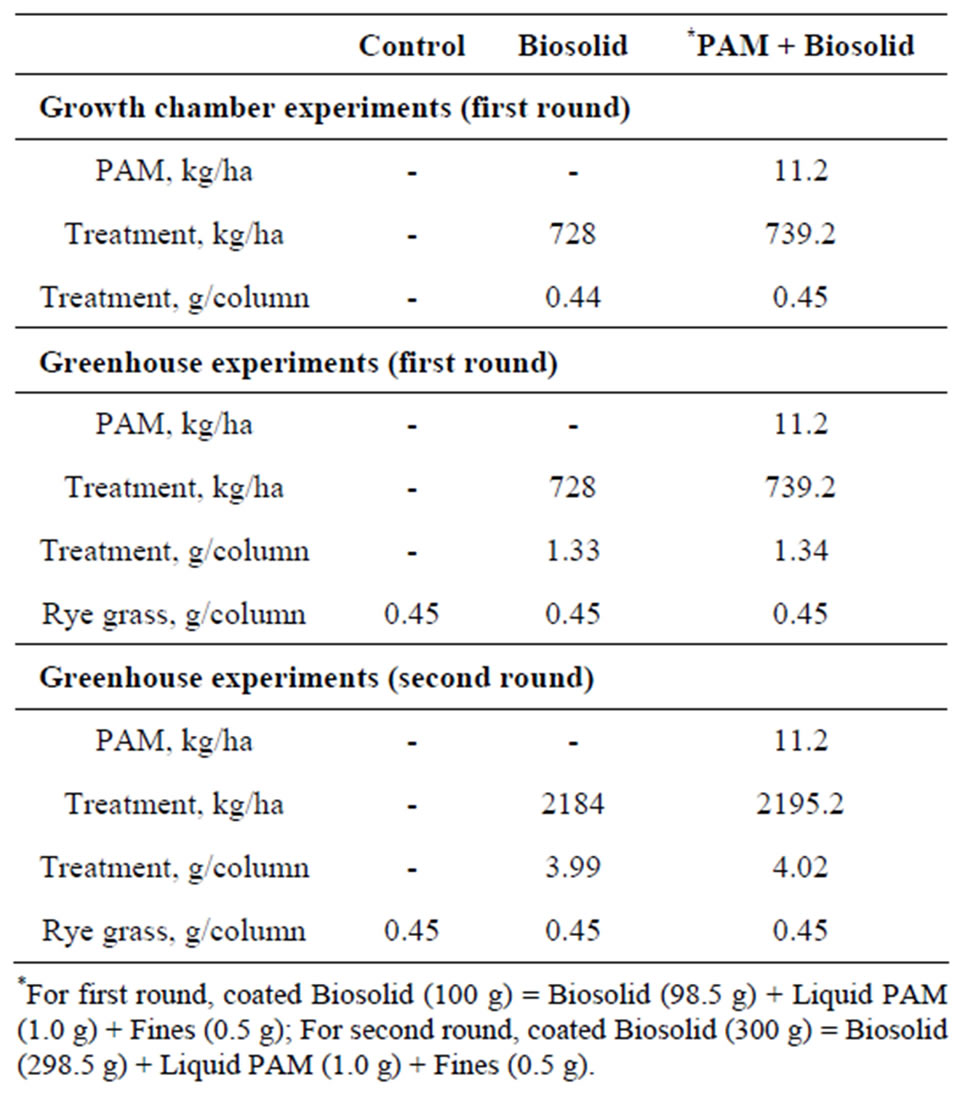
Table 2. Biosolid, PAM and seed application rates (soil column area: 1.83 × 10⁻⁶ ha).
on the soil surface on May 18, 2011, and allowed to rest for 24 hours for both GH and GC columns during the first round of experiments. All columns were weighed one hour before the columns were irrigated on May 19, 2011 and the soil surface was covered with Whatman filter paper. The columns were irrigated using DI water of 850 mL and 270 mL for each of the GH and GC columns, respectively. The DI water was applied slowly using a 250 mL measuring cylinder to minimize water movement towards the edges (circumference) of the soil column. The columns were allowed to drain overnight into Teflon bottles. The bottles containing leachate were replaced with a new set of Teflon bottles and taken to the Environmental Water Quality Laboratory in the Agricultural Engineering Laboratory at UW-Madison on the following morning for leachate quantity and quality analysis.
In the second round of experiments, the treatments were mixed and incorporated into the top 0.5 cm soil layer, and the sides of the GH columns were covered with black polythene sheet to avoid light passing through the transparent PVC columns and to restrict the growth of algae around the soil columns. The second round of experiments started on Sept 1, 2011. The experimental conditions and procedure were the same as the first round of GH experiments, however the second round was carried out for 70 days.
Soil columns were weighed weekly before each irrigation. Leachate samples were collected on the morning following the irrigation and weighed to determine volume. The volume of irrigation water and leachate were used to estimate leachate fraction for a particular irrigation event. A subsample of approximately 60 mL from each leachate sample was acidified using H2SO4 (2 mL H2SO4/1 L DI water) and kept in the freezer for later analysis of Ammonia-N (NH4-N), Nitrate-N (NO3-N), Nitrite-N (NO2-N) and total N (TN) using an AQ2 Discrete Analyzer (Seal Analytical Ltd., WI).
2.6. Statistical Analysis
The data including leachate fraction and nitrogen (forms) in the leachate were analyzed with SAS v. 9.1.3 (SAS Institute Inc., Cary, NC) using the two-factor ANOVA procedure. Mean values were compared with control pair-wise using the student’s t-test (Pr < 0.05) and a dunnett Post hoc test (Pr < 0.05).
3. Results
Leachate and nitrogen results of the incubation studies for both the first and second round are presented below. The NO2-N concentrations in the samples were very low (<0.0001 mg/L) and thus NO2-N results are not presented.
3.1. First Round of Experiments
3.1.1. Leachate
The percentage leachate (leachate depth/irrigation depth) from GC and GH columns was slightly higher for PAM + BS compared to C and BS during the 60-day incubation period, however their means were not significantly different (Tables 3 and 4). Furthermore, the percentage leachate for GC columns was about three times greater than that of GH columns as the GC columns had three times smaller diameter and similar porosity, and about three times lower water input than GH columns. The overall effect of treatment on percentage leachate was not significant, however, the effect of day of irrigation on percentage leachate was significant for both GC and GH columns (Table 5). The interaction of treatment and day of irrigation on percentage leachate was not significantly different for GC and GH columns (Table 5).
3.1.2. NH4-N Concentration and Load
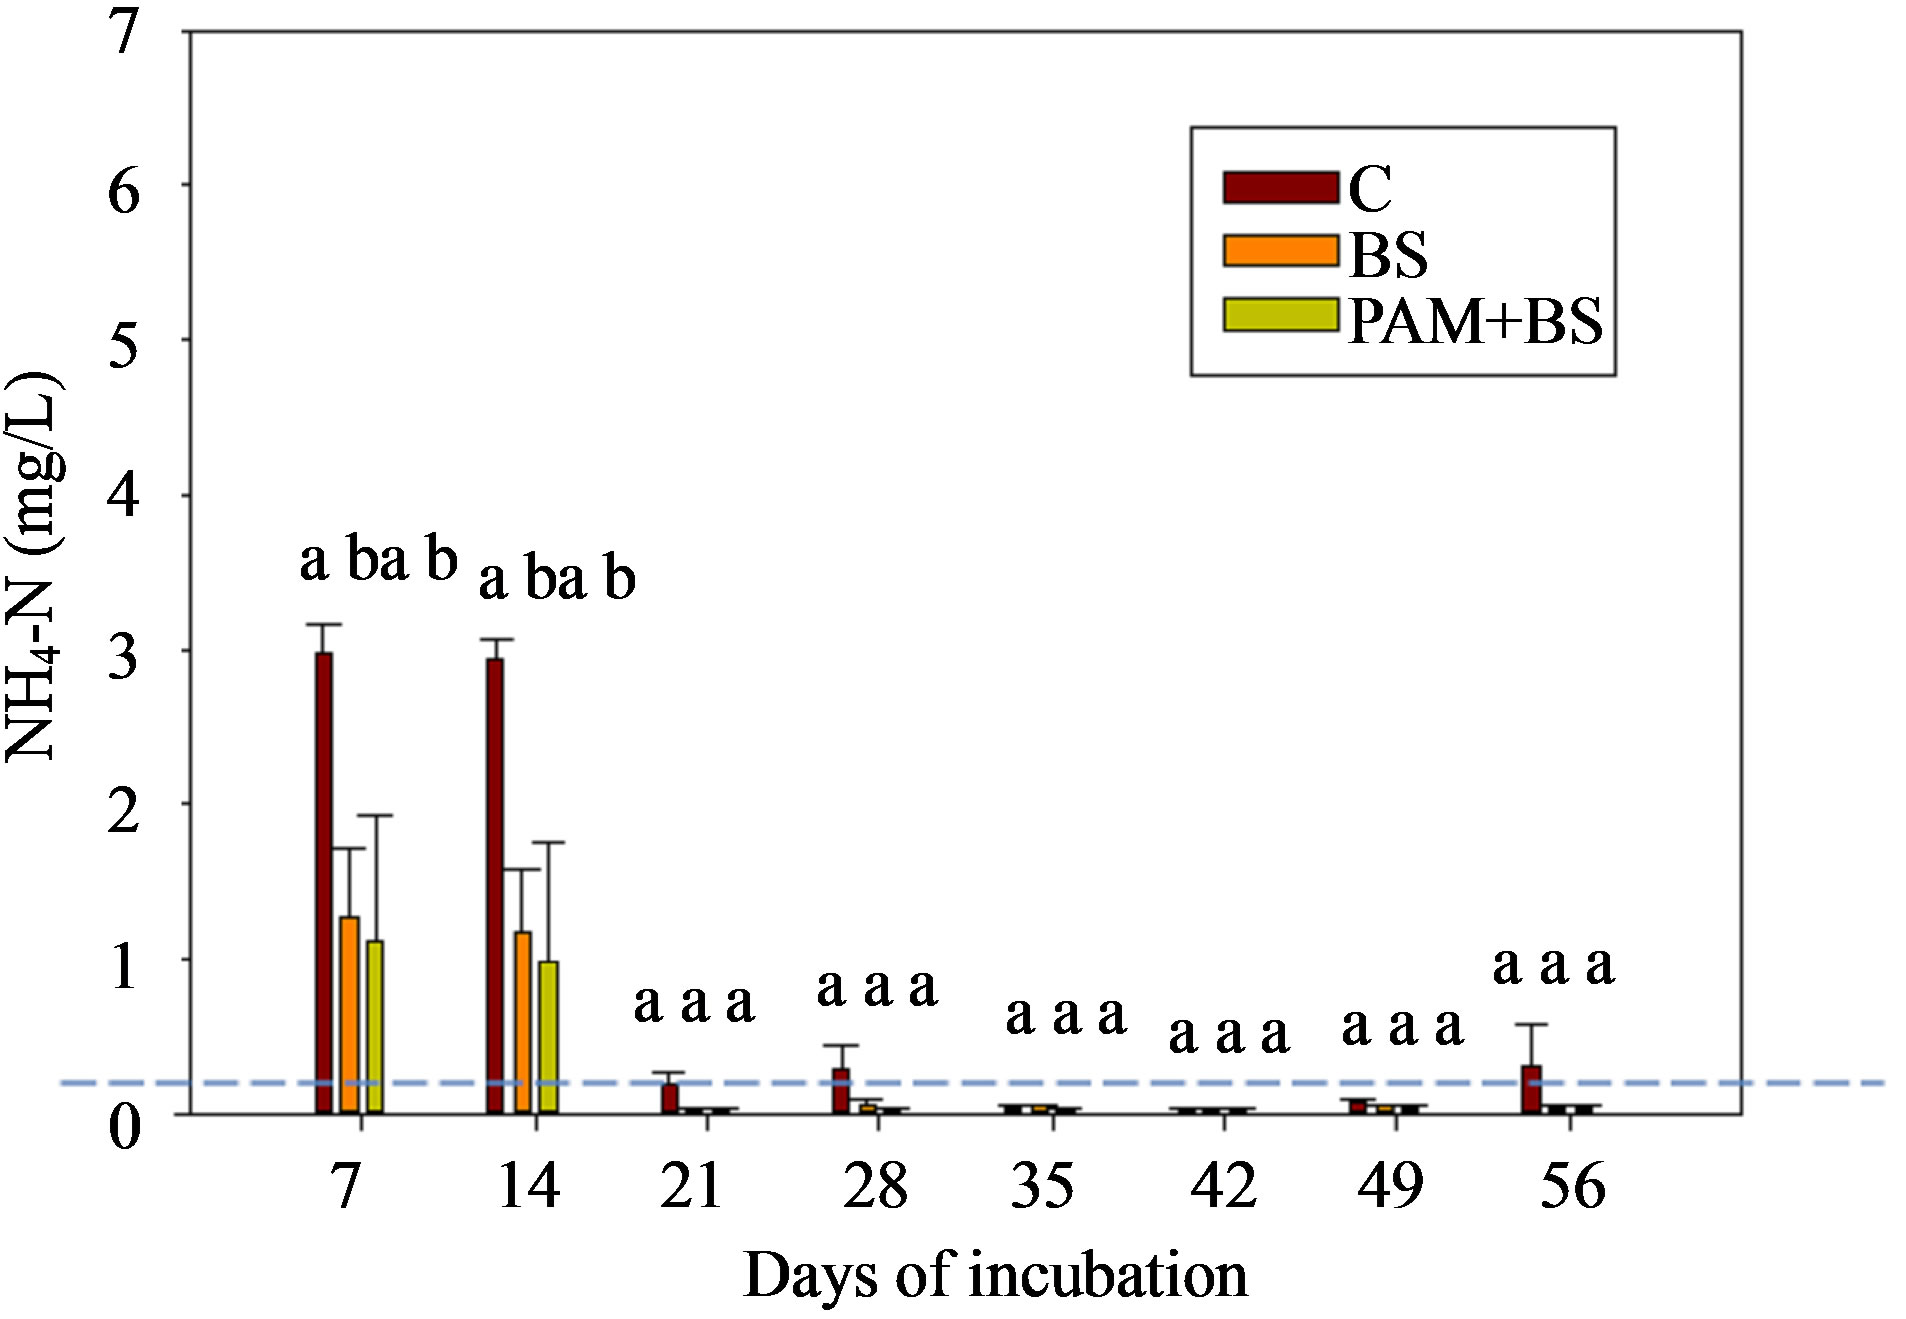
The NH4-N concentration was highest in the beginning of the incubation, and then decreased to near zero in both GC and GH columns (Figure 2). This behavior has been observed by other researchers in aerobic incubation experiments [23,24]. The NH4-N concentrations and loads were not significantly different among the treatments except for concentrations during the first 14 days for GC columns (Figure 2; Tables 3 and 4). Furthermore, the NH4-N concentrations were higher than the USEPA tar-
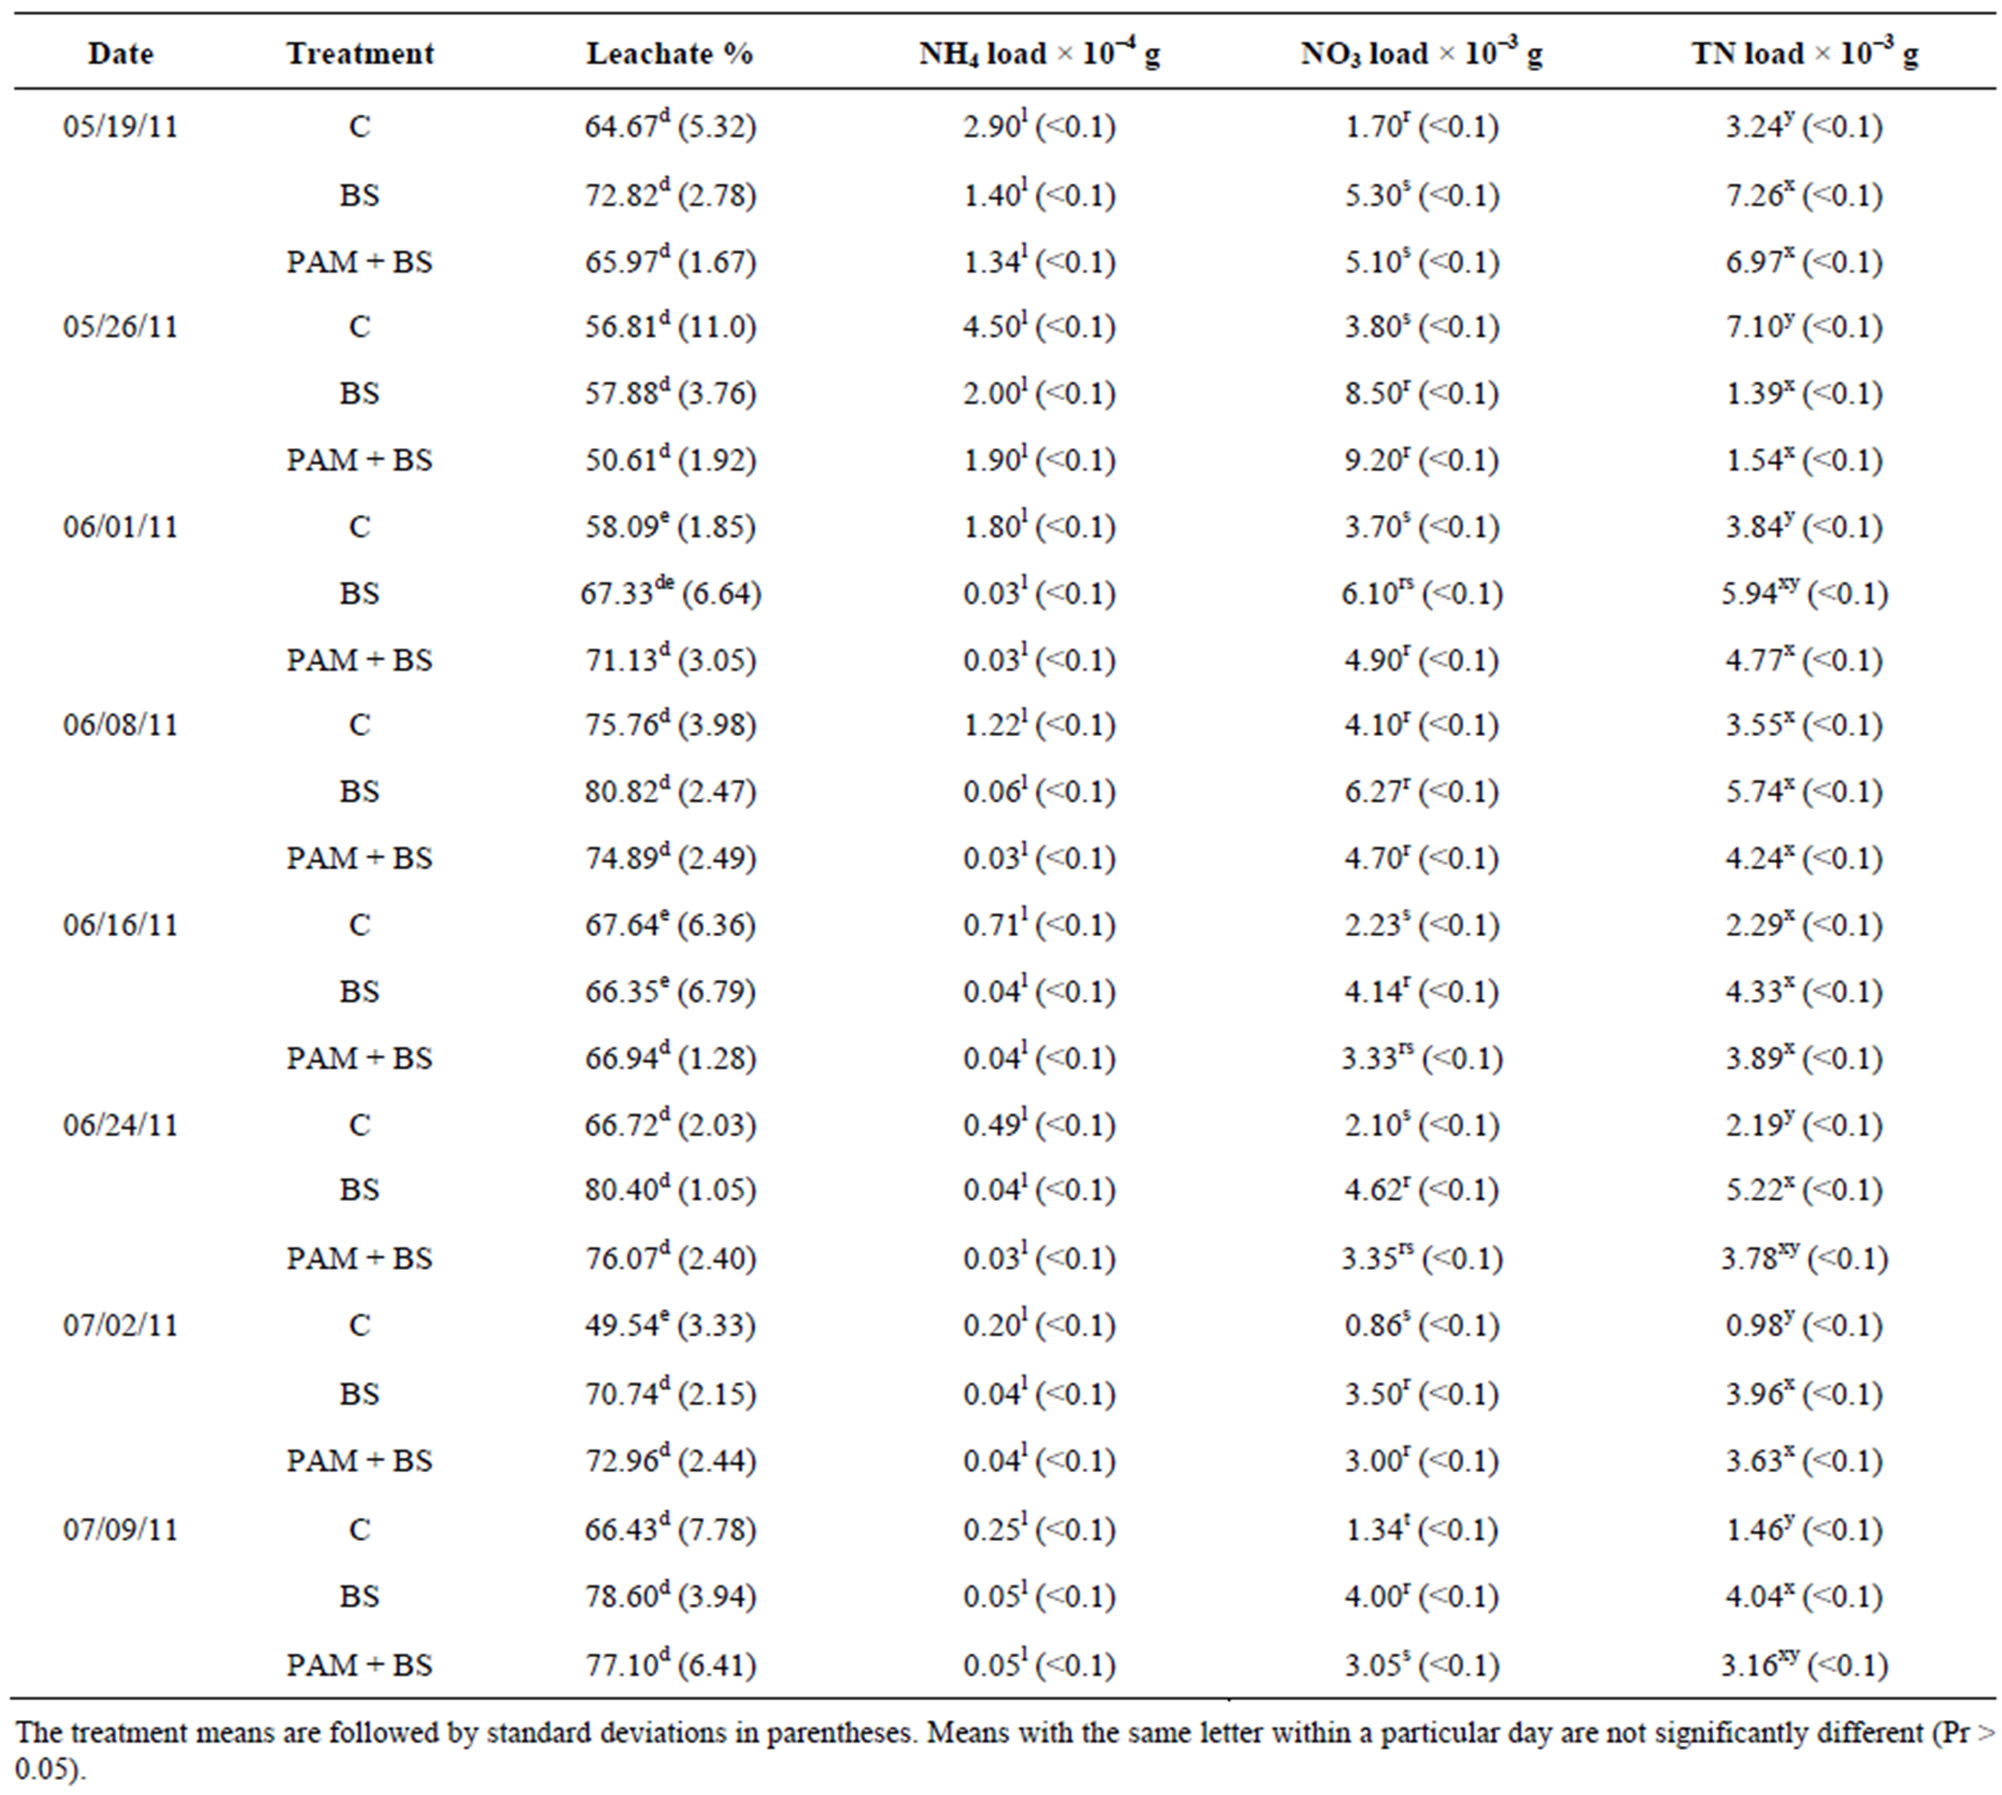
Table 3. Treatment and incubation time effect on the leachate quality for GC columns in first round of experiments.
geted NH4-N level (0.1 mg/L) for groundwater in the beginning of the incubation for GC columns and throughout the incubation for GH columns. The overall effect of treatment on NH4-N concentration and load was not significant for GH columns whereas it was significant for GC columns (Table 5). However, the effect of day of irrigation on NH4-N concentration and load was significant for GH and GC columns. The effect of interaction of treatment and day of irrigation on NH4-N concentration and load was not significant for GC and GH columns (Table 5).
3.1.3. NO3-N Concentration and Load
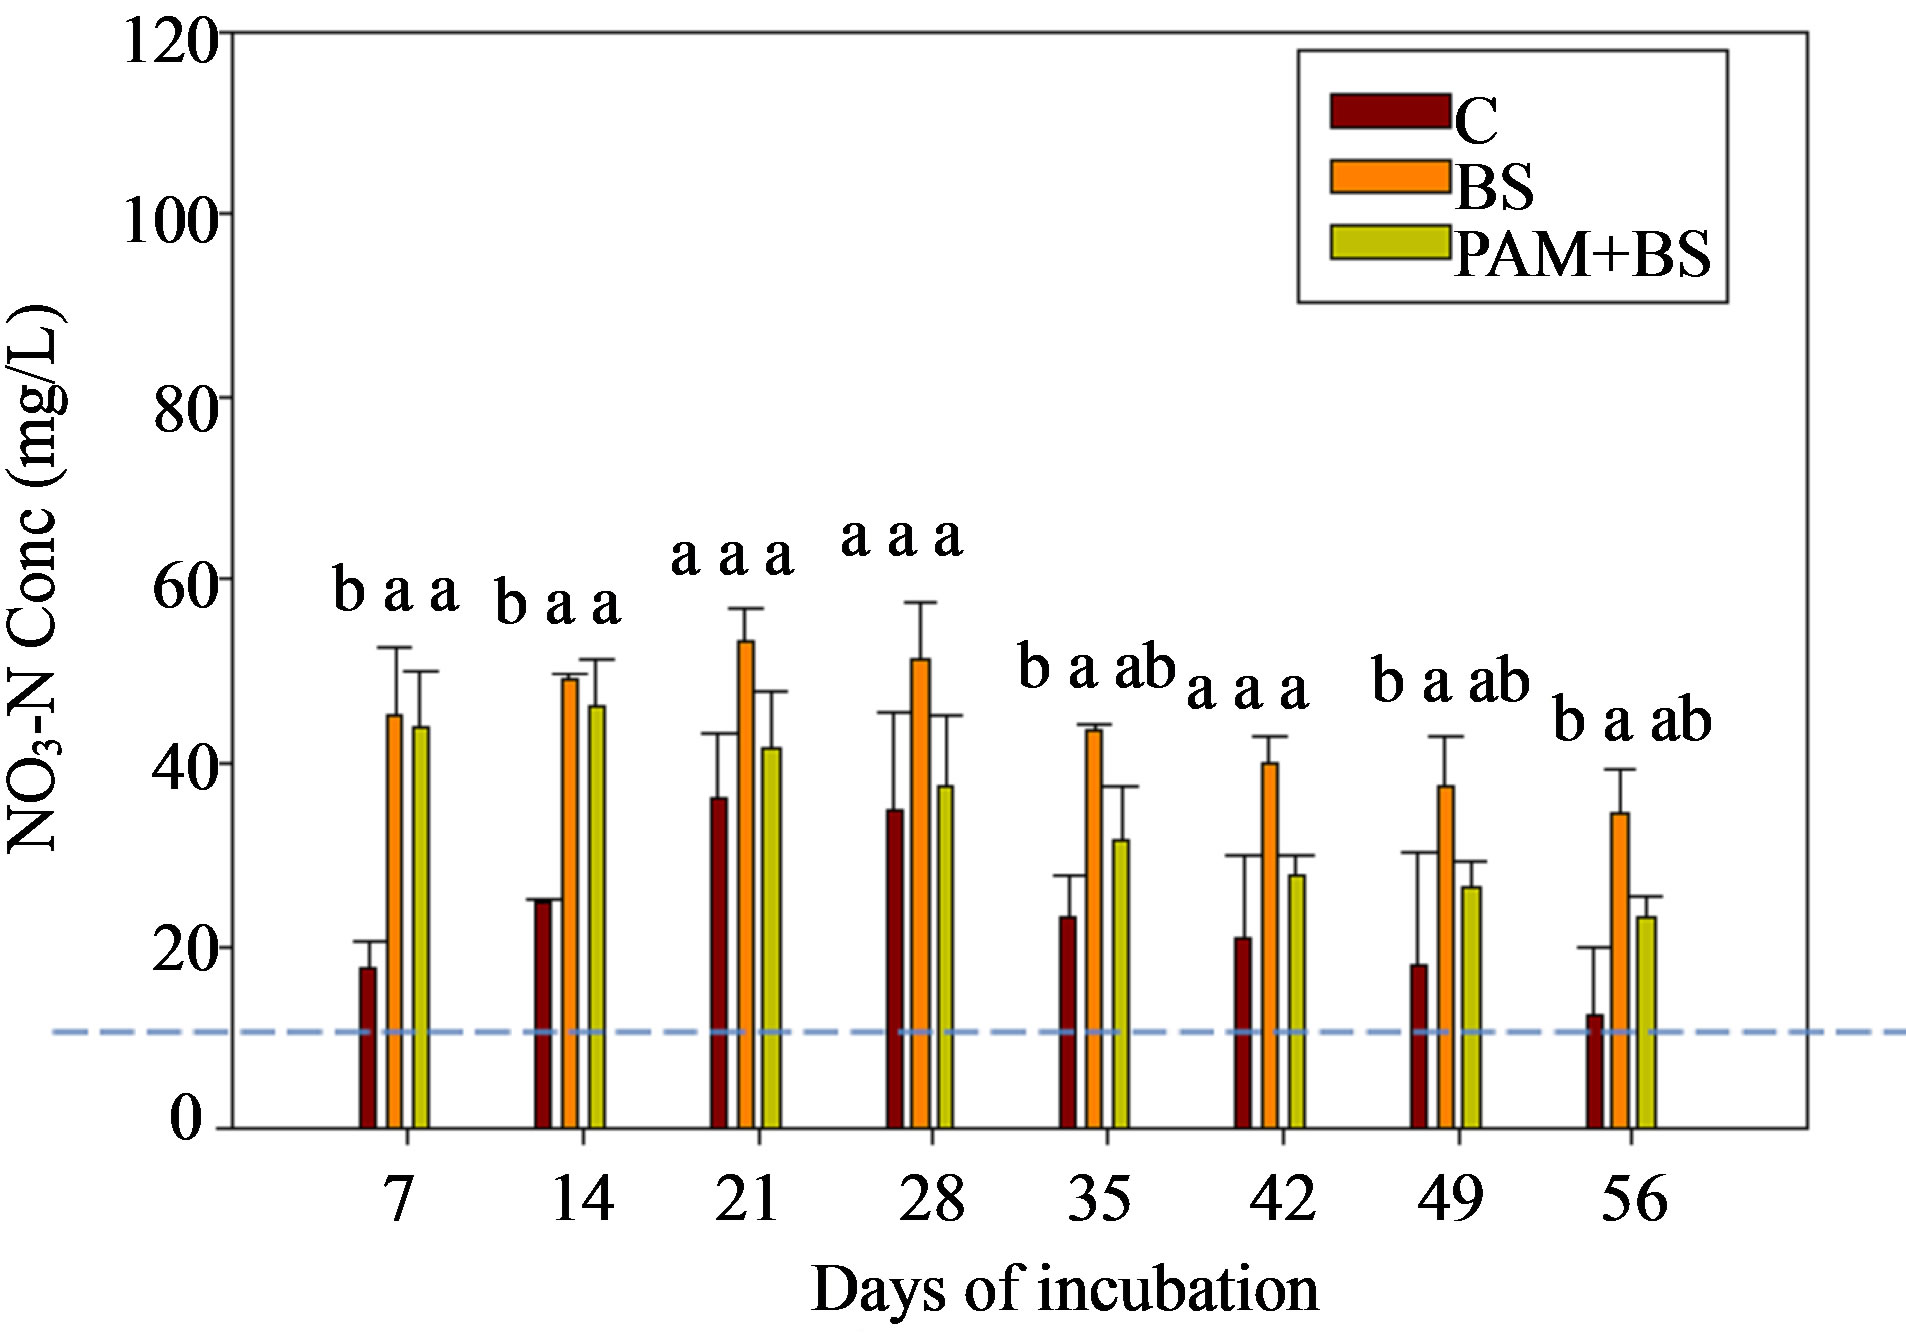
For GC columns, NO3-N concentrations were highest for BS followed by PAM + BS followed by C. In many cases, the NO3-N concentrations and loads for GC columns were significantly different among the treatments whereas they were not significantly different for the GH columns (Figure 3; Tables 3 and 4). The NO3-N concentrations in GC columns were greater than the USEPA targeted NO3-N level (10 mg/L) for all treatments and days of irrigation. The NO3-N concentrations for the GH columns were higher than the USEPA target primarily in the middle of the incubation period and overall were lower compared to the GC columns (Figure 3). In both cases, the NO3-N concentrations increased in the beginning and then decreased with time. However, the NH4-N decrease (Figure 2) did not increase the NO3-N concentration after 28 days of incubation (Figure 3). The overall effect of treatment on NO3-N concentration and load was not significant for GH columns whereas it was significant for GC columns (Table 5). The effect of day of
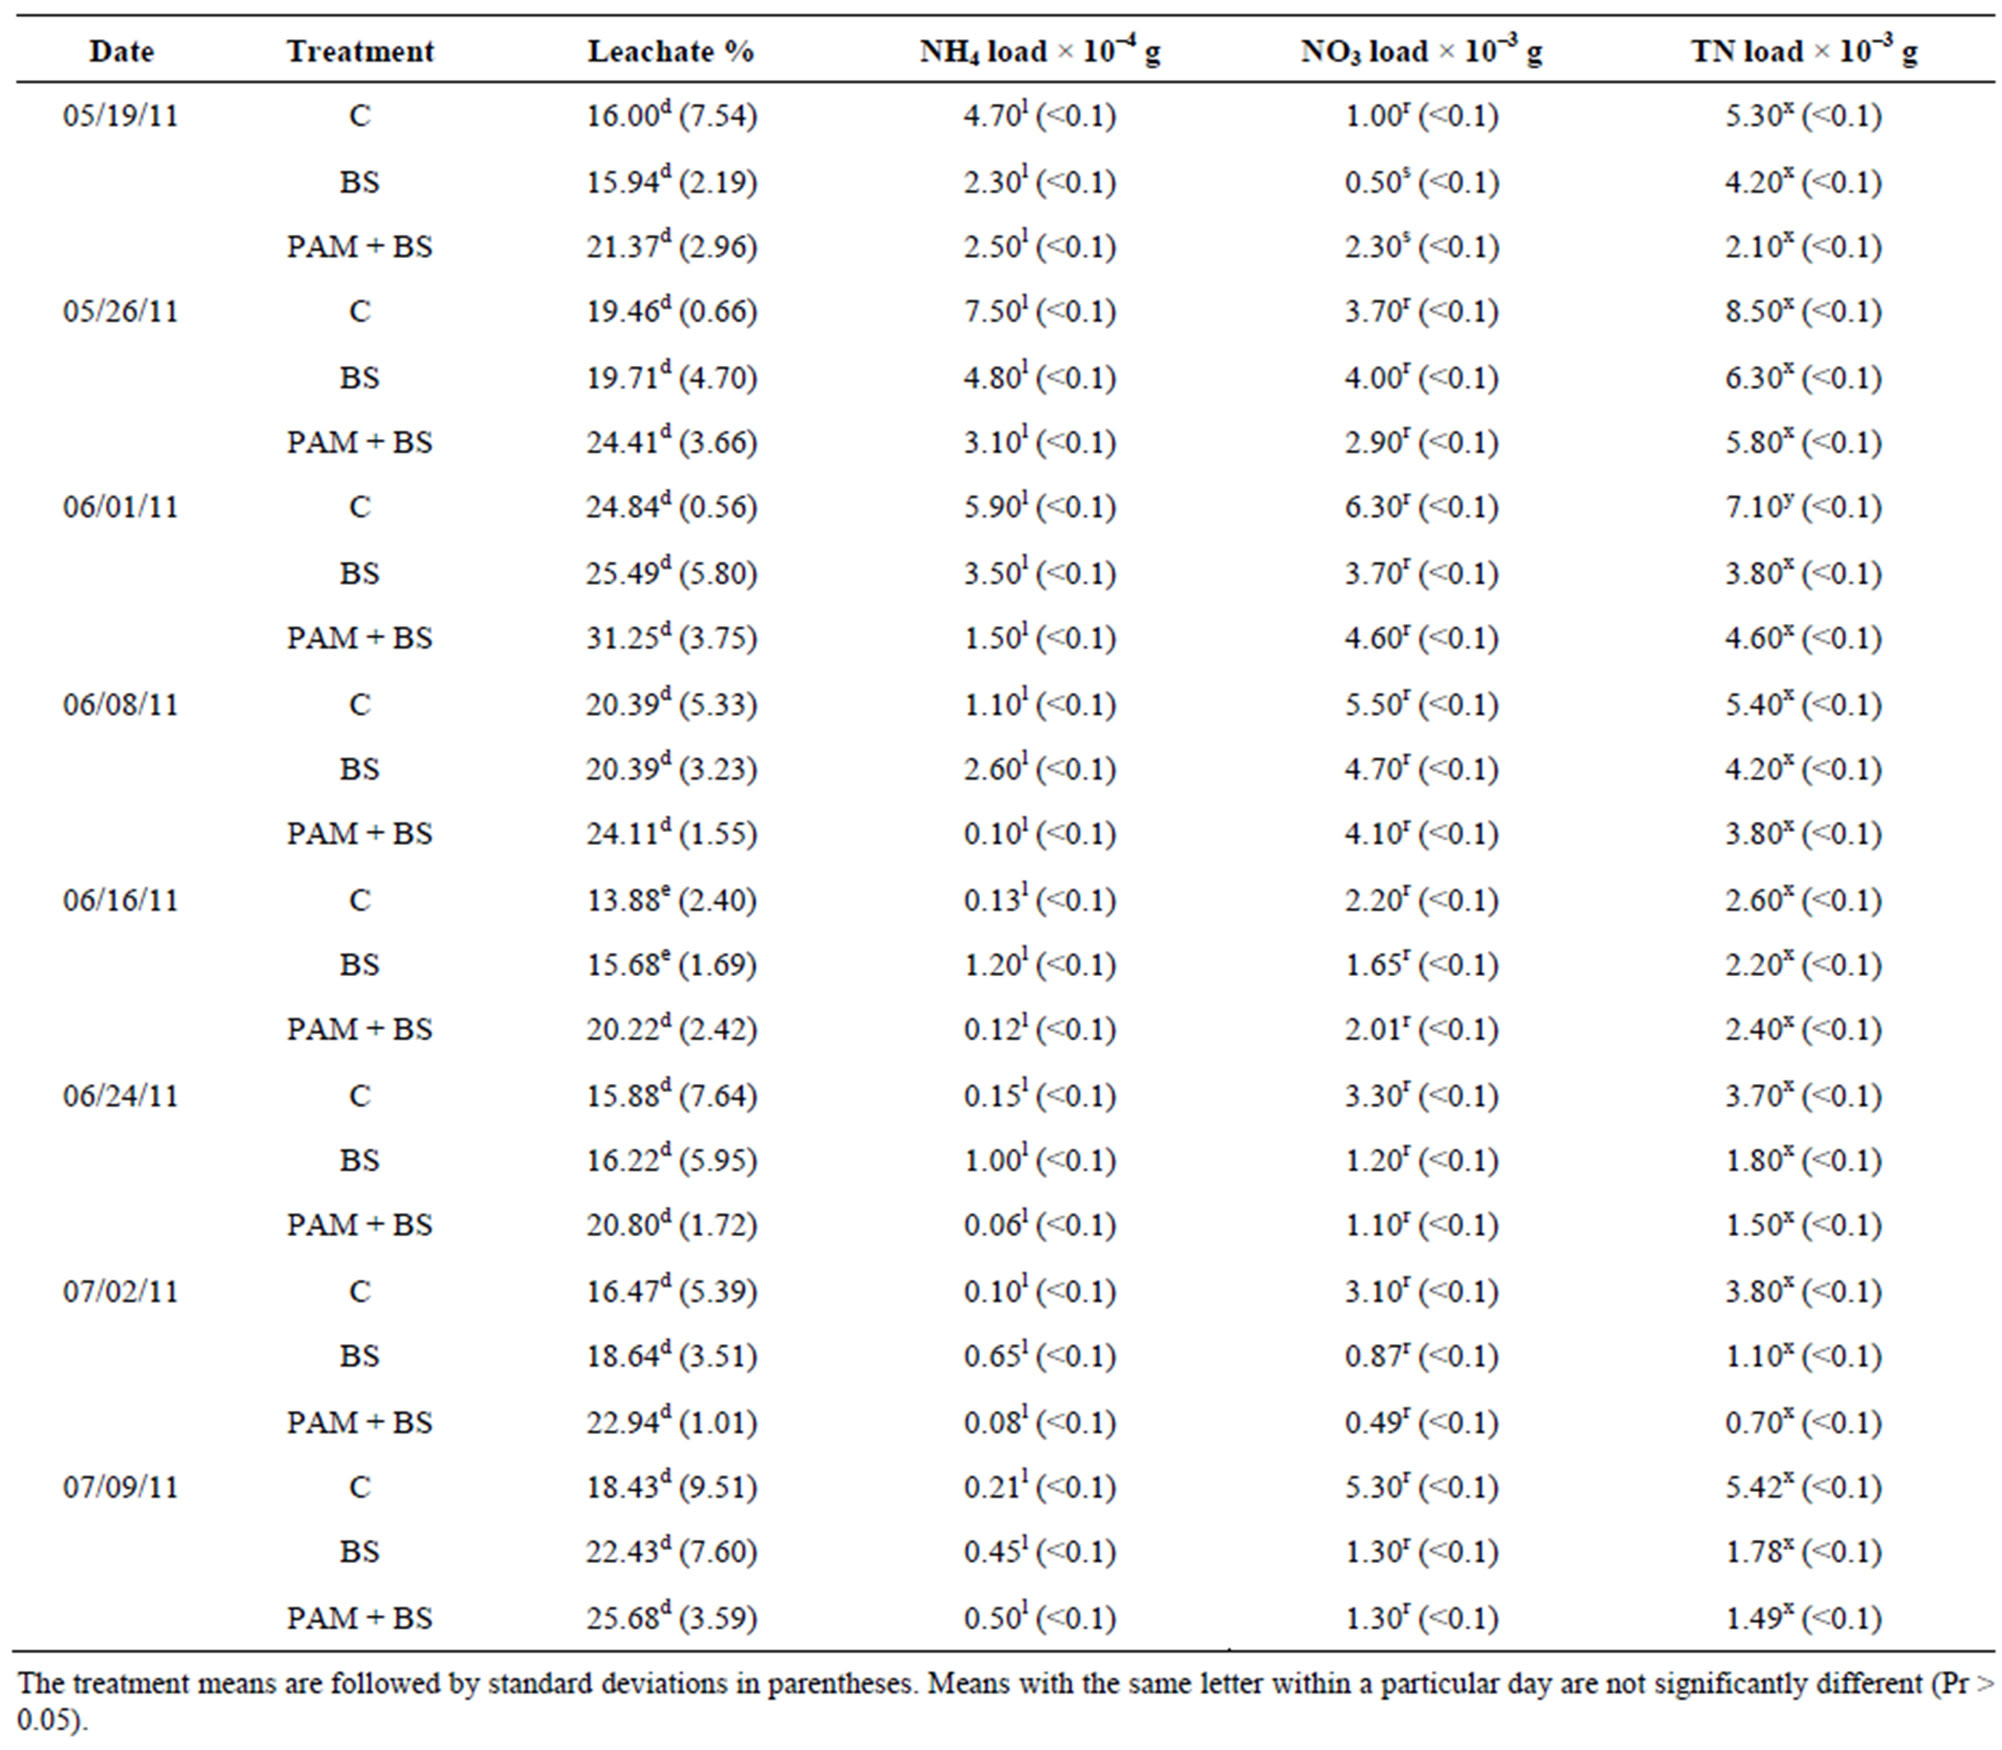
Table 4. Treatment and incubation time effect on the leachate quality for GH columns in first round of experiments.
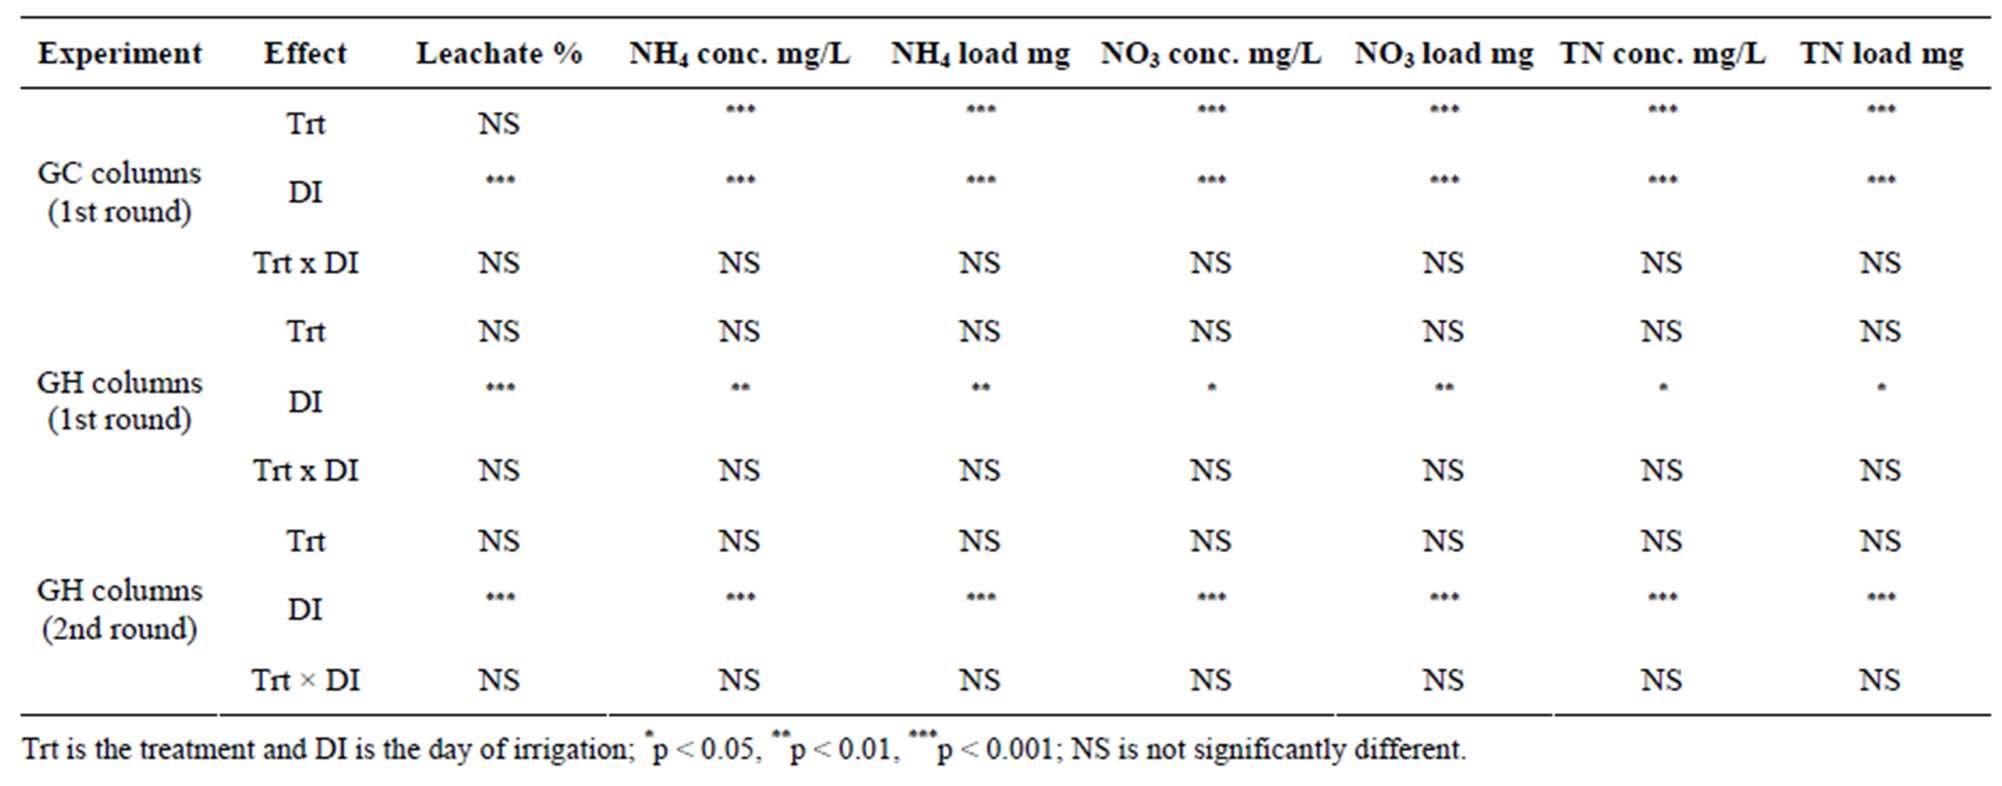
Table 5. Two-way ANOVA results: treatment and incubation time effect.
 (a)
(a)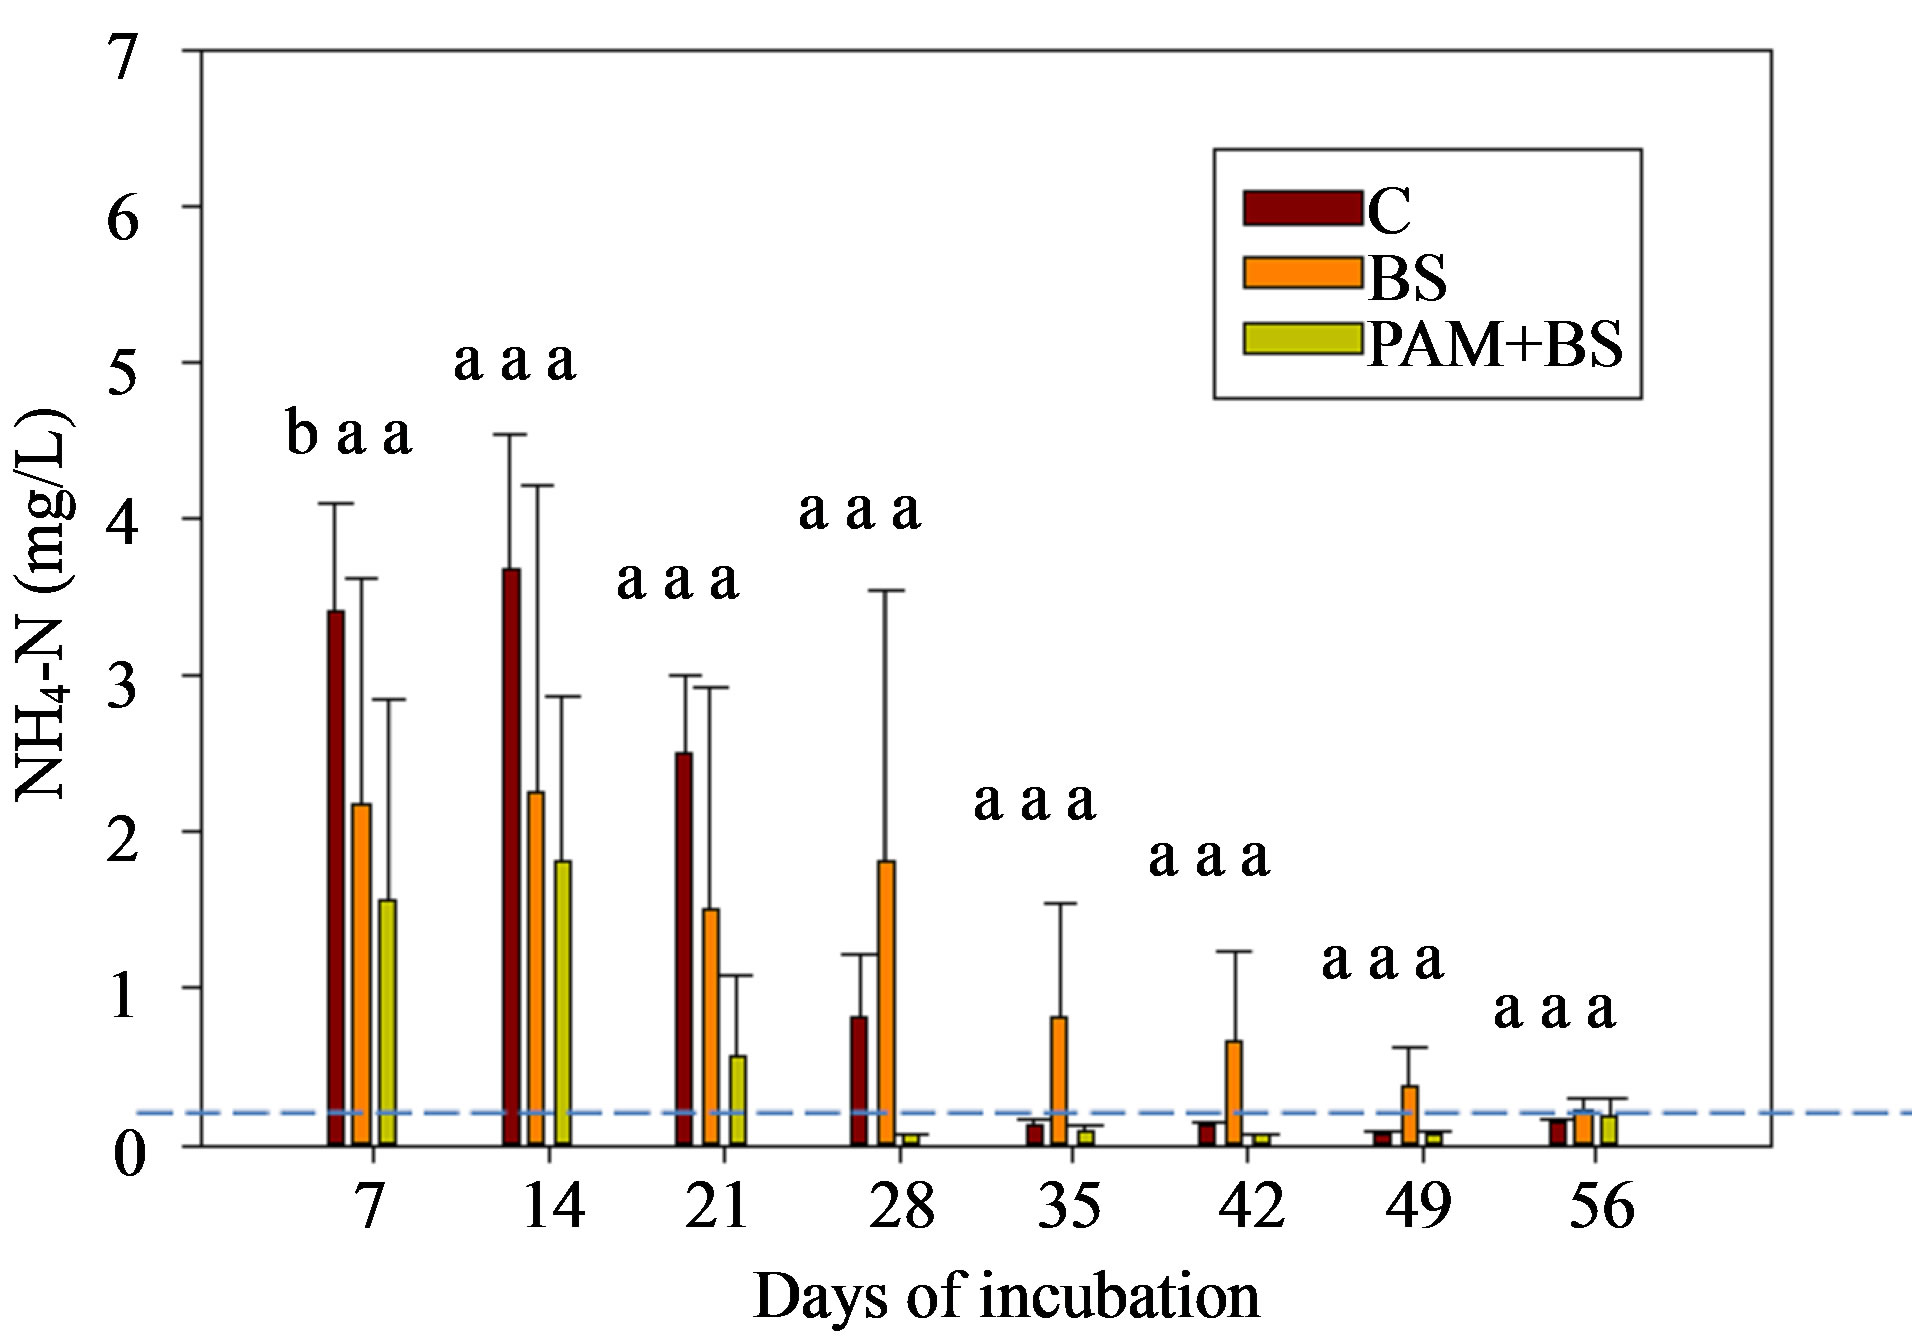 (b)
(b)
Figure 2. NH4-N concentration in the leachate for (a) GC columns and (b) GH columns in the first round of experiments. The dashed horizontal line indicates the USEPA targeted NH4-N concentration (0.1 mg/L). The treatment means with the same letter within a particular day are not significantly different.
irrigation on NO3-N concentration and load was significant for both GC and GH columns. The effect of interacttion of treatment and day of irrigation was not significant for NO3-N concentration or load, for all columns (Table 5).
3.1.4. Total N Concentration and Load
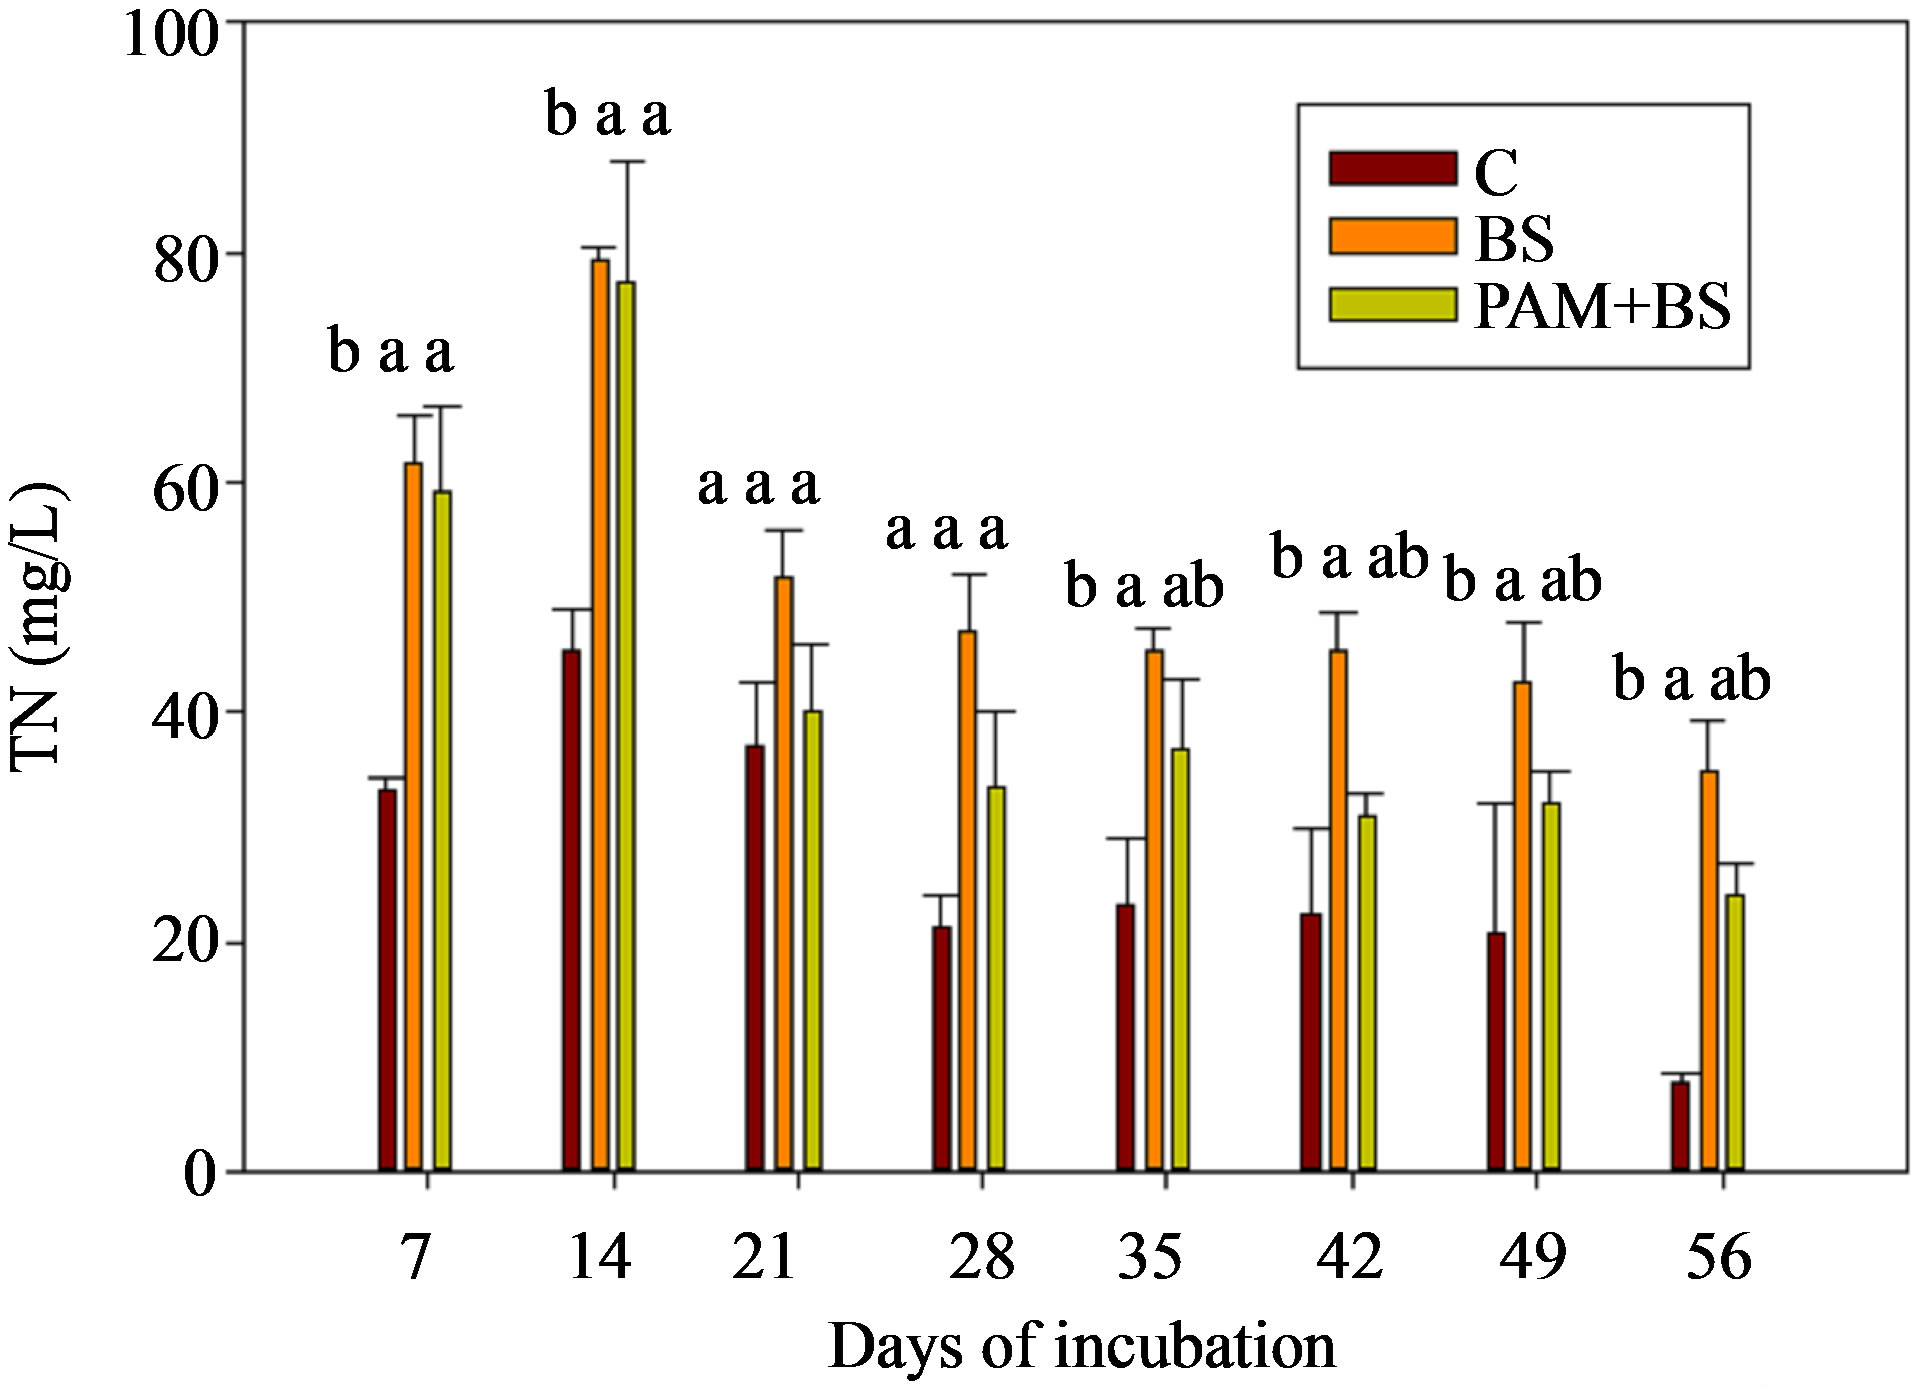
The TN concentrations (8 - 80 mg/L for GC columns; 9 - 60 mg/L for GH columns) and loads in the leachate followed the NO3-N trends (Figure 4; Tables 3 and 4). In the GC columns, TN concentration and load were greater for the BS treatment than PAM + BS and C treatments. Overall, the TN concentrations were lower for GH columns compared to GC columns. In many cases, the TN concentrations and loads were significantly different among treatments for GC columns; whereas they were not significantly different for GH columns. The overall effect of treatment on TN concentration and load was
 (a)
(a)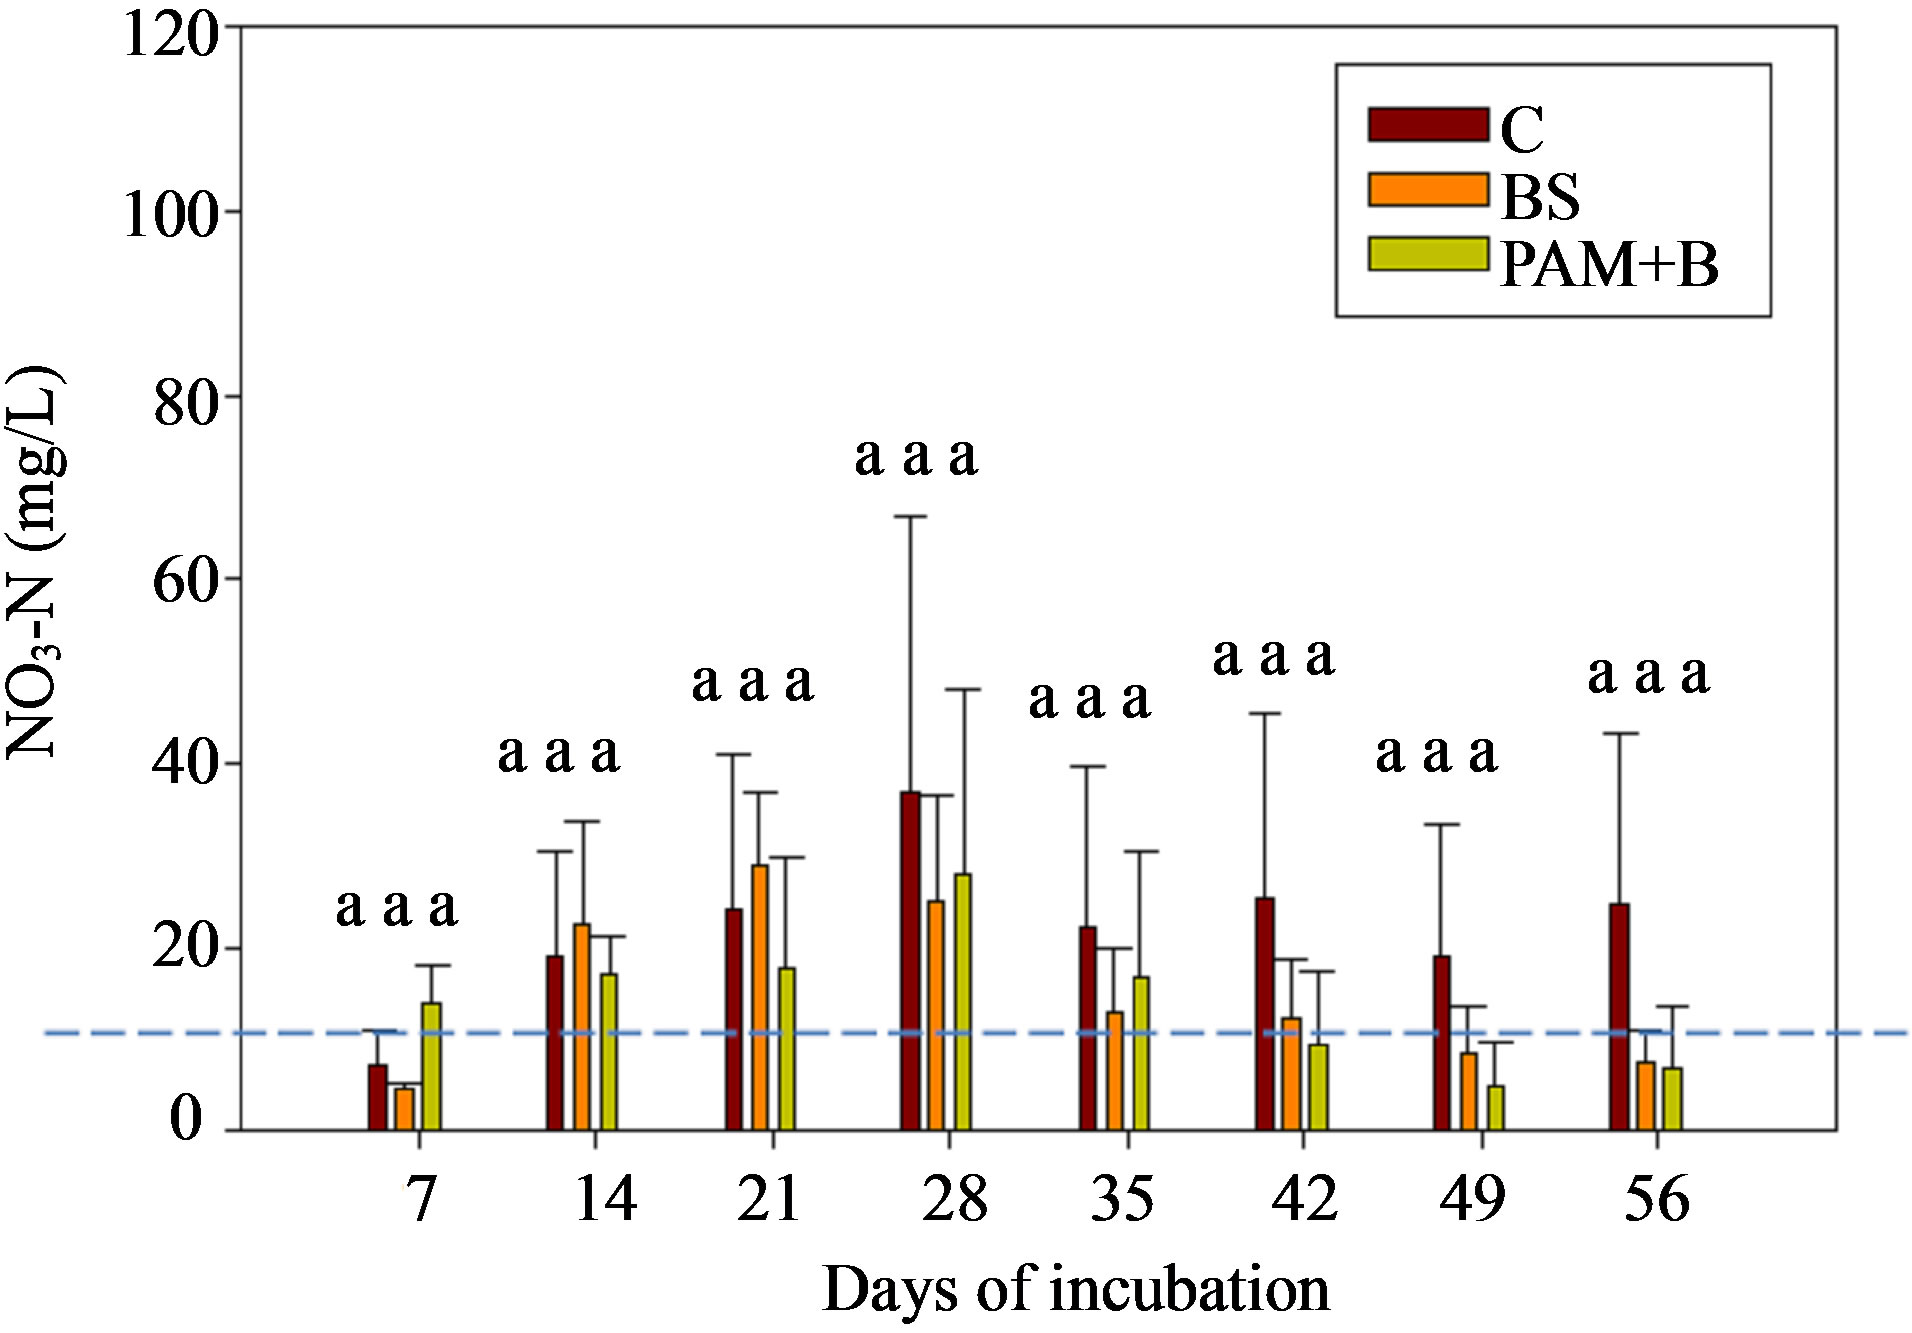 (b)
(b)
Figure 3. NO3-N concentration in the leachate for (a) GC columns and (b) GH columns in the first round of experiments. The dashed horizontal line indicates the USEPA targeted NO3-N concentration (10 mg/L). The treatment means with the same letter within a particular day are not significantly different.
significant for GC columns; whereas it was not significant for GH columns. The effect of day of irrigation was significant for both GC and GH columns (Table 5). The effect of interaction between treatment and incubation time on TN concentration and load was not significant for GC and GH columns (Table 5).
3.2. Second Round of Experiments
3.2.1. Leachate
Similar to the results from the first round of experiments, when comparing individually irrigations, the percentage leachate was not significantly different among the treatments (Table 6). The overall effect of treatment on percentage leachate was also not significant (Table 5). However, the effect of day of irrigation on the percentage leachate was significant (Table 5). Furthermore, the effect of interaction of treatment and day of irrigation was not significant (Table 5).
 (a)
(a)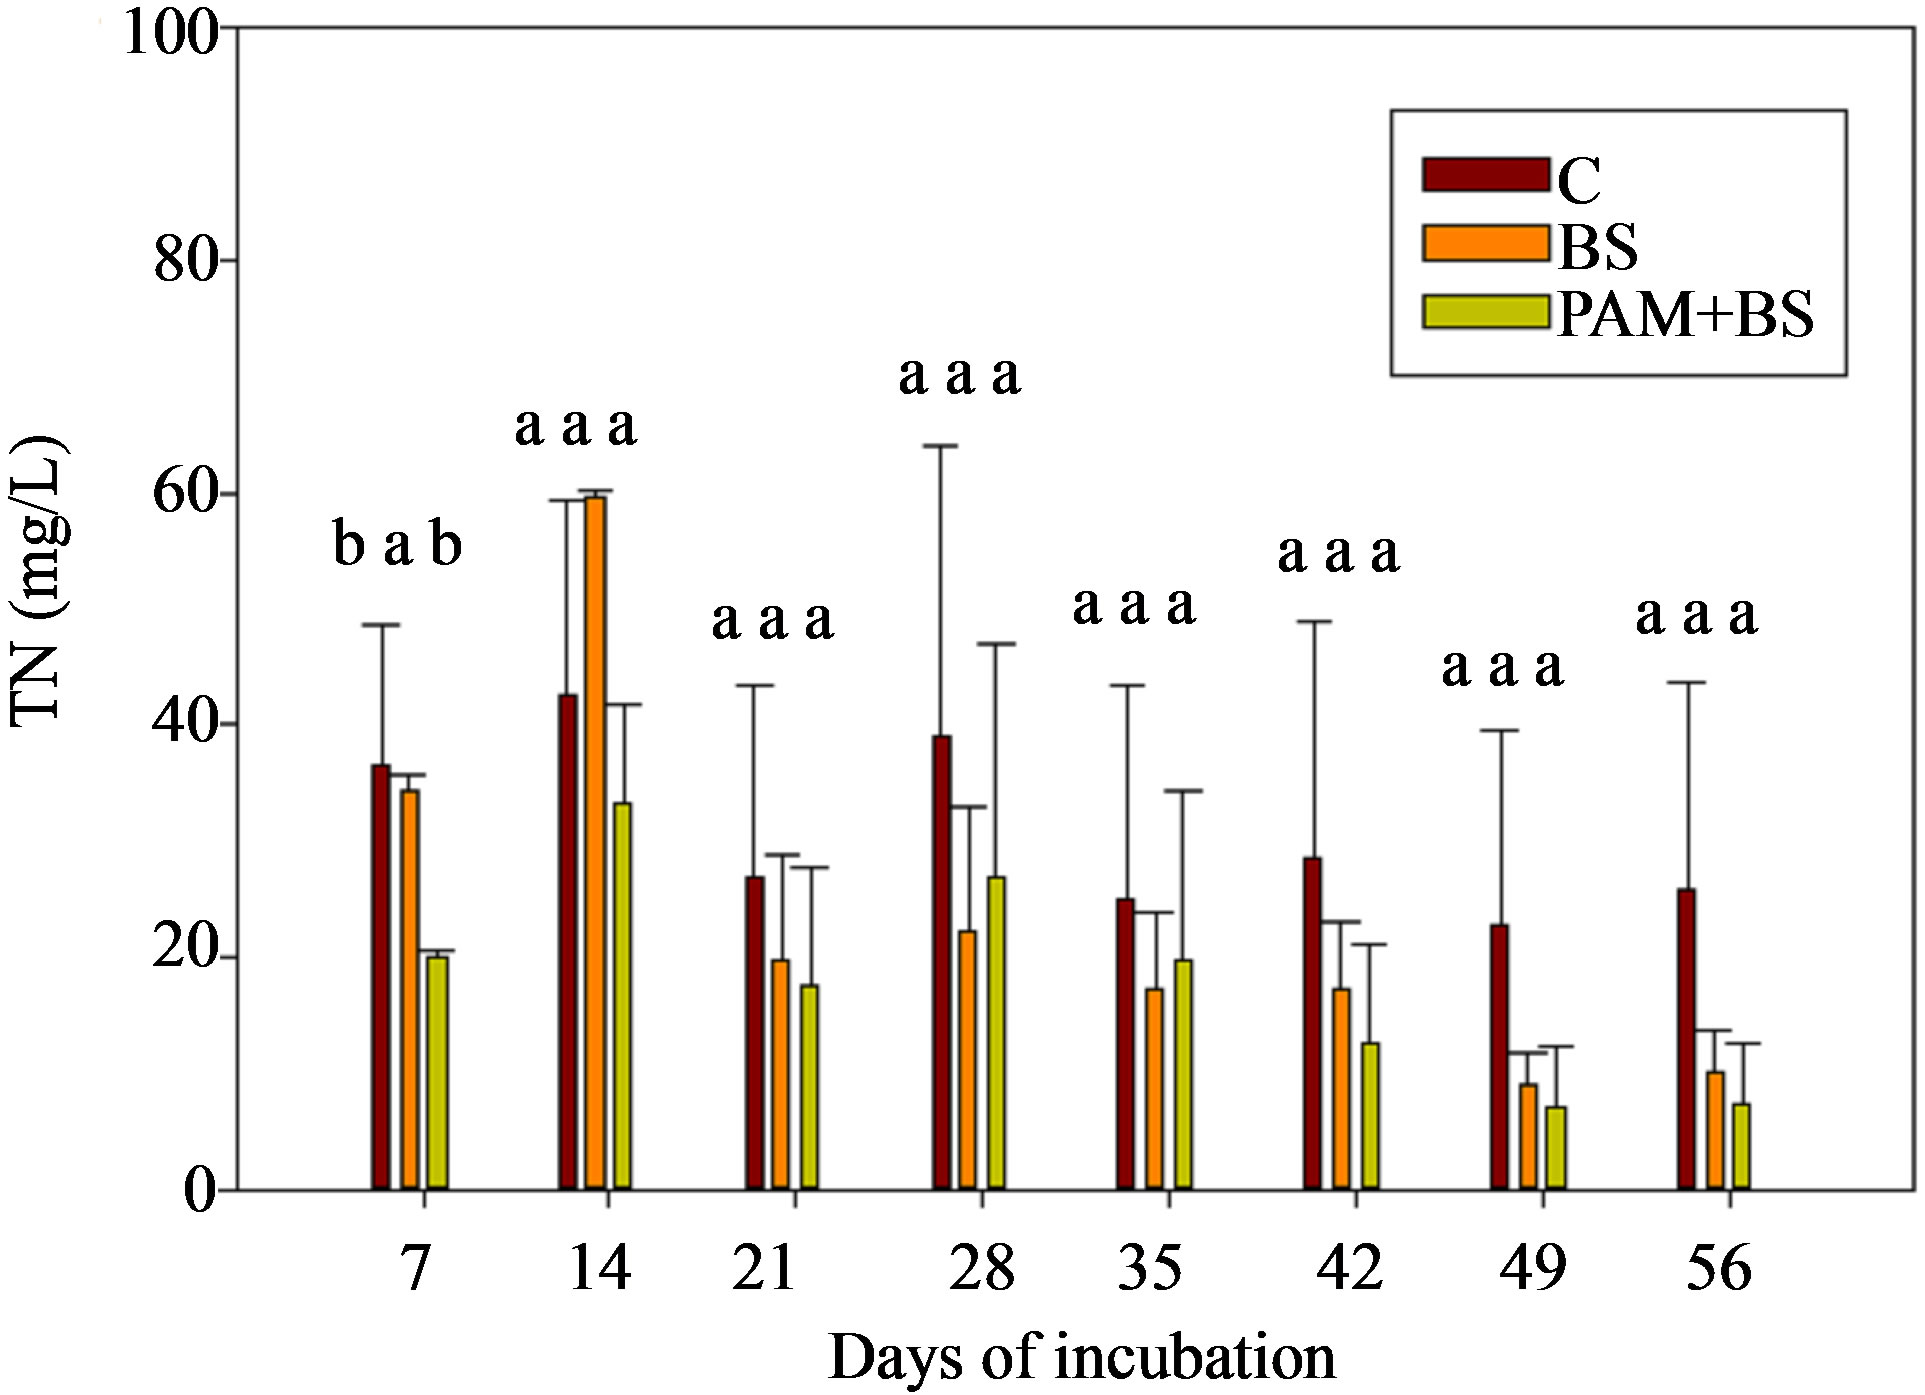 (b)
(b)
Figure 4. TN concentration in the leachate for (a) GC columns and (b) GH columns in the first round of experiments. The treatment means with the same letter within a particular day are not significantly different.
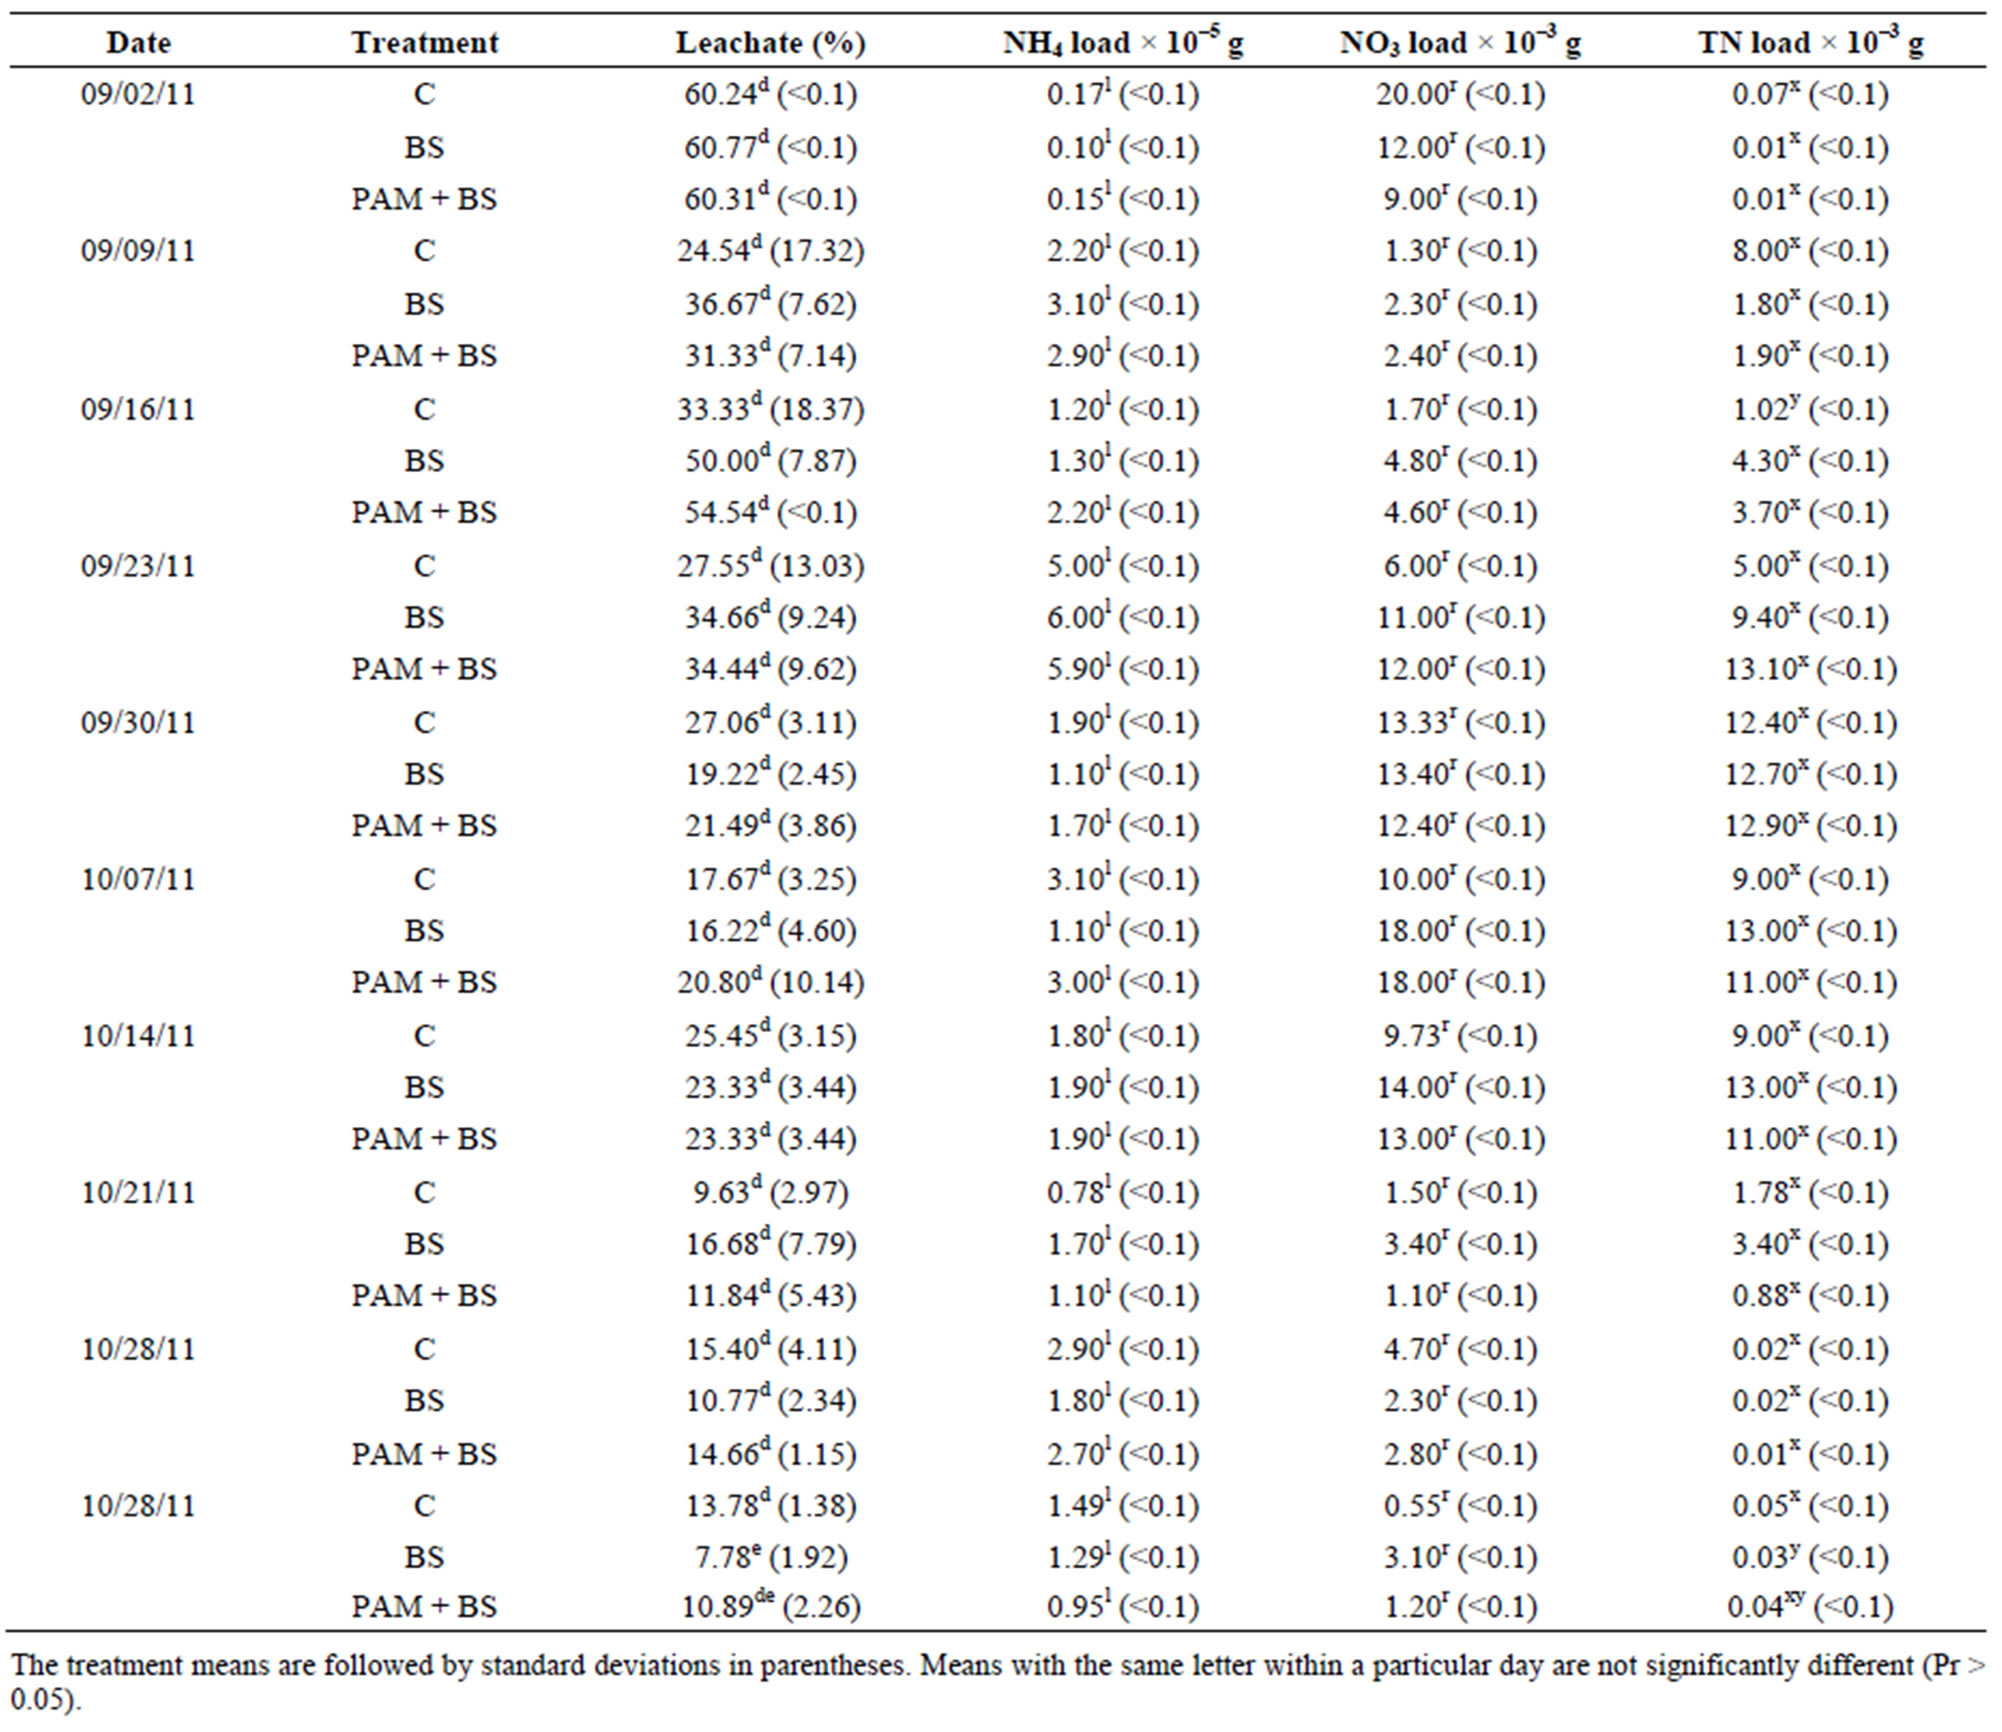
Table 6. Treatment and incubation time effect on the leachate quality for GH columns in second round experiments.
3.2.2. NH4-N Concentration and Load
The NH4-N concentration in the leachate was highest in the beginning of incubation and then decreased rapidly for all treatments (Figure 5). The NH4-N concentration and load were not significantly different among the treatments (Figure 5 and Table 6) and the concentrations were mostly below the USEPA targeted level (0.1 mgNH4-N/L) after two weeks of incubation. The NH4-N concentrations observed in this trial (three times higher rate of biosolid application) were lower than those observed in the first round of GH columns. The overall effect of treatment on NH4-N concentration and load was not significant (Table 5). However, the effect of day of irrigation on NH4-N concentration and load was significant. The effect of interaction of treatment and day of irrigation on NH4-N was not significant (Table 5).
3.2.3. NO3-N Concentration and Load
The NO3-N concentrations and loads in the leachate were not significantly different among the treatments (Figure 6 and Table 6). As was the case in the first round of GH experiments, the NO3-N concentrations increased in the beginning of the incubation and then decreased with time. The NO3-N concentrations were greater than the USEPA targeted level (10 mg/L) in the middle of the incubation. Furthermore, the NO3-N concentrations were about 2.5 to 2.7 times greater than in the first round GH experiments. Similar to the first round, the overall effect of treatment on NO3-N concentration and load was not significant (Table 5). However, the effect of day of irrigation on NO3-N concentration and load was significant (Table 5). The effect of interaction of treatment and day of irrigation on NO3-N concentration or load was not significant.
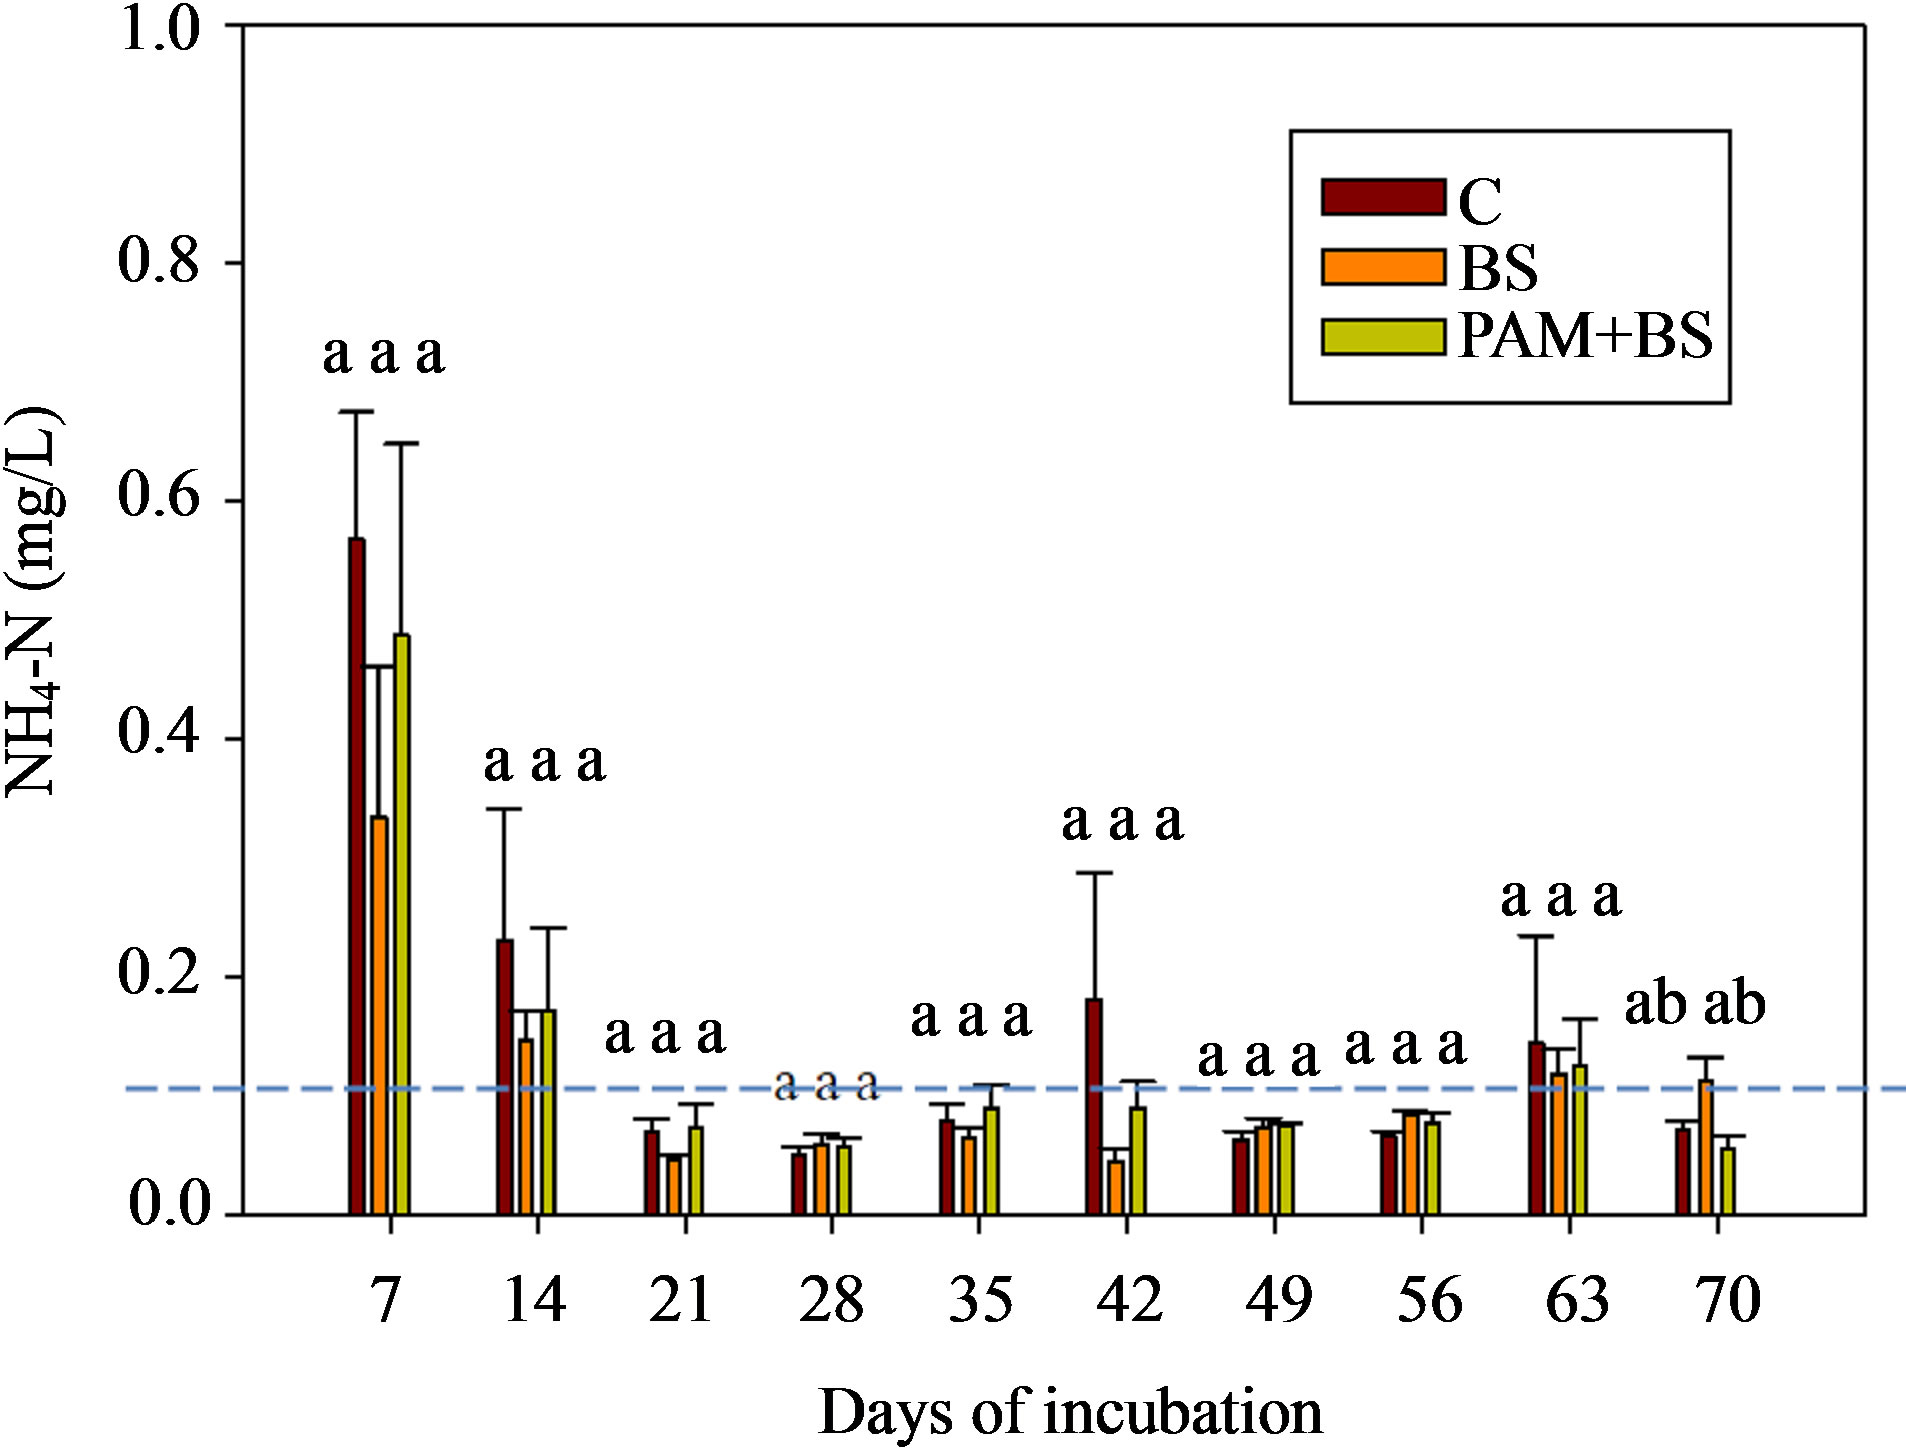
Figure 5. NH4-N concentration in the leachate for GH columns in the second round of experiments. The dashed horizontal line indicates the USEPA targeted NH4-N concentration (0.1 mg/L). The treatment means with the same letter within a particular day are not significantly different.
3.2.4. TN Concentration and Load
The TN concentrations (0.02 to 80 mg/L) in the leachate followed the trends of NO3-N concentration (Figure 7). In most cases, the leachate from BS treatment had greater TN load than PAM + BS and C treatments but the differences were not statistically significant. The overall effect of treatment on TN was not significant (Table 5). However, the effect of day of irrigation was significant. The effect of interaction between treatment and day of irrigation was not significant
4. Discussion
The percentage leachate is one of the key parameters influencing downward nutrient loads. Since all columns were initially maintained at the same BD, the initial physical properties were assumed similar for all treat-
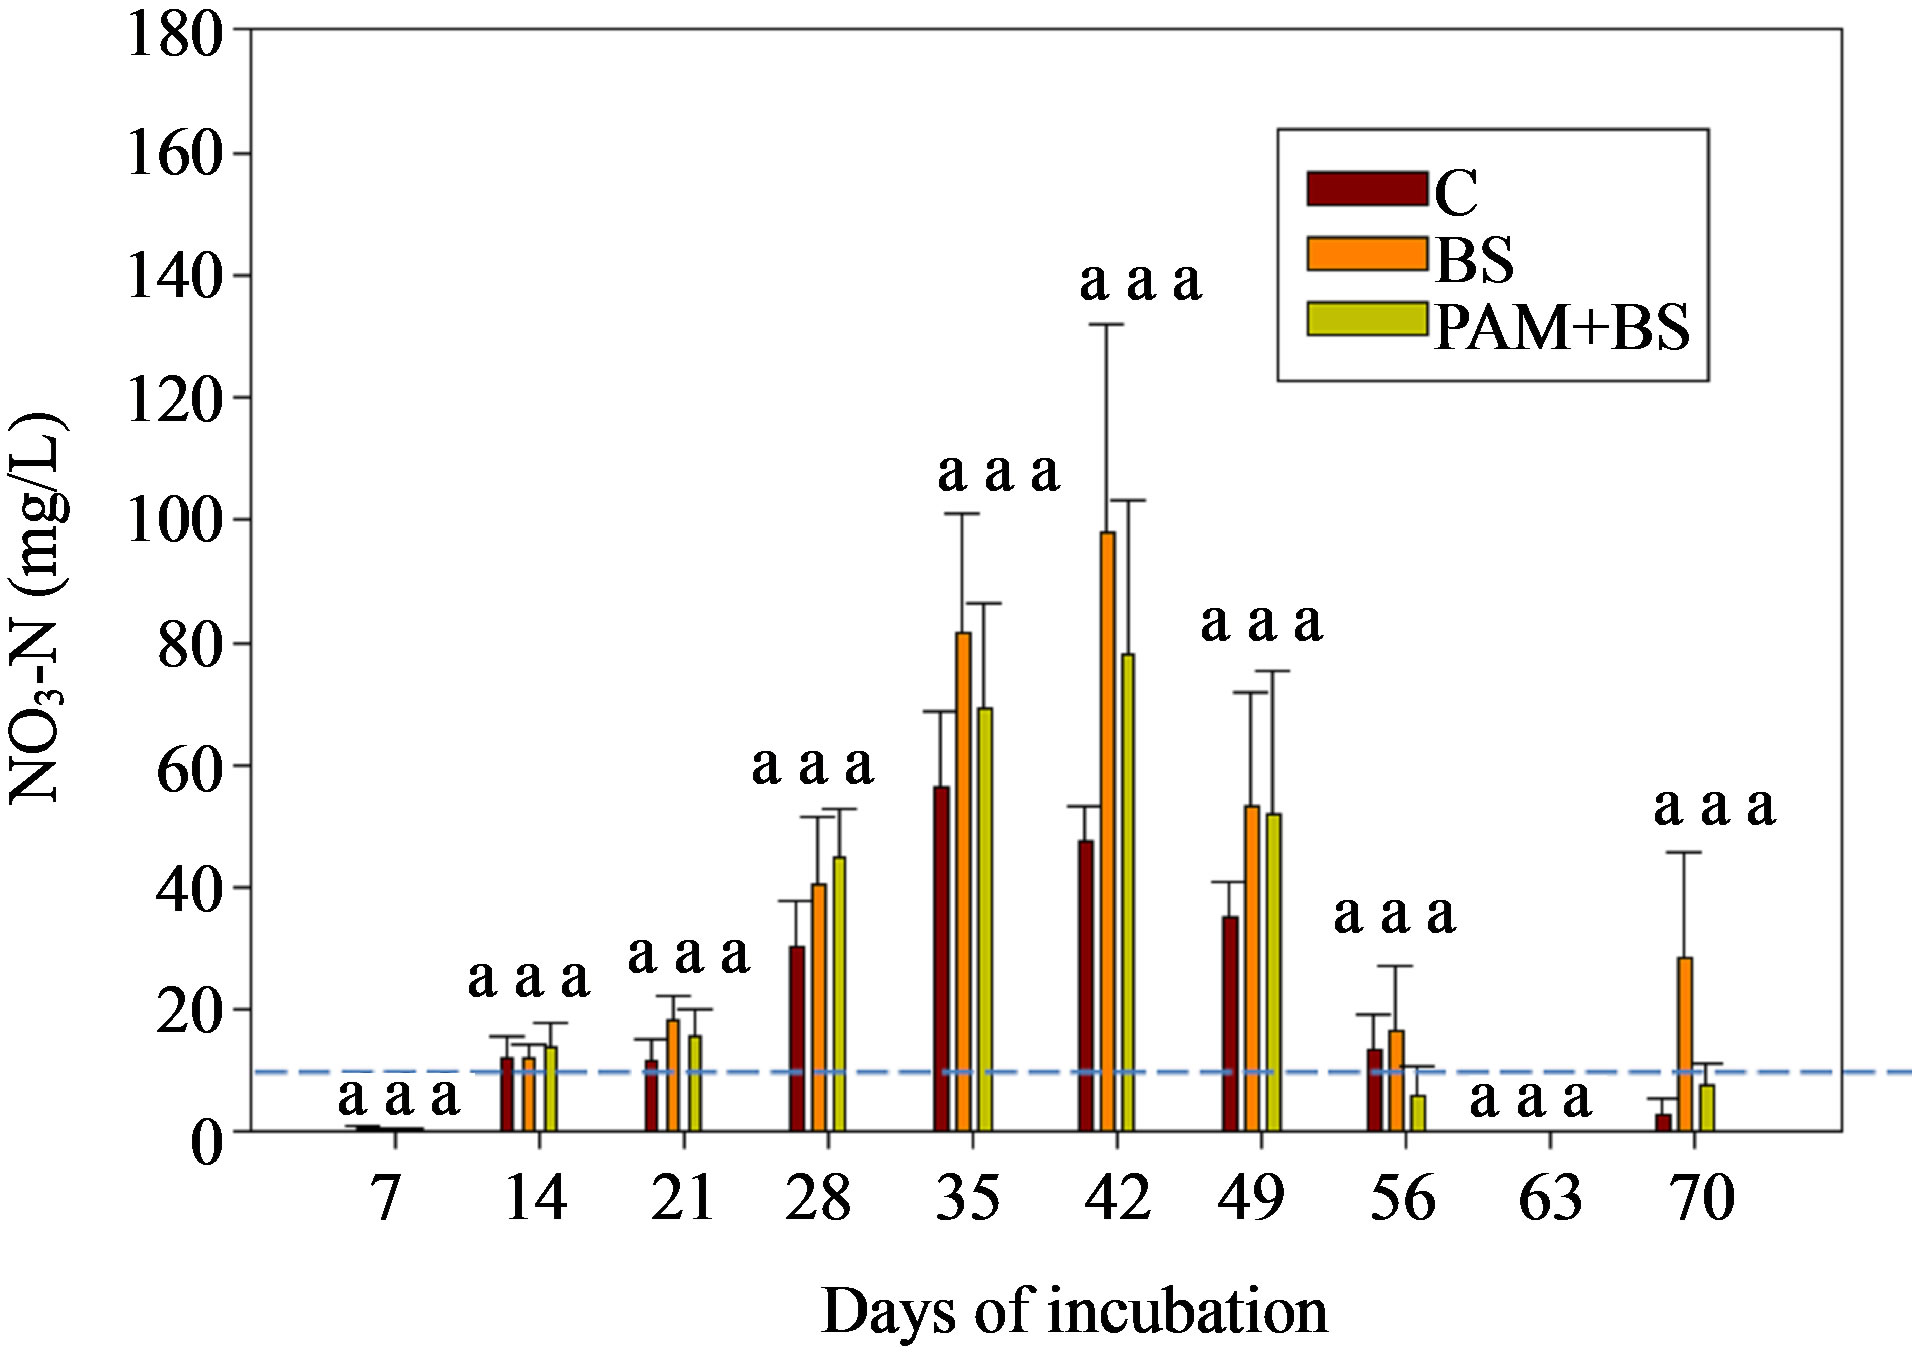
Figure 6. NO3-N concentration in the leachate for GH columns in the second round of experiments. The dashed horizontal line indicates the USEPA targeted NO3-N concentration (10 mg/L). The treatment means with the same letter within a particular day are not significantly different.
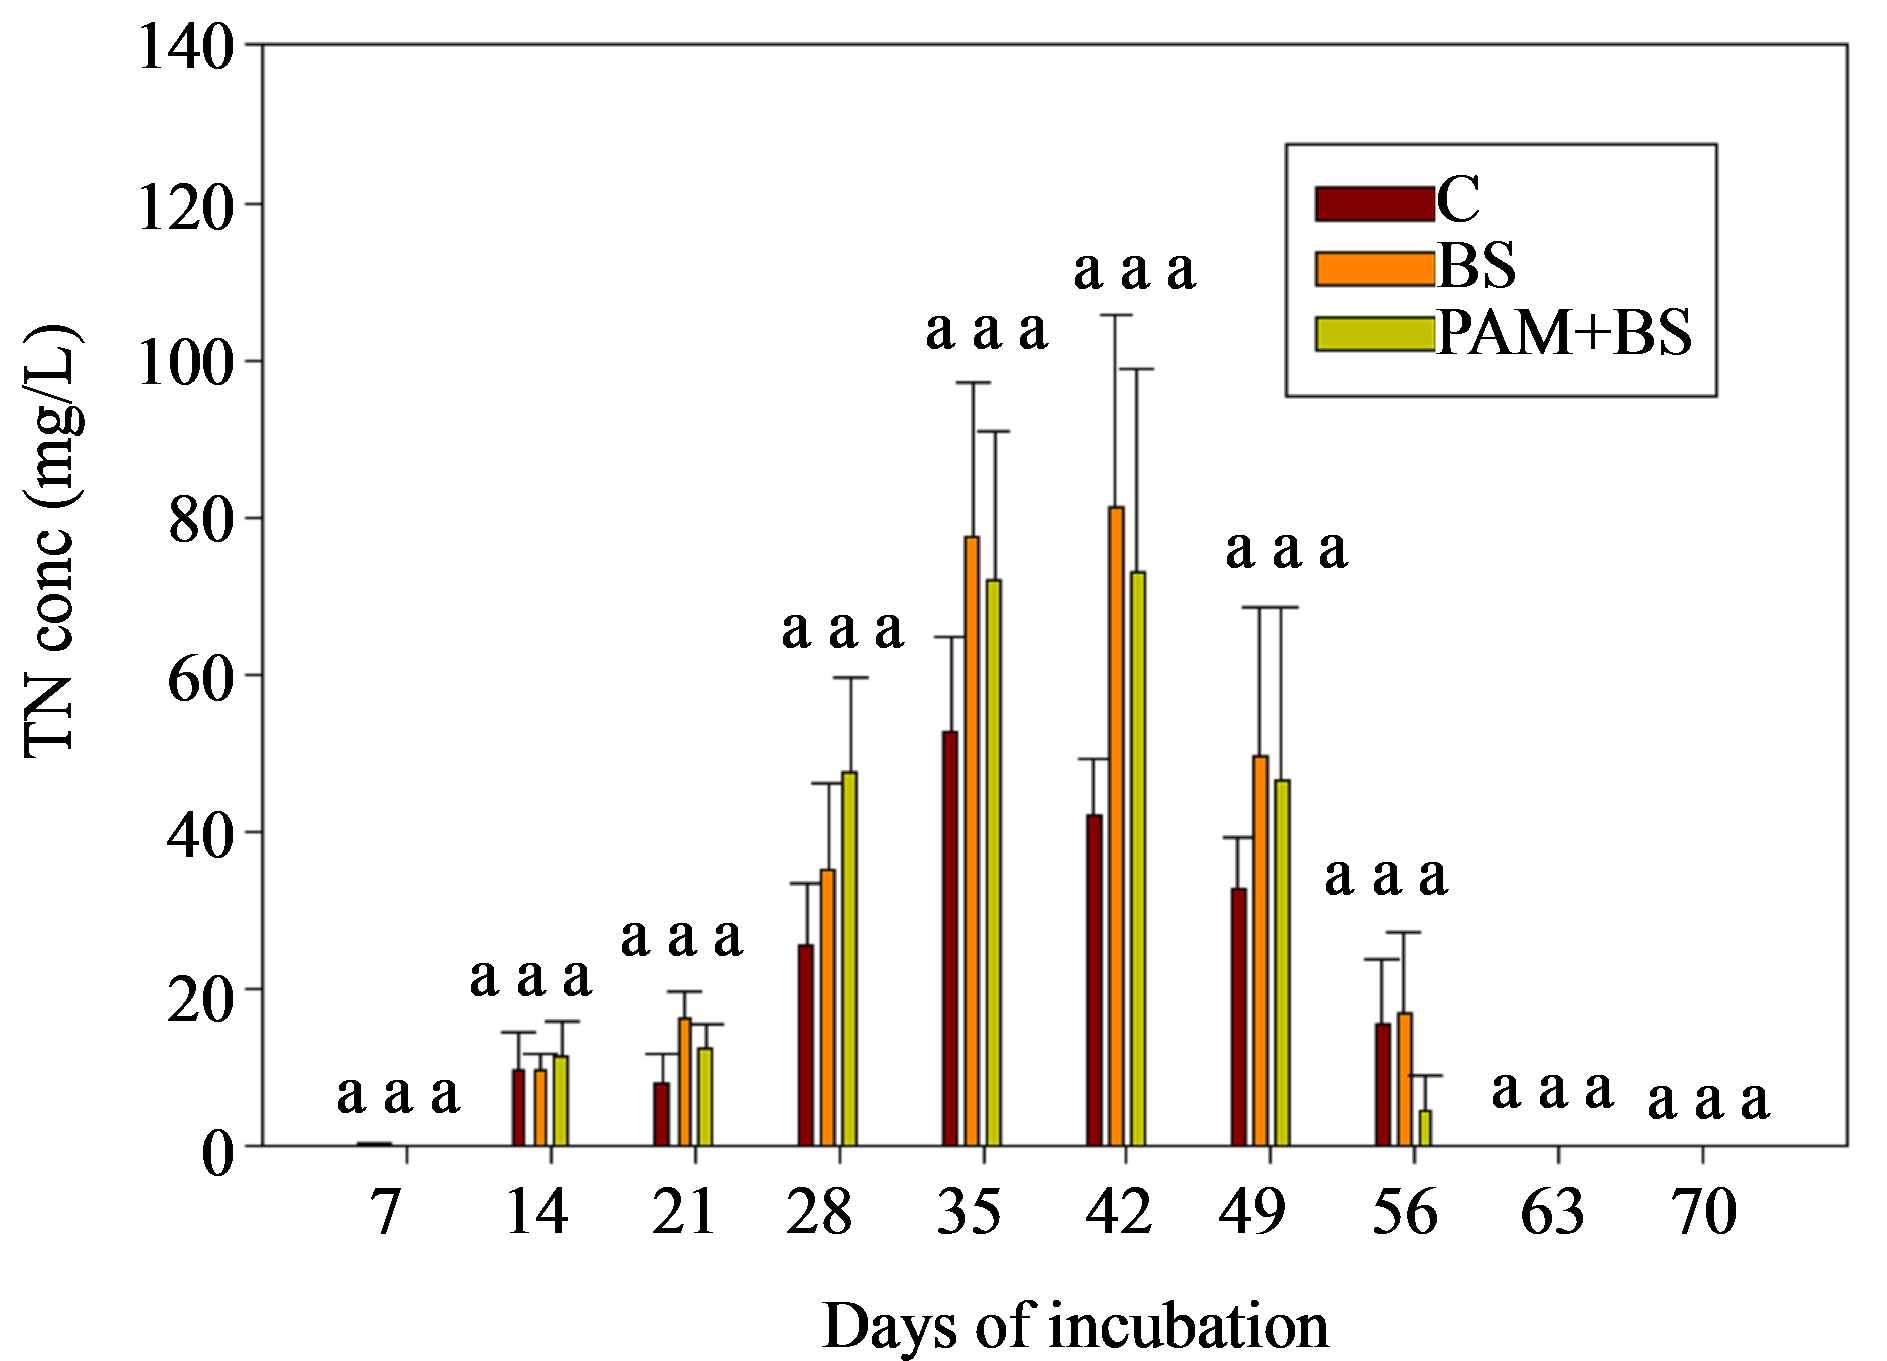
Figure 7. Total Nitrogen concentration in the leachate for the GH columns in the second round of experiments. The treatment means with the same letter within a particular day are not significantly different.
ments compared in this study. The PAM + BS treatment did not yield more leachate volume compared to the C and BS treatments despite the potential for improved aggregate stability by the polymer [25,26]. Alleoni et al. [27] and Mailapalli and Thompson [21] observed similar leachate trends in their rainfall studies using soils amended with biosolid. Therefore, the effect of the single PAM application on improving aggregate stability may be limited to shallow depths [28]. The percentage leachate varied temporally during the incubation period for all treatments likely due to daily evaporation (in GC columns) and evapotranspiration (in GH columns) which varies with Ryegrass growth stage.
The Nitrogen applied through BS or initially available in the soil is converted to NH4-N through mineralization by bacteria living in the soil (not measured). Since the biosolid was applied on the soil surface (in the first round) or mixed with the top 0.5 cm depth (in the second round), volatilization of ammonium into the atmosphere as ammonia gas is possible [3]. For example, in the case of Urea, ammonium loss through volatilization may be as great as 46% [29]. Hence, the NH4-N concentration in the leachate was not significantly different among the treatments. The decrease in NH4-N over time (Figures 2 and 5) was generally accompanied by an increase in NO3-N, (Figures 3 and 6) indicating that the NH4-N released from organic materials mineralization was nitrified into NO3-N [15]. However, the NH4-N decrease did not increase the NO3-N concentration after 28 days of incubation; this may be due to plant or microbial uptake of NO3-N in GH columns or microbial uptake in GC columns or less mineralized NH4-N may be available for nitrification. The GC columns resulted in nearly constant NO3-N concentrations for BS and PAM + BS treatments as there was no uptake (no crop was grown) of NO3-N from plants. In the case of the GH columns, the NO3-N concentration in the leachate varied with crop growing period as some of the NO3-N was utilized by the Ryegrass. The Ryegrass consumption of NH4-N and NO3-N was reflected in the lower TN concentration in the leachate compared to that for GC columns (Figure 4). Furthermore, the NH4-N concentration was always lower than the NO3-N concentrations in the leachate for all columns. The negative charge on clay particles retains positively charged NH4-N ions and prevents them from leaching. Nitrate ions are negatively charged and are not retained by negatively charged clay particles, thus leading to higher NO3-N concentrations in the leachate.
The three fold increase in biosolid application rate may have increased NH4-N in the soil through mineralization. However, the leachate NH4-N concentration did not increase compared to the first round (Figures 2(b) and 5) likely due to ammonium-clay binding as explained above. Additional ammonium in the soil in the second round may have led to the higher NO3-N concentrations. Furthermore, the nitrification process in the second round could have been enhanced as the columns were covered with black polythene sheet, which possibly increased the column temperature. The soil pH for the second round was 6.7, which is close to optimum pH (=7) for nitrification to occur, whereas the soil pH was 5.6 in the first round. The greater NO3-N concentration in the second round GH columns also led to greater concentrations of TN (Figure 6).
5. Conclusion
The leachate soil column studies indicated that biosolid application (with and without PAM) to soil seeded with Ryegrass did not increase nitrogen concentrations in leachate when compared to a bare soil control. Three times higher biosolid application rate resulted in an average of 2.5 to 2.7 times higher Nitrate concentration in the leachate. Too much biosolid application to soil may not be recommended due to other economic and environmental consequences. Further studies are suggested to determine optimum rates of biosolid application based on agronomic requirements to minimize nitrogen loss in leachate. A one-time application of polymer coated biosolid has the potential to provide nutrients to both urban and agricultural crops and to also control sediment and nutrient transport into surface waters without increasing N load to groundwater. The nitrogen leachate from the bare soil control columns was higher than the USEPA targeted levels (NH4-N: 0.1 mg/L; NO3-N: 10 mg/L), indicating that nitrogen leaching in excess of this target level was not solely due to the biosolid or polymer application. In the absence of crop growth there is the potential for increased nitrogen leaching with biosolid application. The results of this study indicate that a single application of biosolid (with or without polymer coating) may be applied to cropped/grassed silt loam surfaces at the rates considered without increasing N-loads to groundwater.
6. Acknowledgements
We thank Zachariah Zopp for assistance in the chemical analysis of leachate samples and Lynn Hummel and Deena Paterson of Walnut Street Greenhouse, UW-Madison for their able assistance in conducting the experiments.
REFERENCES
- J. Vogel, “Biosolids: A Low-Cost Fertilizer Option,” American Agriculturist, 2006.
- M. Selveira, “Utilization of Biosolids for Pasture Fertilization,” Florida Beef Cattle Proceedings (IFAS-2008), 2008, pp. 81-83. http://animal.ifas.ufl.edu/extension/beef/shortcourse/2008/Silveira.pdf
- D. M. Sullivan, C. G. Cogger and A. I. Bary, “Fertilizing with Biosolids,” PNW 508-E, Pacific Northwest Extension Publications, Oregon State University, Corvallis, 2007. http://extension.oregonstate.edu/catalog/pdf/pnw/pnw508-e.pdf
- NRC (National Research Council), “Biosolids Applied to Land: Advancing Standards and Practices,” National Academy Press, Washington DC, 2002.
- I. L. Pepper, J. P. Brooks and C. P. Gerbra, “Pathogens in Biosolids,” Advances in Agronomy, Vol. 90, 2006, pp. 1- 40.
- S. R. Jenkins, C. W. Armstrong and M. M. Monti, “Health Effects of Biosolids Applied to Land: Available scientific Evidence,” 2007. http://www.vdh.state.va.us/epidemiology/DEE/documents/Biosolidsfinal.pdf
- H. Wang, M. O. Kimberley, G. N. Magesan, R. B. McKinley, J. R. Lee, J. M. Lavery, P. D. F. Hodgkins, T. W. Payn, P. J. Wilks, C. R. Fisher and D. L. McConchie, “Mid-Rotation Effects of Biosolids Application on Tree Growth and Wood Properties in a Pinus Radiate Plantation,” Canadian Journal for Research, Vol. 36, No. 8, 2006, pp. 1921-1930. doi:10.1139/x06-084
- E. Z. Harrison and S. R. Oakes, “Investigation of Alleged Health Incidents Associated with Land Application of Sewage Sludges,” New Solutions, Vol. 12, No. 4, 2002, pp. 387-408. doi:10.2190/0FJ0-T6HJ-08EM-HWW8
- US Environmental Protection Agency, “Office of Research and Development Problem, Formulation for Human Health Risk Assessments of Pathogens in Land-Applied Biosolids,” 2011. http://oaspub.epa.gov/eims/eimscomm.getfile?p_download_id=501204
- US Environmental Protection Agency (USEPA), “Office of Inspector General Status Report,” Land Application of Biosolids, 2002.
- H. Wang, G. N. Magesan, A. H. Slade, M. Quintern, P. W. Clinton and T. W. Payn, “Technological Options for the Management of Biosolids,” Environmental Science and Pollution Research, Vol. 15, No. 4, 2008, pp. 308-317. doi:10.1007/s11356-008-0012-5
- US Environmental Protection Agency (USEPA), “Regulatory Impact Analysis of the Part 503 Sewage Sludge Regulation,” PB93-110625, 1993.
- S. R. Smith, “Agricultural Recycling of Sewage Sludge and the Environment,” CAB International, Wallingford, 1996.
- G. C. Sigua, M. Adjei and J. Rechcigl, “Cumulative and Residual Effects of Repeated Sewage Sludge Applications—Forage Productivity and Soil Quality Implications in South Florida,” USA Environmental Science and Pollution Research International, Vol. 12, No. 2, 2005, pp. 80-88. doi:10.1065/espr2004.10.220
- Z. L. He, A. Alva, D. Calvert, Y. Li, P. Stoffella and D. Banks, “Nitrogen Mineralization and Transformation from Composts and Biosolids during Field Incubation in a Sandy Soil,” Soil Science, Vol. 165, No. 2, 2000, pp. 161-169. doi:10.1097/00010694-200002000-00007
- R. Chaney, “Twenty Years of Land Application Research,” BioCycle, September 1990, pp. 54-65.
- J. T. Gilmour, C. G. Cogger, L. W. Jacobs, S. A. Wilson, G. K. Evanylo and D. M. Sullivan, “Estimating PlantAvailable Nitrogen in Biosolids,” Project Rep. 97-REM-3, Water Environment Research Foundation, Alexandria, 2000.
- M. R. Stevens, T. J. B. Yager, D. B. Smith and J. G. Crock, “Biosolids, Soils, Ground-Water, and StreambedSediment Data for a Biosolids Application Area Near Deer Trail, Colorado, 1999, Denver, CO,” US Geological Survey, Openfile Report 02-51, 2003.
- G. Estes and J. Zhao, “Release of Nitrate-Nitrogen and Heavy Metals from Land-Applied Biosolids in Northern Areas: Durham, NH,” New Hampshire Water Resources Research Center, 1996.
- A. Shober, R. Stehouwer and K. McNeal, “Agricultural Utilization of Biosolids in Pennsylvania,” Assessment of Biosolids Effects on Soil and Crop Quality, Pennsylvania Department of Environmental Protection, 2002.
- D. R. Mailapalli and A. M. Thompson, “Sediment and Phosphorus Loads in Runoff and Leachate Using Polyacrylamide Coated MilorganiteTM and Gypsum,” Agricultural Water Management, Vol. 101, No. 1, 2011, pp. 27-34. doi:10.1016/j.agwat.2011.08.021
- A. M. Falatah, “Phosphate Extractability and Mobility in Leached Soil Columns as Affected by Polymer Amendments,” Arid Land Research and Management, Vol. 12, No. 4, 1998, pp. 335-343.
- F. Madrid, R. Lopex, F. Cabrera and J. M. Murillo, “Nitrogen mineralization for Assessing the Correct Agricultural Use of M.S.W. Compost,” Orbit Journal, Vol. 1, 2001, pp. 1-10.
- P. Burgos, E. Madejon and F. Cabrera, “Nitrogen Mineralization and Nitrate Leaching of a Sandy Soil Amended with Different Organic Wastes,” Waste Management Research, Vol. 24, No. 2, 2006, pp. 175-182. doi:10.1177/0734242X06062876
- A. K. Bhardwaj, I. Shainberg, D. Goldstein, D. N. Warrington and G. L. Levy, “Water Retention and Hydraulic Conductivity of Cross-Linked Polyacrylamides in Sandy Soils,” Soil Science Society America Journal, Vol. 71, No. 2, 2007, pp. 406-412. doi:10.2136/sssaj2006.0138
- A. Hüttermann, L. J. B. Orikiriza and H. Agaba, “Application of Superabsorbent Polymers for Improving the Ecological Chemistry of Degraded or Polluted Lands,” CleanSoil, Air, Water, Vol. 37, No. 7, 2009, pp. 517-526. doi:10.1002/clen.200900048
- L. R. F. Alleoni, S. R. Brinton and G. A. O’Connor, “Runoff and Leachate Losses of Phosphorus in a Sandy Spodosol Amended with Biosolids,” Journal of Environmental Quality, Vol. 37, No. 1, 2008, pp. 259-265. doi:10.2134/jeq2006.0302
- N. Al-Abed and J. Amayreh, “Polyacrylamide Polymer (PAM) Effect on the Propagation of the Wetting Front on a Jordanian Soil under Trickle Irrigation System,” Archives of Agronomy and Soil Science, Vol. 49, No. 3, 2003, pp. 289-299. doi:10.1080/0365034031000148309
- T. J. van der Weerden and S. C. Jarvis, “Ammonia Volatilization Factors for N Fertilizers Applied to Two Contrasting Grassland Soils,” Environmental Pollution, Vol. 95, No. 2, 1997, pp. 205-211. doi:10.1016/S0269-7491(96)00099-1
NOTES
*Corresponding author.