Journal of Water Resource and Protection
Vol. 3 No. 6 (2011) , Article ID: 5649 , 17 pages DOI:10.4236/jwarp.2011.36050
Application of Index Analysis to Evaluate the Water Quality of the Tuul River in Mongolia
1Department of Geo-ecology and Environmental Study, School of Earth Sciences, National University of Mongolia, Ulaanbaatar, Mongolia
2Water Research Sector, Institute of Meteorology and Hydrology, Ulaanbaatar, Mongolia
E-mail: altansukh@num.edu.mn
Received April 9, 2011; revised May 11, 2011; accepted June 11, 2011
Keywords: Tuul River, water quality assessment, pollution point source, water quality map, water quality index
ABSTRACT
A study of water pollution determinands of the Tuul River was carried out in surrounding area of Ulaanbaatar, the capital of Mongolia at 14 monitoring sites, using an extensive dataset between 1998 and 2008. An index method, developed by Ministry of Nature and Environment of Mongolia, applied for assessment and total, seven hydro-chemicals used in the index calculation. The research indicates that the Tuul River is not polluted until the Ulaanbaatar city and the contamination level spike appears when the river entering the city. The upper reaches of the river and tributaries have relatively good quality waters. Several pollution sources exist in the study area. Among them, the Central Wastewater Treatment Plant (CWTP) is a strongest point source in the downstream section of the river, recently. Pollutions at sites 7 - 10 are strongly dependant effluent treatment levels from the plant, and it contains a high amount of chemicals that can cause of major decrement of the water quality. This would definitely kill aquatic fauna in the stretch of the river affected. It certainly happened in 2007. The general trend of water quality gradually has been decreased in the study period. Clearly, there is a need to improve the water quality in the Tuul River in surrounding area of the Ulaanbaatar. In order to change this situation, operation enhancement of treatment plants, a water quality modeling and artificial increment of dissolved oxygen concentrations become crucial to improve the water quality significantly. Perhaps a new wastewater treatment plant is needed for Ulaanbaatar city.
1. Introduction
Unpolluted waters in rivers are a vital natural resource, providing drinking and irrigation water for humans, livestock and agriculture. However, water quality in many large river waters has deteriorated significantly world wide due to anthropogenic activities in the past two-three decades [1]. It is also widely accepted that discharges from sewage treatment plants provide major fluxes of P and N to rivers, predominantly in populated urban areas [2,3]. Nutrient enrichment can result in excessive growth of aquatic plants and reductions in dissolved oxygen [4,5].
Rising pollution levels and the increasing demand for water and the associated increased discharges of pollutants are having significant impacts on the water cycle and water quality [6,7]. Climate change is also starting to have some effects with increasing temperatures and changed rainfall patterns. The increasing air temperatures and decreasing river flows in warmer months are the main concerns, and intensive water use is often constrained by the lack of natural low flow, and low flow rivers are more affected by effluent discharges from cities, industries, and agriculture [8,9]. Surface waters in Mongolia have tended to decrease in recent years due to the combined effect caused by the decrease of precipitation and the increase of potential evaporation as a result of rising air temperature. This situation indicates that droughts may occur more frequently due to the effects of global warming [10].
The use of water quality index (WQI) simplifies the presentation of results of an investigation related to a water body as it summarises in one value or concept a series of parameters analysed. In this way, the indices are very useful to transmit information concerning water quality to the public in general, and give a good idea of the evolution tendency of water quality to evolve over a period of time [11]. A single WQI value makes information more easily and rapidly understood than a long list of numerical values for a large variety of parameters. Additionally, WQI also facilitates comparison between different sampling sites and events [12].
Over the last decade, rapid urbanization and increased industry have had significant impacts on the water quality and chemical composition of rivers in the surrounding area of Ulaanbaatar city [13]. Air and soil pollution as well as accumulated wastes in the catchment area, are being transferred by surface runoff and flood events into the local river systems and having a significant impact on the river water quality. Major causes of the water pollutants are mining industries in the lower basin of the Tuul River. More than 180 licensed mining companies are operating in 145 km2 areas of the basin [14]. Water demand of the city had increased by 20% from 1998 to 2005. Population growth, urbanization and intensity of industries have created water exploitation, deterioration of natural water regime and ecological degradation of the Tuul River basin [15]. The treatment efficiency of the CWTP as well as other Wastewater Treatment Plants (WTP) in the region is often inadequate due to technical and financial problems. Efficiency of the CWTP was 71% in 2002. This value dropped to 66% in 2003. The plant was not operated in May 2003 and April 2004 [16].
For that reason, this study has carried out a spatiotemporal water quality research of the Tuul River in surrounding area of Ulaanbaatar city, Mongolia using WQI in order to assess the recent state of water quality and sources of pollution. This paper presents the comprehensive analysis of chemical data of water quality in the Tuul River and identifies spatio-temporal patterns in water quality from 1998 to 2008. The aims of this research are 1) to assess spatio-temporal variability of water quality in the Tuul River and its tributaries; 2) to evaluate the overall state of water quality, and 3) to produce time series of water quality maps of the river using surface water quality index (SWQI) in surrounding area of the city.
2. Study Area, Data and Method
2.1. Study Area
The study was carried out in surrounding area of Ulaanbaatar, the capital of Mongolia. The Tuul River, flowing through the heart of the city, is an environmentally, economically and socially significant natural resource. The study area covered the Tuul River and its two tributaries, namely Uliastai, Selbe Rivers and discharge from CWTP. List of sampling points and their geographical locations are shown in Table 1 and Figure 1(b).
The point sources of pollution in the Tuul River are poorly treated wastewater treatment plants at Nalaikh (1400 m3/day), Nisekh (400 m3/day), CWTP (190000
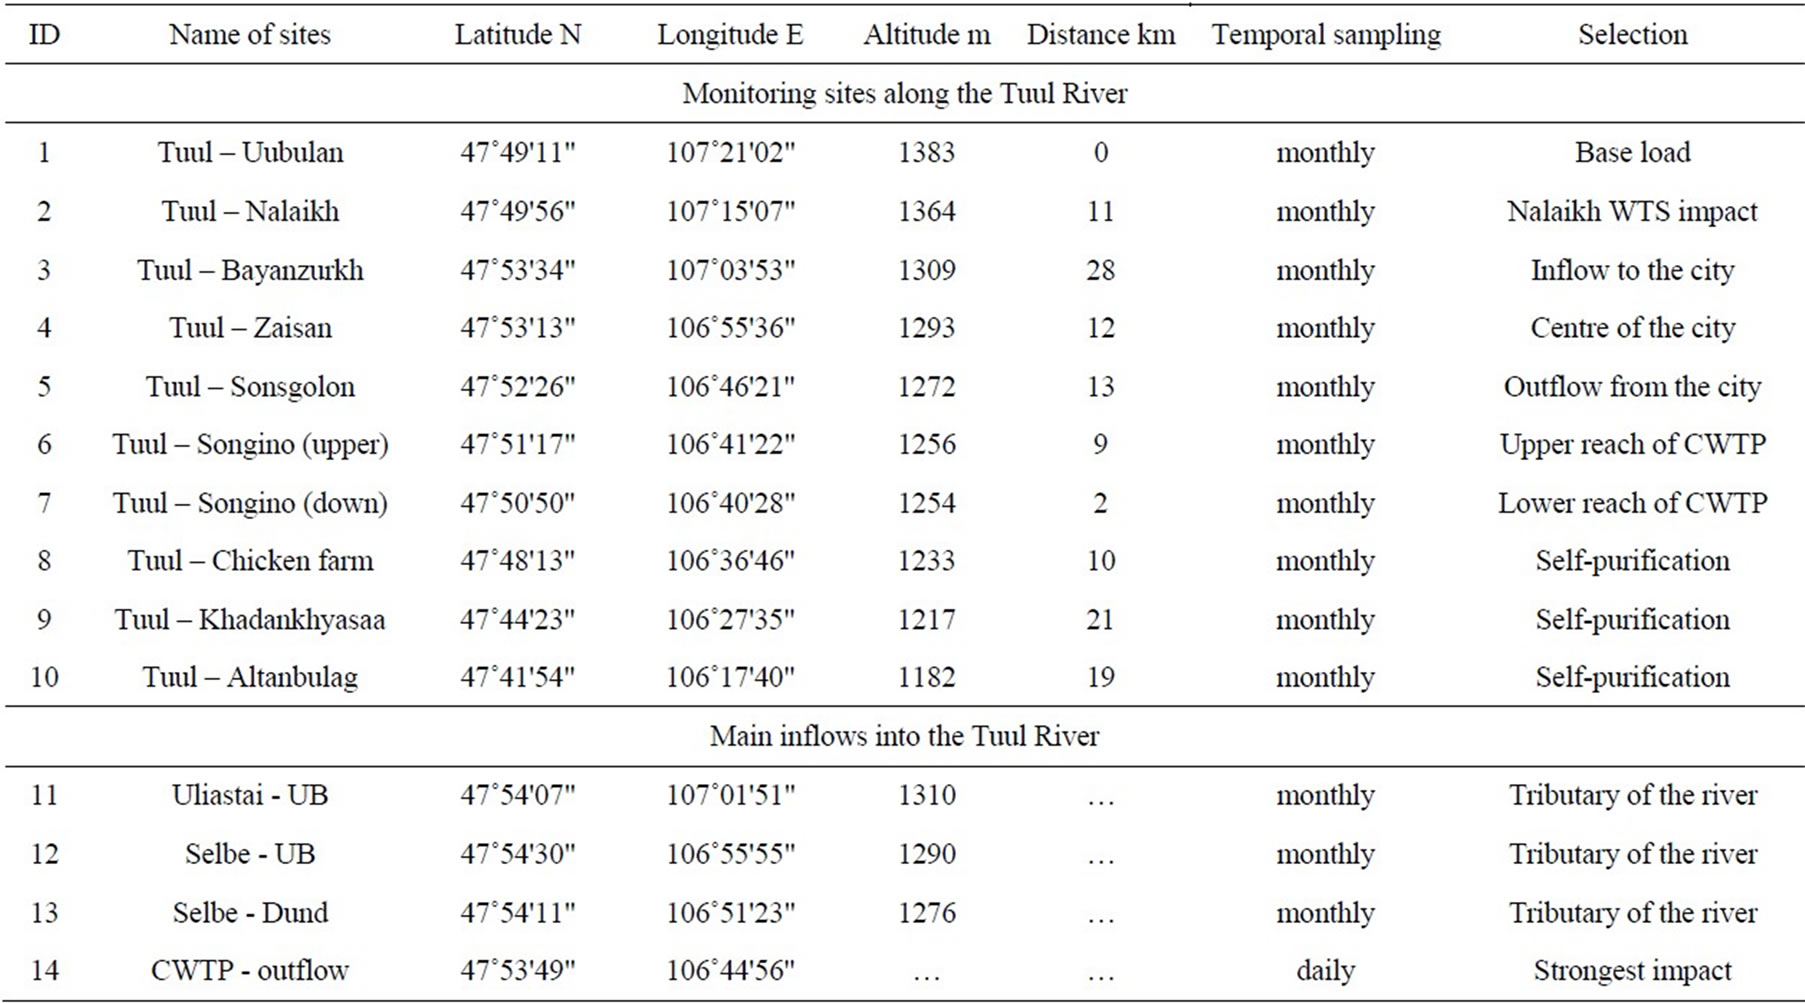
Table 1. Spatial and temporal information of water quality sampling.
 (a)
(a)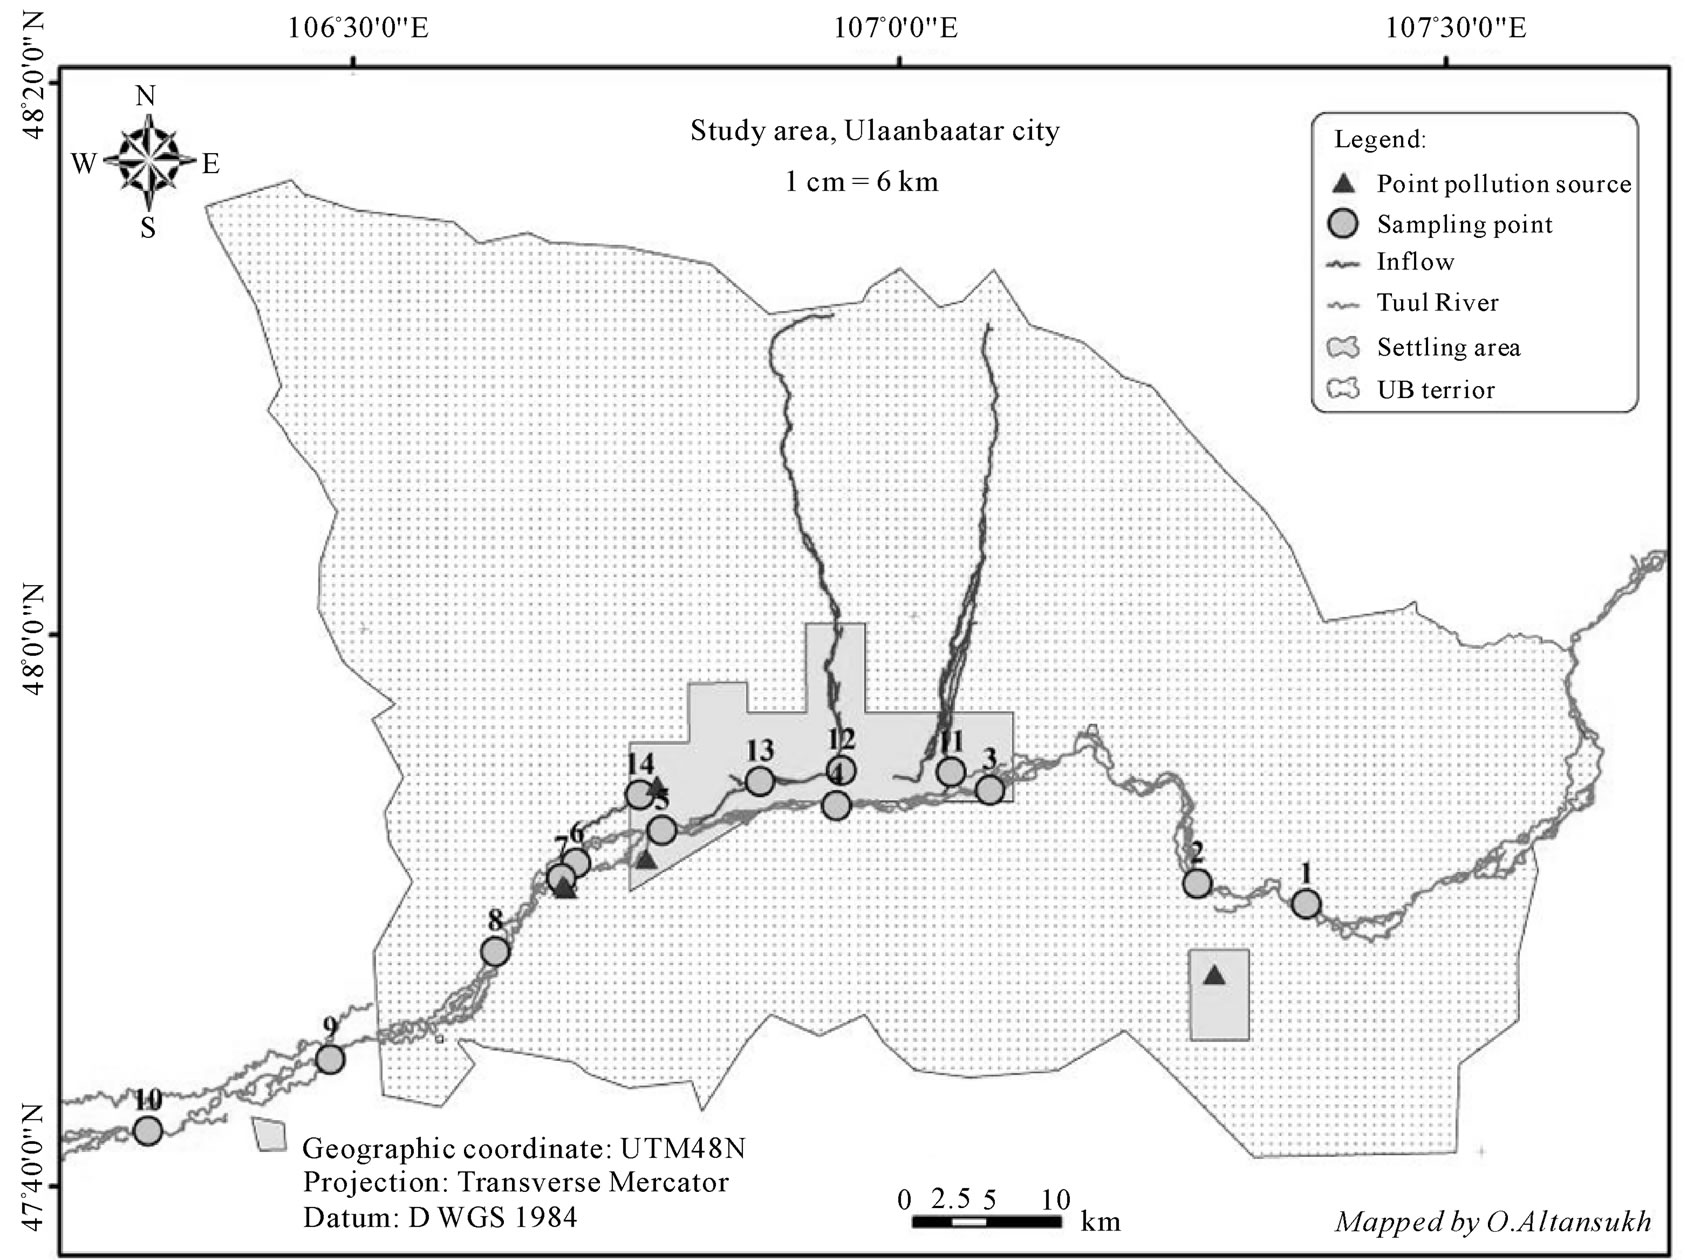 (b)
(b)
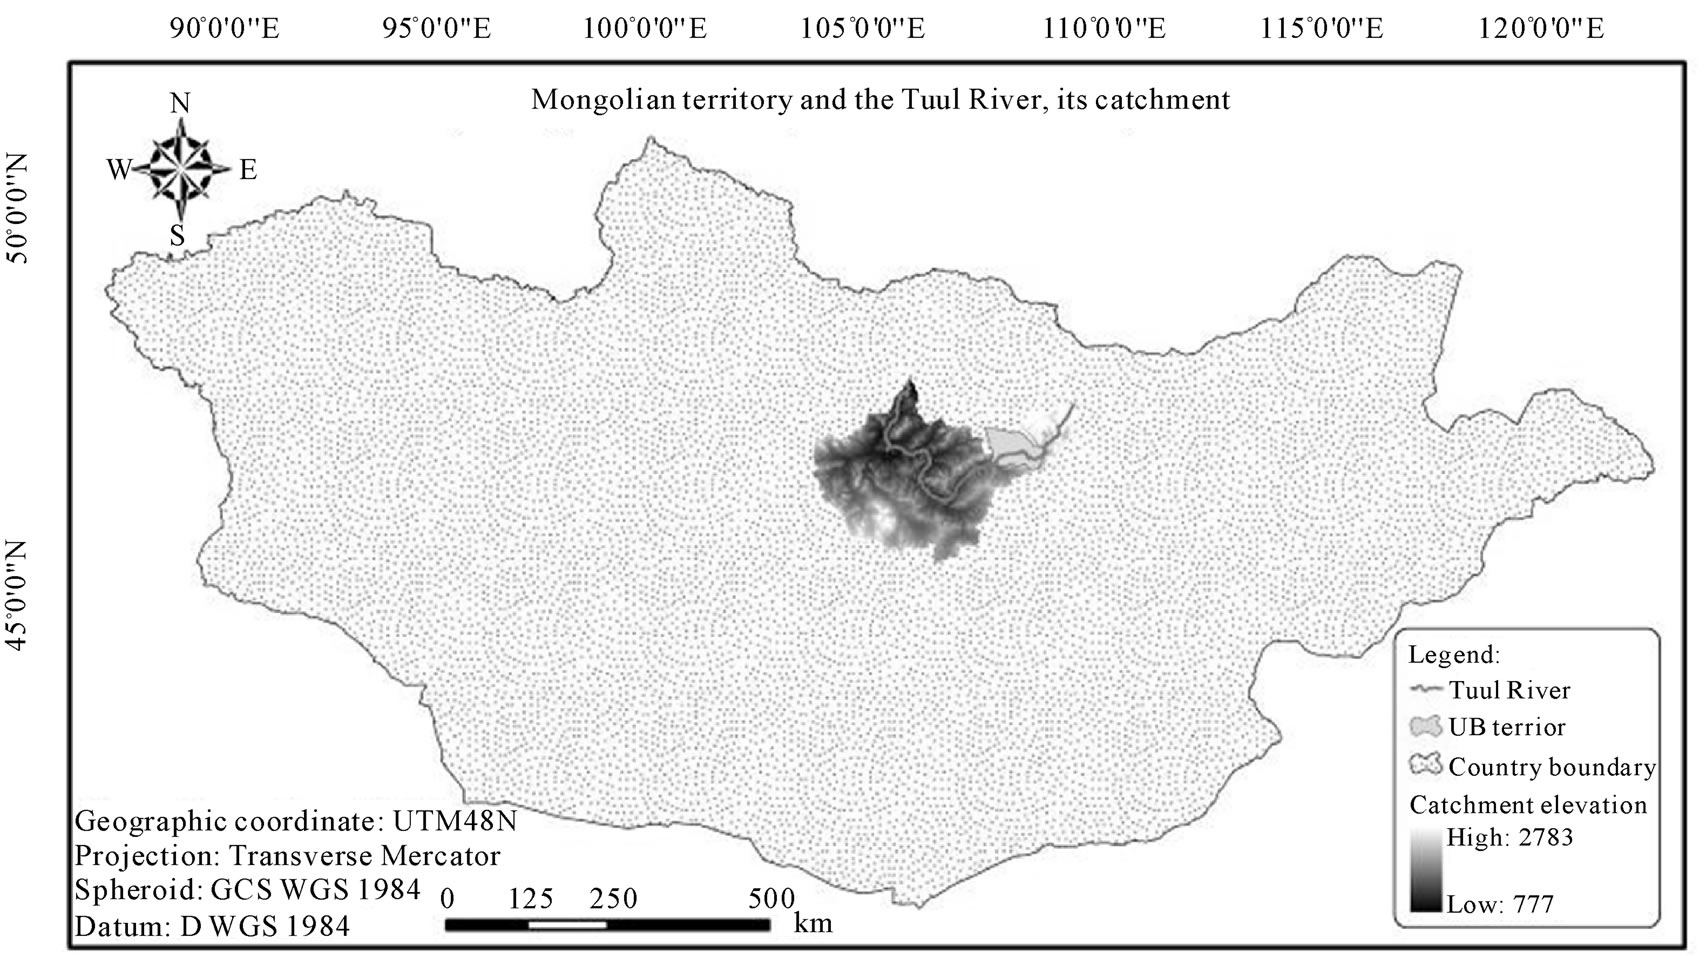
Figure 1. Maps of (a) Mongolian territory and the catchment area, and (b) The study area, Ulaanbaatar.
m3/day), Bio-industry (490 m3/day) and Bio-Songino (600 m3/day). The biggest point source is CWTP, which is located in the western edge of Ulaanbaatar [17].
As shown in Figure 1(b), there are five point sources of pollution (some may overlap in the figure) marked by triangles and 14 dots indicated the water quality monitoring sites. Pink lines represented the inflows into the main river, a blue line shown the Tuul River and polygon features symbolized territory of the city and settling areas, respectively.
The river pertains to 6th order of the Strahler river classification system. In the territory of Ulaanbaatar city, there are about 50 streams and rivers. Three of them, named Selbe, Uliastai and Tuul, flow through the central part of the capital [18]. Annual runoff of the Tuul River consists of three components namely rainfall (69%), groundwater flow (26%) and snow melt (5%) based on an analysis by G. Davaa [19]. The average channel width of the river is 35 to 75 m, the depth is 0.8 - 3.5 m and the velocity is 0.5 - 1.5 m/s during a low flow period. The long-term annual mean flow of the river is approximately 26.6 m3/s. The observed maximum discharge has reached 1580 m3/s and during the low flow period of the warm season, the recorded minimum flow has fallen to 1.86 m3/s at the Ulaanbaatar station [20].
Characteristics of the catchment area have been estimated by digital elevation model based on hydro-processing using Shuttle Radar Topography Mission data with 90 m resolution. The Tuul River catchment is one of twenty-nine basins in Mongolia (Figure 1(a)). It is situated in central part of the country and bounded by 108˚18'E - 48˚30'N, 105˚22'E - 46˚22'N, 102˚47'E - 47˚50'N and 104˚47'E - 48˚56'N, roughly. The catchment area is 57560.4 km2, which covers 3.67% of the entire territory of Mongolia. The perimeter of the catchment area is 1998.5 km, and the drainage density is 103.63 m km2. The length of the Tuul River is 826.4 km and the elevations of riverhead and the river outlet are 2272.0 m and 776.0 m, respectively. Therefore, the river slope is 1.81 m/km and flows from the northeast to north. The headwaters of the river and most of the tributaries originate in the mountainous area that forms northeast part of the catchment.
The Tuul River basin has the continental climatic features that are characterized by wide variation of annual, monthly and daily temperatures; low range of air humidity; non-uniform distribution of precipitation; cold and long-lasting winter and warm summer. The rainy period continues from June to August in the upper Tuul River basin, of which rainfall shares about 74% of the annual precipitation [21]. The annual average air temperature is −1.2˚C in the study area. Annual minimum temperature reaches −39.6˚C in January, while maximum temperature reaches +34.5˚C during summer period [19].
The Tuul River quality is naturally clean and rich in calcium bicarbonate. Total dissolved solid of the river water ranges from 100 - 210 mg/l, pH = 6.1 - 7.5 along its reaches. The river contains 28.1 mg/l mineral, and it belongs to the bicarbonate class, calcium group. The main cation is calcium, and dominant anion is bicarbonate. Moreover, cation proportion is Ca2+ > Mg2+ > (Na+ + K+) and the anion ratio is  >
>  > CI−. Naturally, anion and cation proportion as well as chemical content of the water matches with the pure water of river [20]. However, chemical contents of the river suddenly change from the western part of the city. The main factor of the chemical changes is the incompletely treated wastewater from the CWTP that is pouring into the Tuul River [22]. According to the results of a hydrological survey conducted in 2003, the hydrological regime and its runoff formation zones of the river are gradually being changed and polluted by the settlements, intensive overgrazing, timbering, wild fires and improper wastewater treatment in the river banks [19].
2.2. Sampling Sites and Chemical Dataset
Surface water quality in the surrounding area of Ulaanbaatar is being monitored at 14 points by 30 determinands in every month since 1980s. For this purpose, 10 sampling points along the Tuul River and 4 points at tributaries of the river were chosen by the Central Laboratory of Environmental Monitoring (CLEM).
The choice of the most appropriate water quality parameters is fundamental to a correct evaluation. In this case, the influence of WTP discharge in the water quality it would be appropriate to include the oxygen and nutrient parameters in the index calculation.
Thus in this study, we focused on more recent datasets from 1998-2008, total 11 years, at those 14 sites, including the chemical monitoring location of CWTP discharge for evaluation of the treatment plant effect (Figure 1(b) and Table 1). In total, 1196 samples were taken at 14 sampling points along the Tuul River and its inflows (tributaries + the CWTP discharge) and analysed by CLEM and the laboratory of CWTP. Water quality determinands presented in this paper are dissolved oxygen (DO), biological oxygen demand (BOD5), chemical oxygen demand (COD), ammonium ( -N), nitrite (
 -N), nitrate (
 -N) and phosphate (
 ), totally seven variables.
2.3. Method
The use of a WQI was initially proposed by Horton [23] and Brown [24]. Since then, many different methods of WQI have been developed. Ministry of Nature and Environment (MNE) of Mongolia has developed a WQI to simplify the complex water quality data, and it was used in this research. For surface water quality classification (SWQC), annual mean values of the quality indices were calculated from 1998-2008 datasets (Table 7). For general view of spatial data analysis, all chemical variables were averaged over the entire study period (Table 5). Using the time-series of SWQI value, trend analysis has been applied to determine whether the river water quality has increased or decreased during the time period for temporal assessment (Table 9). Furthermore, average quarterly index from 1998-2008 has been calculated in order to reveal seasonal variability (Figure 7). Interdeterminand relationships of average hydro-chemicals have been assessed using the Pearson correlation technique and the results of relationship are shown in Table 6. ArcGIS 9.3 software was used for the mapping.
The annual means of water quality datasets for the river and its inflows have been calculated by SWQI, so that the river water quality classes can be assessed (Figure 6). For the calculation of the WQI, the following equations were used. In a main equation, WQI is calculated as the sum of the different sub-index scores. The main equation is:
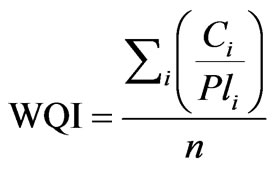 (1)
(1)
where;
WQI water quality index
Ci concentration of i variable
Pli permissible level of i variable
n number of variables
A Mongolian National Standard (MNS 4586-98), which developed by the National Standard Agency in 1998, specifies the Pli. In total, 27 variables have been included in the standard. However, the seven variables of interest in this study are shown in Table 2. DO, BOD5 and some nutrient values should include in the calculation of quality index [25].
Sub-indices of DO and BOD5 receive different weights (W) depend on concentration (Table 3) and calculate by slight different Equations [27].
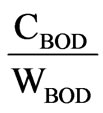 (2)
(2)
 (3)
(3)
The results of index application present quantitatively, are corresponding to a grade of 1 - 6, and qualitatively in Table 4.
According to the SWQC, surface waters with respect
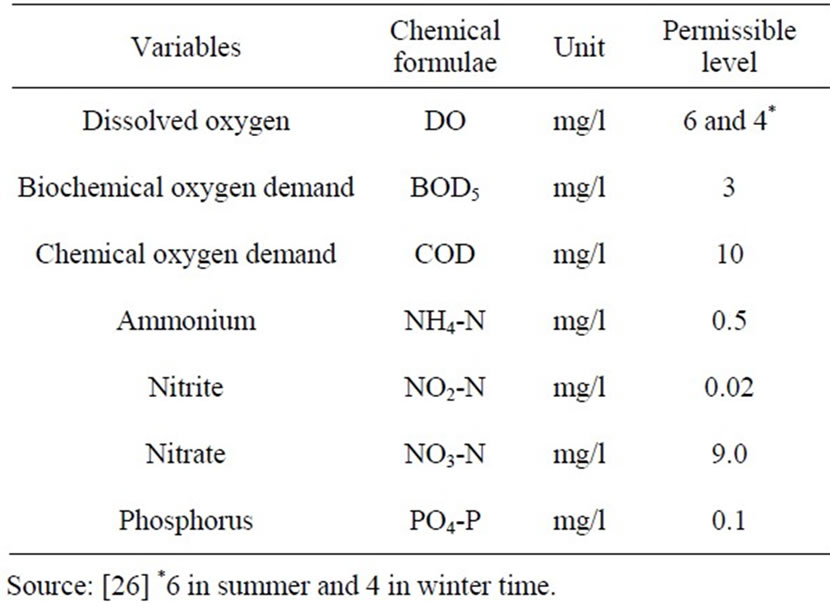
Table 2. Permissible levels of surface water variables.
to their quality are given above as six classes, namely: class 1: very clean, class 2: clean, class 3: slightly polluted; class 4: moderately polluted; class 5: heavily polluted and class 6: dirty water. Surface water usage depends on quality of the specific waters [21,28]. In Table 4, threshold values of SWQI are shown.
3. Results
3.1. Primary Data Analysis
Table 1 and Figure 1(b) show that the first 10 sampling points are on the Tuul River, and last four monitoring sites are on inflows to the river. The monitoring site 14 is excluded from calculations. A statistical summary of hydro-chemical variable concentrations from 1998-2008 is shown in Table 5. A minimum of three years data are required to calculate average values for each site.
Oxygen parameters (DO, BOD5, COD) and nutrient concentrations ( ,
, ,
, and
and ), which depend on pollution sources, are variable across the study area. DO ranges from 6.87 - 9.40 with a mean of 8.68 ± 0.81 mg/l and BOD5 values range from 1.8 - 15.8 mg/l with a mean of 4.6 ± 4.4 mg/l. The mean concentrations of nutrients across the area are different. For instance, concentration of ammonium varies from 0.11 - 6.5 mg/l with an average of 1.47 ± 2.18 mg/l and concentrations are stable up to a sampling point 7 when there is a sudden increase to 6.47 mg/l, followed by a gradual decrease along the Tuul River. The general pattern of phosphorus is similar to that of ammonium. NO2– concentrations range between 0.003 and 0.22 mg/l with an average of 0.06 ± 0.079 mg/l; nitrate and nitrite are stable up to a point 7 when after a sudden increment intensive nitrification takes place along the Tuul River.
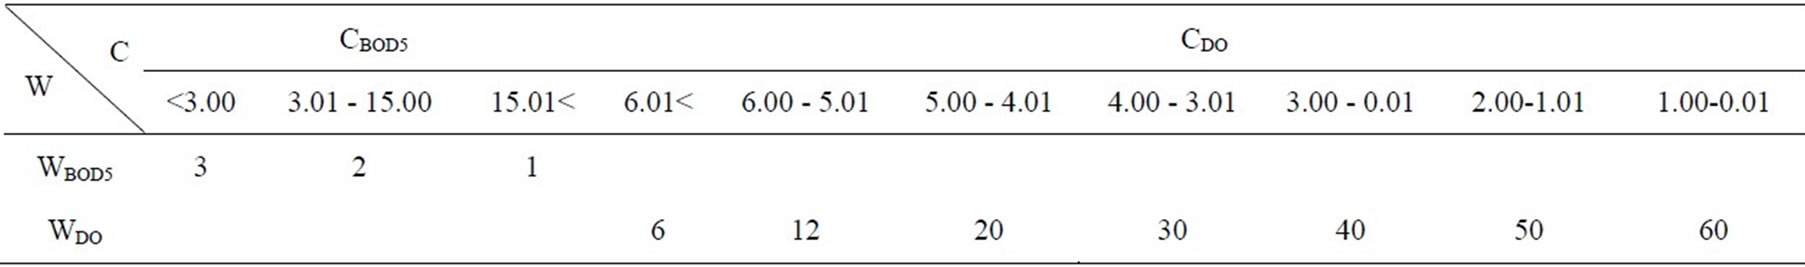
Table 3. The weights of BOD5 and DO calculations.
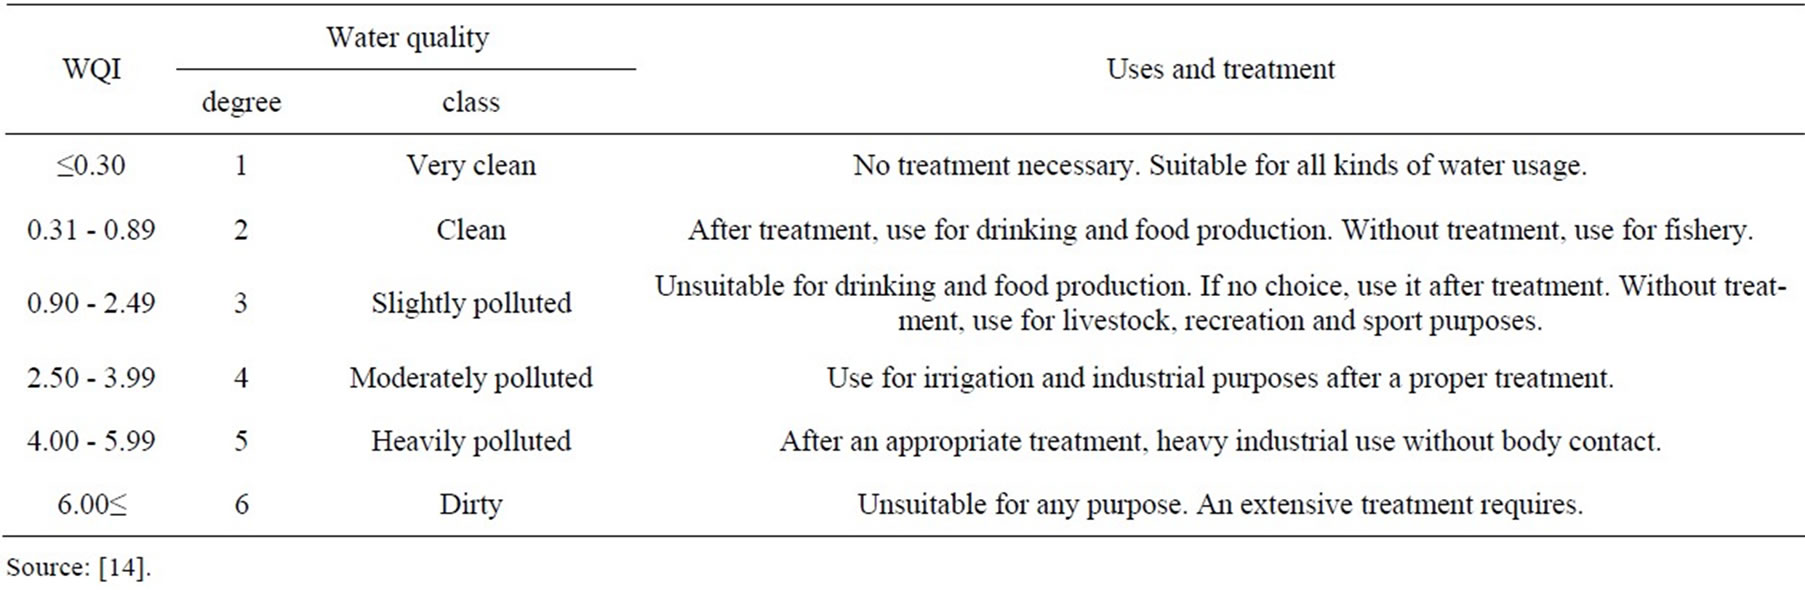
Table 4. A Mongolian classification of surface water quality.
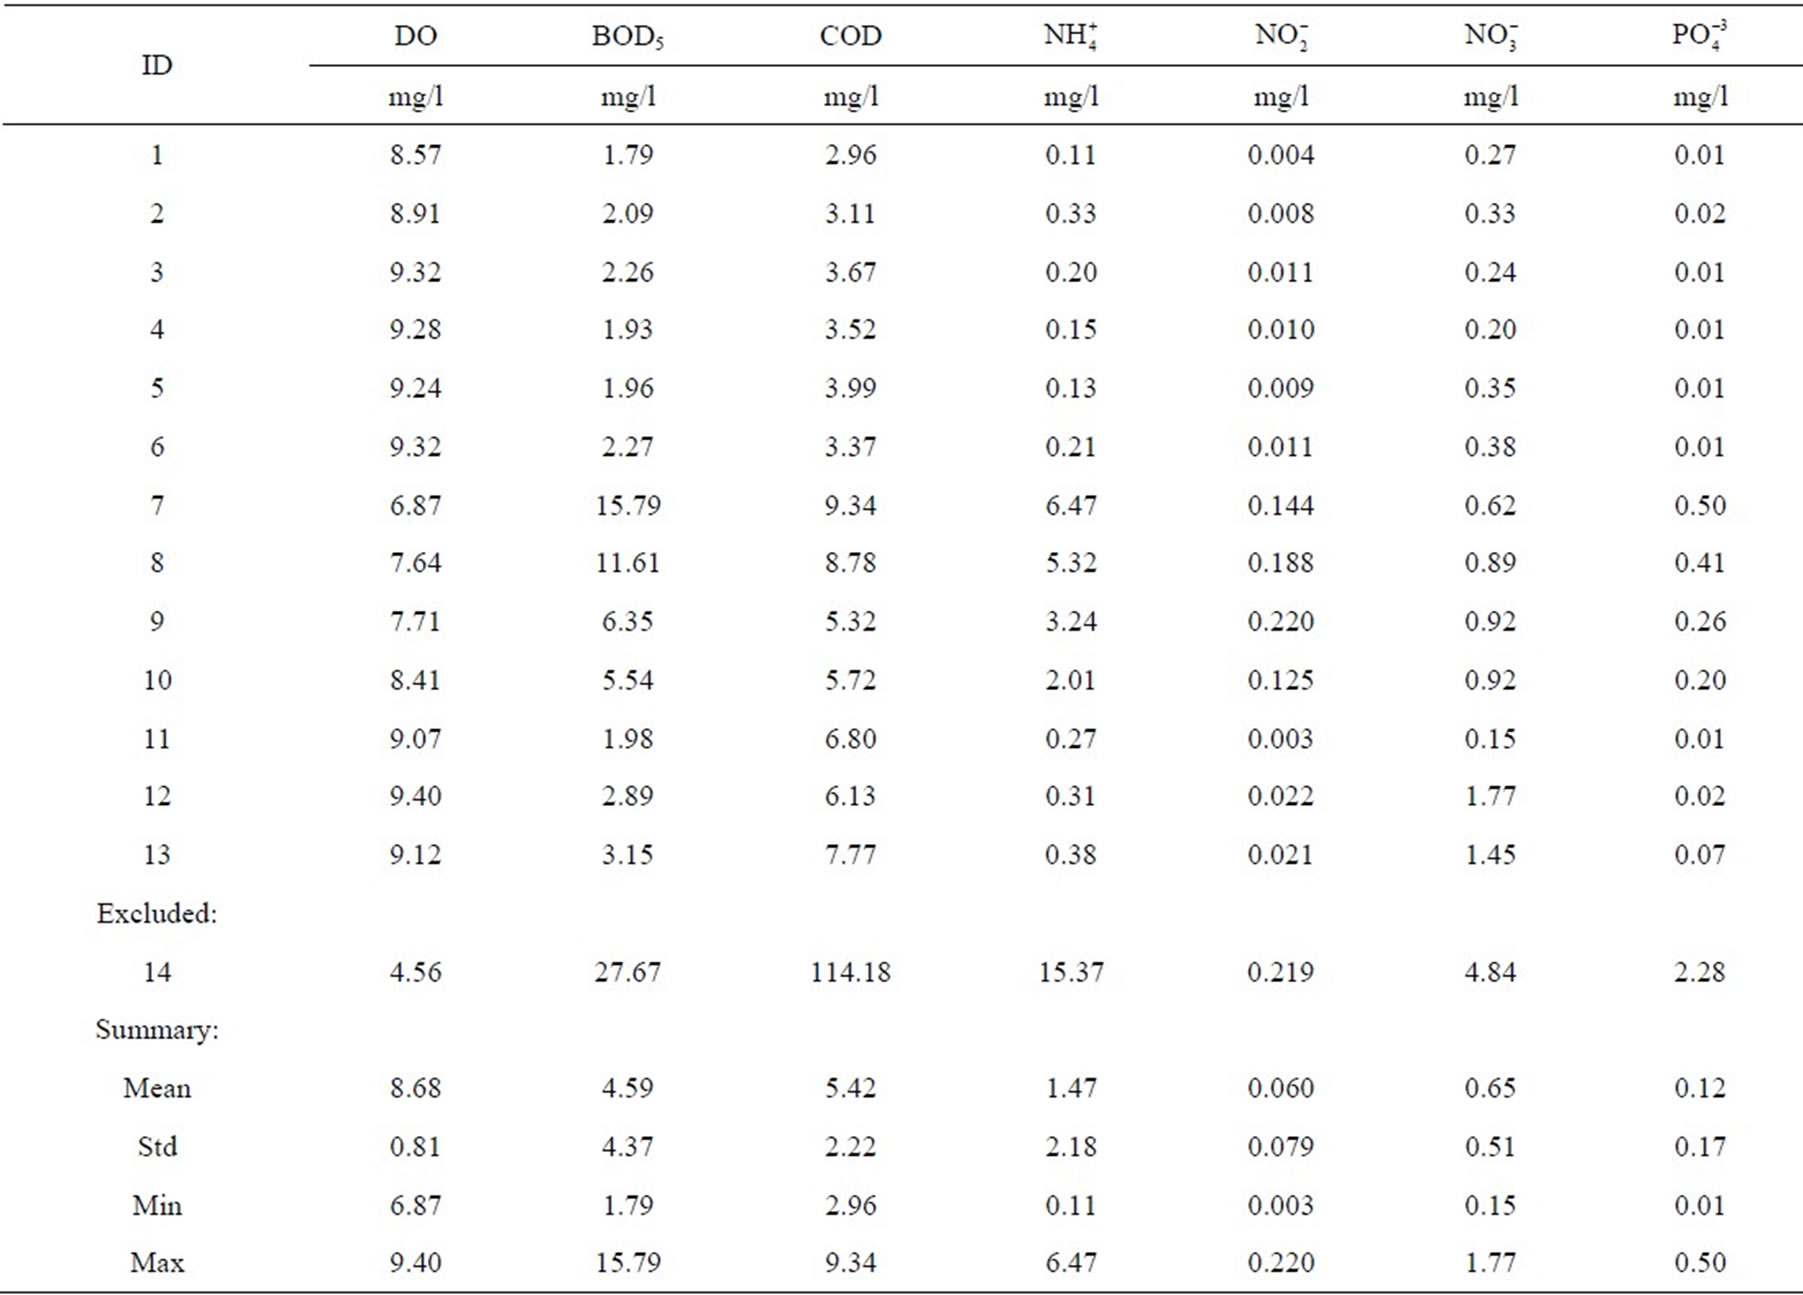
Table 5. Average values of variables from 1998-2008 for each monitoring site.
3.2. Inter-Relationship of Quality Parameters
To assess the relationships among determinands, the Pearson correlation for average hydro-chemical pairs has been calculated (Table 6). DO has a clear negative relationship at the 0.01 significant level. BOD5 and COD have strong positive correlations with other variables, except . Nutrients have significantly positive correlations with other hydro-chemicals apart from DO.
  has non-significant weak relations. According to the Pearson significant correlation at the certain level, a perfect positive relationship is 0.99 between ammonium and BOD5 at 99 percent level, and the weakest correlation is 0.56 between ammonium and COD at 95 percent level. Besides of that, correlations between DO and
 ,
,  are perfectly reverse at −0.95.
3.3. Secondary Data Analysis
Hydro-chemical primary datasets were used in the secondary data (WQI) calculation. Annual mean values of the indices are shown in Table 7.
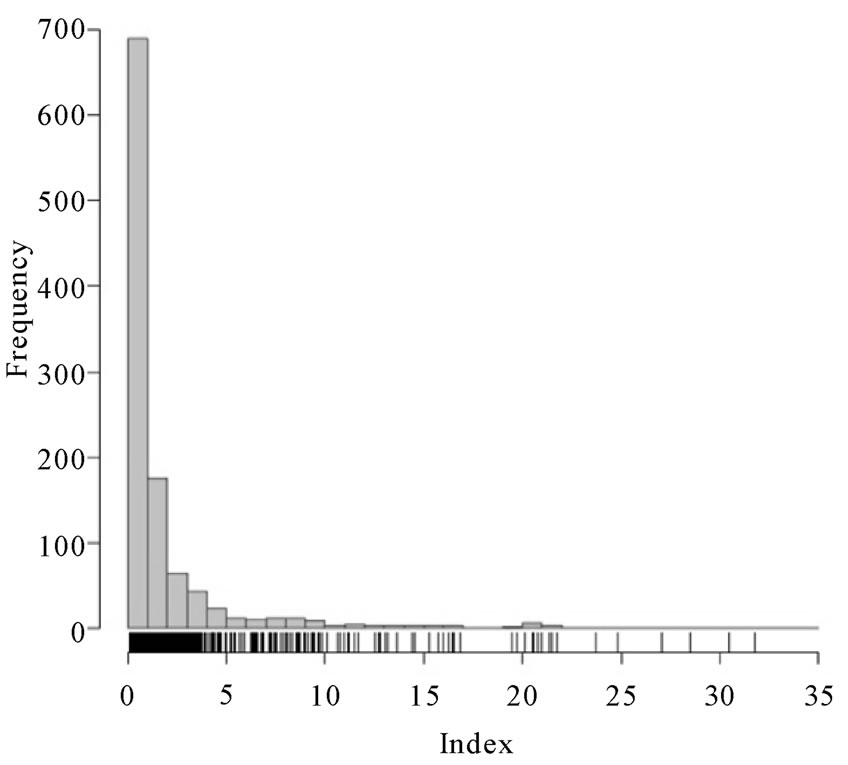
The minimum and maximum values of monthly WQI are 0.09 and 31.8, respectively. The highest value on the Tuul River was measured in December 2004 for a sample from Tuul-Songino (down). In addition, all high values of the natural waters have been measured at this sampling point in downstream, caused by CWTP discharge. Some statistical values such as mean 1.9, median 0.6, mode 0.4, skewness 4.1, 1st quartile 0.3 and 3rd quartile 1.7, have been calculated. The number of samples with critical values of the natural waters, excluding CWTP discharge, is shown in Table 8.
The histogram shown in Figure 2(a) visualizes that the distribution frequency of the WQI. As seen from Figure 2(a), the distribution is strongly left-skewed and there are very rare high values. The most of values are in

Table 6. The Pearson correlation for average bi-hydro chemicals.
the range of 0 to 2. Figure 2(b) shows that WQI variability at the sampling points along the river. A most dynamic one is a sampling point 7, namely Tuul-Songino (down), the index strongly depends on how well water has been treated when discharged from the CWTP. Then it is naturally purified along the river flow. First six sampling points have less variability of the WQI due to less human impact (except some tourist camps and towns) on the river.
3.4. Spatial Water Quality Assessment
The spatial distribution of average values for the quality
 (a)
(a)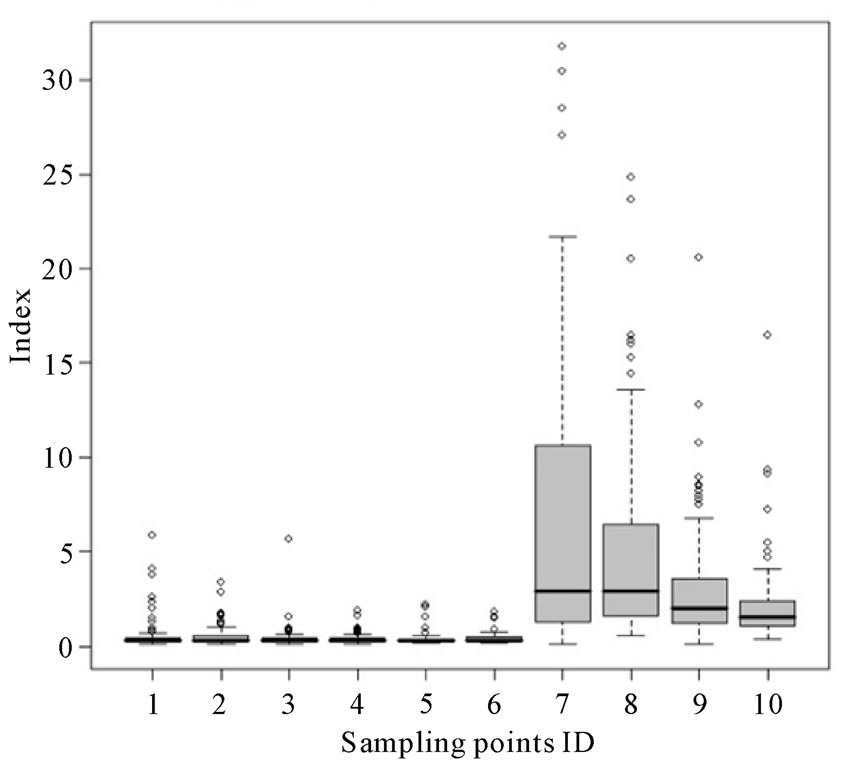 (b)
(b)
Figure 2. (a) Histogram of WQI and (b) Spatial variable of WQI along the Tuul River.
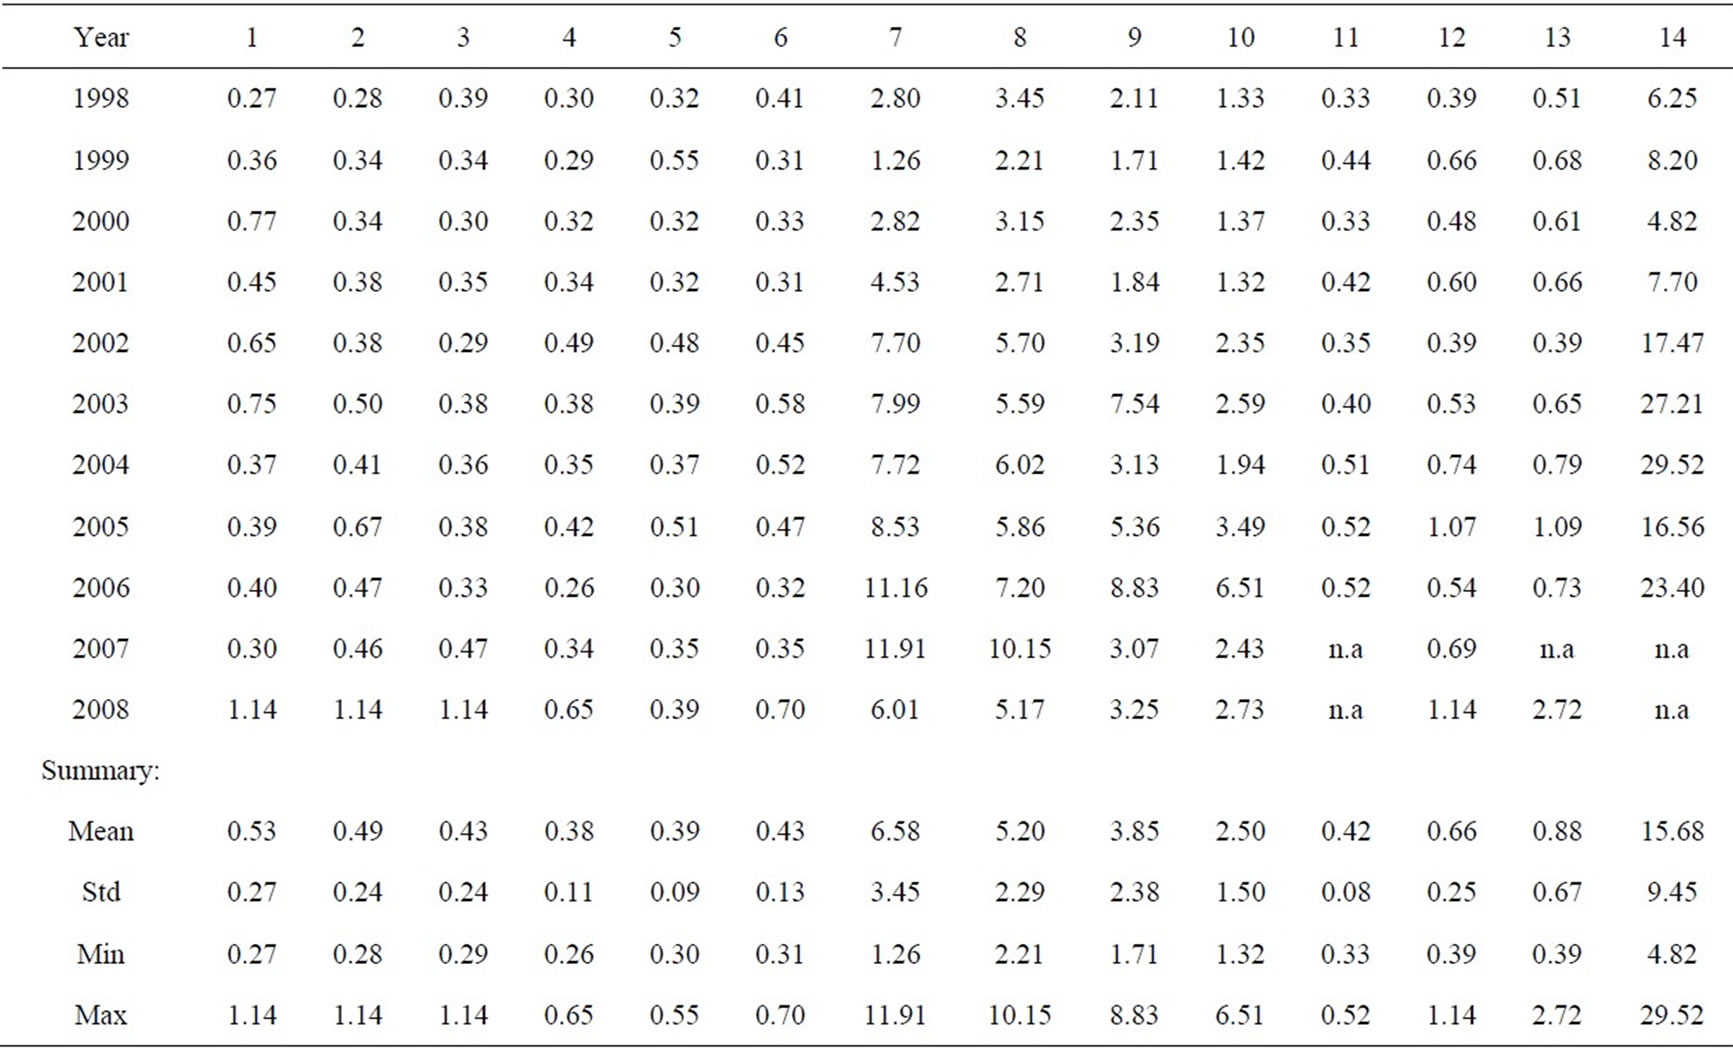
Table 7. Annual mean WQI at sampling sites.

Table 8. The number of samples with critical values.
indices from 1998 to 2008 along the Tuul River is given in Figure 3. General spatial pattern in the study area with lower values in the upper section of the river, but then rapidly increase at point number 7, caused by CWTP discharge. From this point, there is a gradual decrease to the last point due to dilution (Figure 3). Several point and non-point pollution sources exist in the study area. The point sources of pollution in the Tuul River are improperly treated wastewater from WTP. Naturally, as a result of flow through the mountainous area, the upstream of the river has more capability of self-purification than downstream. Figure 3 shows a scatter plot of WQI fluctuation and distance between sampling sites along the Tuul River.
The water quality remains steady until 73 km from the first sampling point (comparing with high peak values). However, there are high peaks from 7th sampling point that located in 75 km down from the first sampling point. Based on the above analysis, the entire hydro-chemical dataset has been separated into two datasets, namely upstream (natural waters) and downstream (waters affected by human activity) of the river. The upstream part contains data from the sampling point number 1, namely Tuul-Uubulan, until the 6th sampling point, Tuul-Songino (upper), which is located in upper reach of junction of the Tuul River and the CWTP discharge. The downstream part covers from sampling point number 7, Tuul-Songino (down) until the last sampling point number 10 (Tuul-Altanbulag) of this study.
In the upstream portion, fluctuation in water quality was moderately changed along the river. Moreover, most of the quality indices did not reach to maximum critical value six. Two point pollution sources out of five operate in the upstream, namely Nalaikh and Nisekh WTP. Total amounts of discharge release from those two sources are approximately 1800 m3/day. This amount of discharge does not really have strong negative effect on the river water quality. In addition, distance between two points is around 54 km along the river. This is enough distance for the river self-purification after the first waste matter
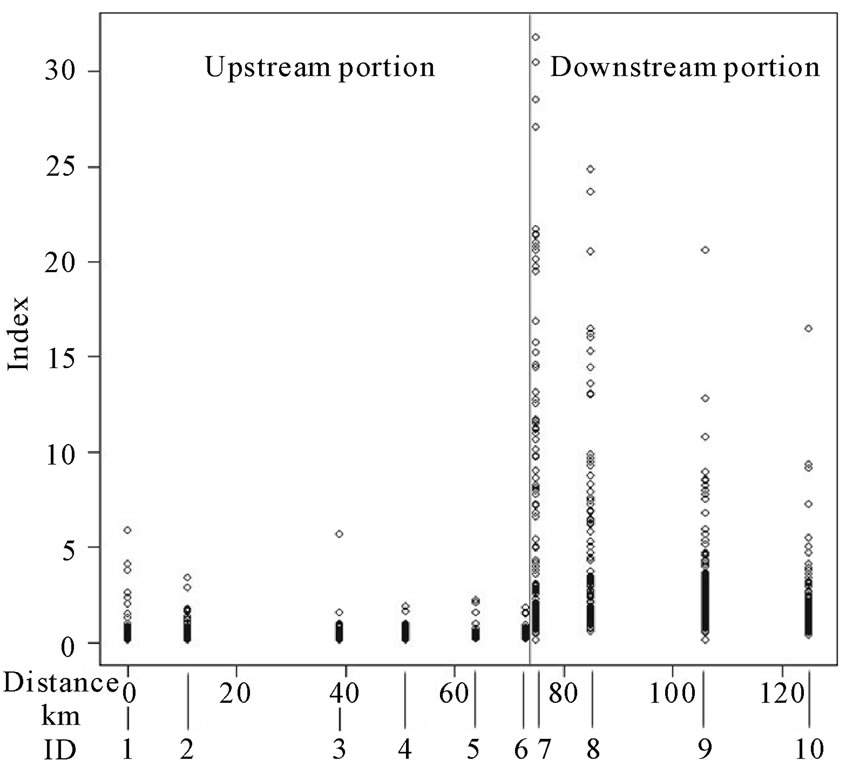
Figure 3. Spatial WQI fluctuation along the Tuul River.
pours into the water.
In the downstream portion, from the main pollutant source, quality index gradually decreases along the distance. Figure 3 shows that the index has already exceeded the maximum critical value due to the biggest point source of pollution. Three point sources are located in the downstream portion. Total volumes of discharge from CWTP, Bio-industry and Bio-Songino WTP are approximately 191090 m3/day and distance between points is around 2.5 km. This is not enough distance for the river self-purification process, especially after huge volume of effluent pours into the river. Pollution of the river reduces along the downstream, but not completely purified even 50 km downstream of the city.
3.5. Temporal Water Quality Assessment
Rapid urbanization, increasing number of tourist camps as well as different agricultural and mining activities have significant negative impacts on the Tuul River water quality and its related ecosystems. Consequently, the water becomes seriously polluted and loses its clarity and transparency, and its self-purification distance increases year by year [19].
Figure 4 shows annual average values of the indices between 1998 and 2008 were used for temporal trend analysis. The general trend of WQI and variability gradually increase in the study time steps. In the year 1999, the water quality was good, but in 2007, the index was highest. The reason of that is a new filtering system was installed in the treatment plant in 1999 by support of Japanese International Cooperation Agency. However, the system has not been renewed. Besides of that, increased values of the indices during the time could be due to rise of industrialization and increased the amount of wastewater related to population growth.
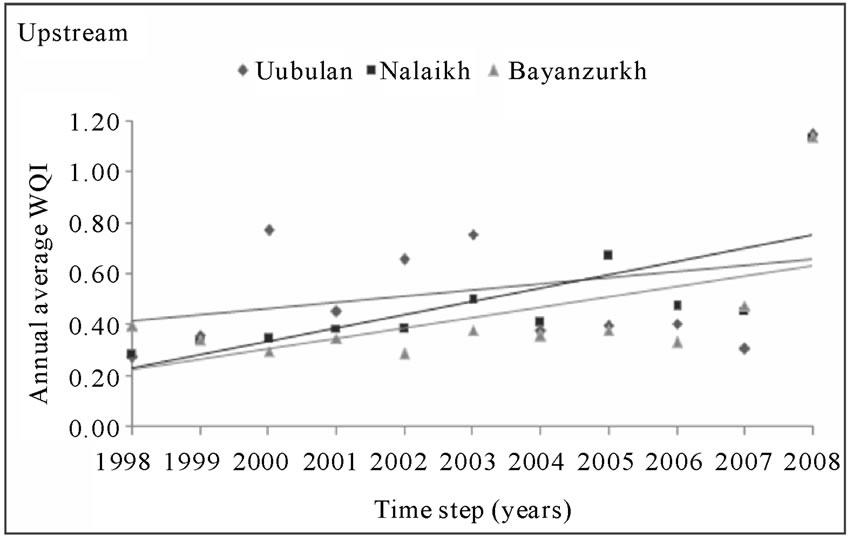
The time-series of the index values at the monitoring sites are shown in Figure 5. Generally, the water quality was not highly changed in the upstream portion (Figures 5(a) and (b)), because of the absence of the influential pollution source. However, there are slight upward trends in WQI with the following slopes (Table 9). In the downstream portion (Figure 5(c)), the water quality was decreased during the period of this study and the value of WQI was increased. In case of the inflows, there are clear upward trends in WQI at sampling points with different slopes. Due to the wide range of CWTP data (4.8 - 29.5), actual values have been transformed to log10 values (Figure 5(d)).
Figure 5 shows clear and unclear trends. Therefore, slope calculation of the index values to determine upward or downward trends are shown in Table 9. Positive values in Table 9 indicate the trend is upward, negative values downward and 0.0 value indicates there is no obvious trend.
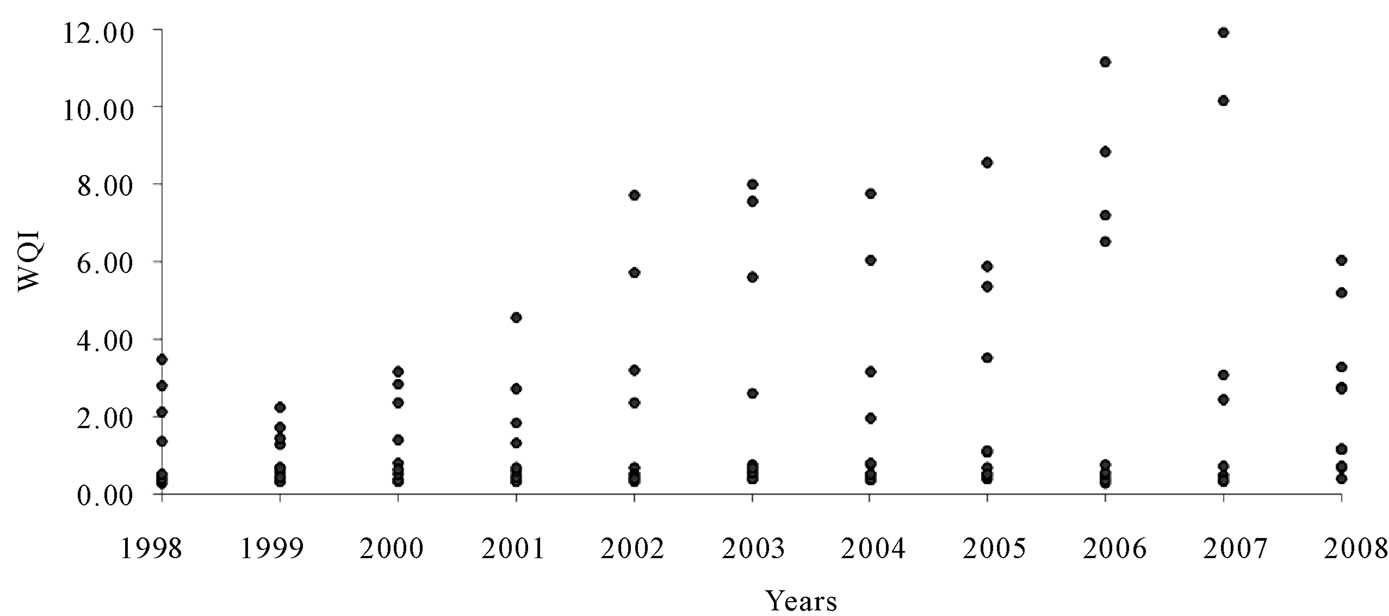
Figure 4. Annual average WQI.
 (a)
(a)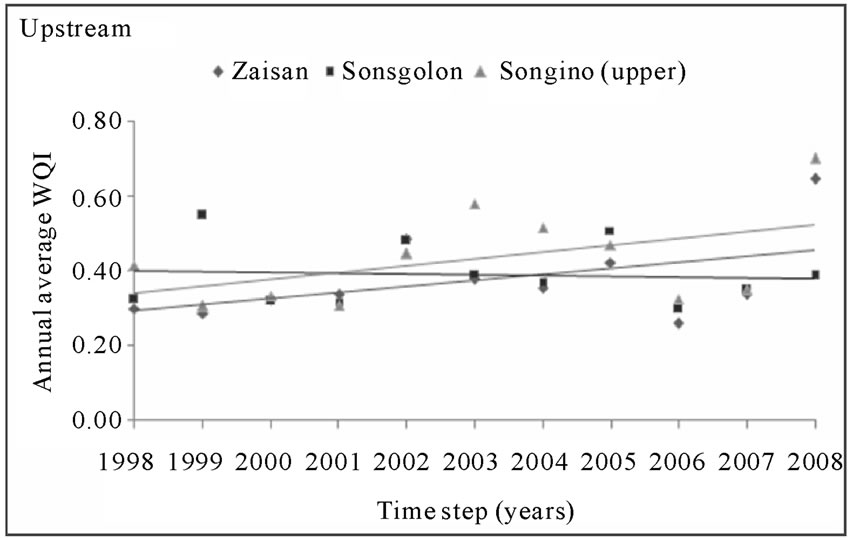 (b)
(b)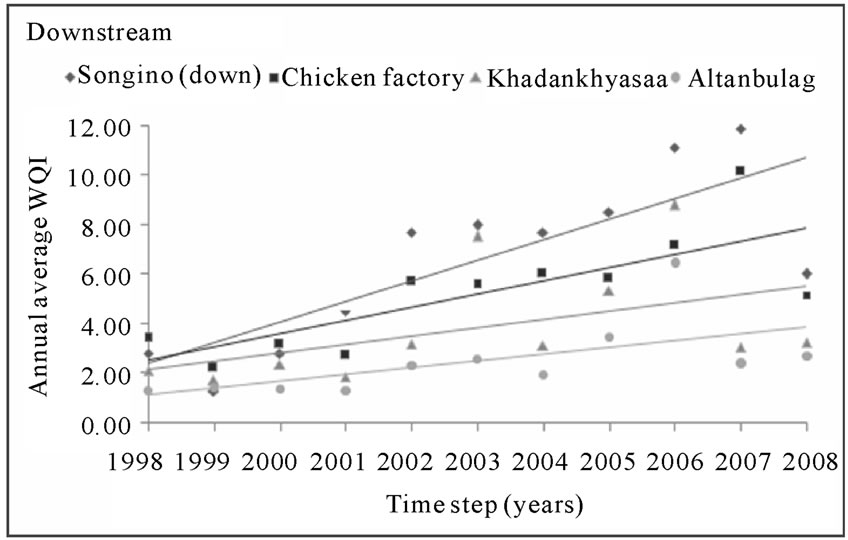 (c)
(c)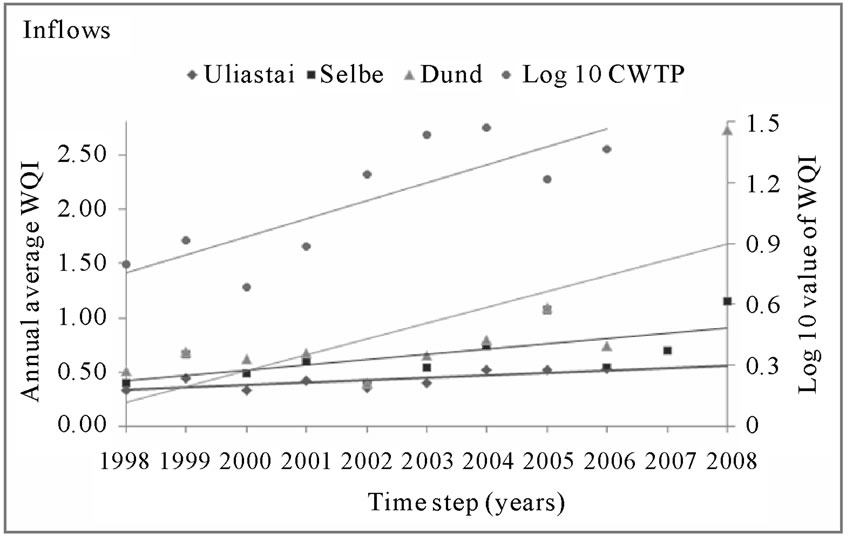 (d)
(d)
Figure 5. Temporal fluctuations of the WQI at the sampling sites from 1998-2008.

Table 9. Trend analysis of WQI.
As seen from Table 9, the CWTP and the site number 7 have higher slope values than the others. There are slight upward trends at most of the sites and clear upward trends at sites ID 8, 9 and 10 a reflecting the improper treated waters from the central plant. The following series of maps have shown spatio-temporal changes of water quality along the Tuul River and its inflows in the entire research years.
In 1998, the Tuul River was not seriously polluted. Classes of heavily polluted and dirty waters are not visualized on the map. In 2003, the river was seriously polluted. Heavily polluted and dirty water classes are visualized on the map. In 2006, the river was strongly polluted could be due to the efficiency of CWTP operation fail. Water quality of the specific year can be seen from the rest of maps (Figure 6).
Along the lower reaches of the river, the water quality gradually increases (Figure 6) reflecting the natural re-aeration of water, where chemical and biological reactions such as oxidation, nitrification processes have an effect. There is one site ID 7 in the Tuul River with low quality, which is normally associated with the year around discharge from the treatment plant (ID 14). The wastewater from that plant contains a high amount of nutrients and other chemical substances that can cause of major decrement of the water quality. This would definitely kill aquatic fauna and ecology in the stretch of the river system affected that certainly happened in 2007. The upper reaches of the river and tributaries have relatively good quality waters, which reflect the minimal impacts of human (Figure 6).
3.6. Seasonal Water Quality Assessment
Average index values of each season were calculated and used to seasonal assessment. Due to the wide range of
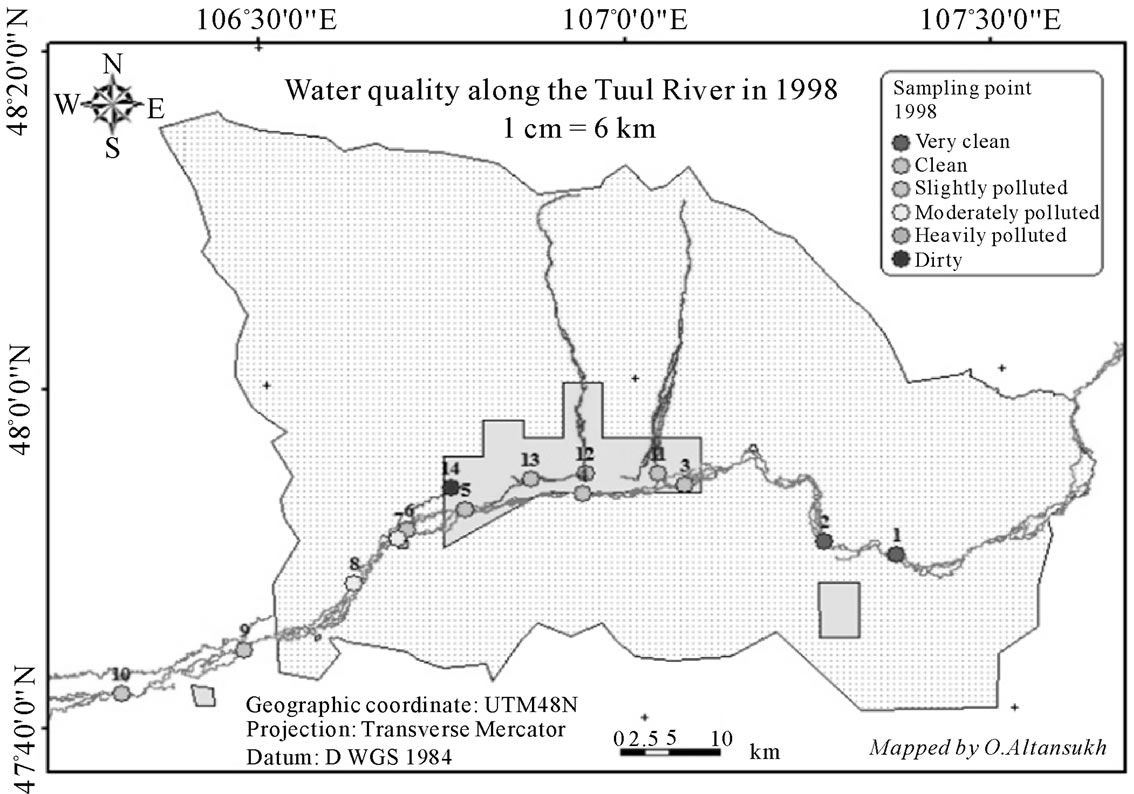
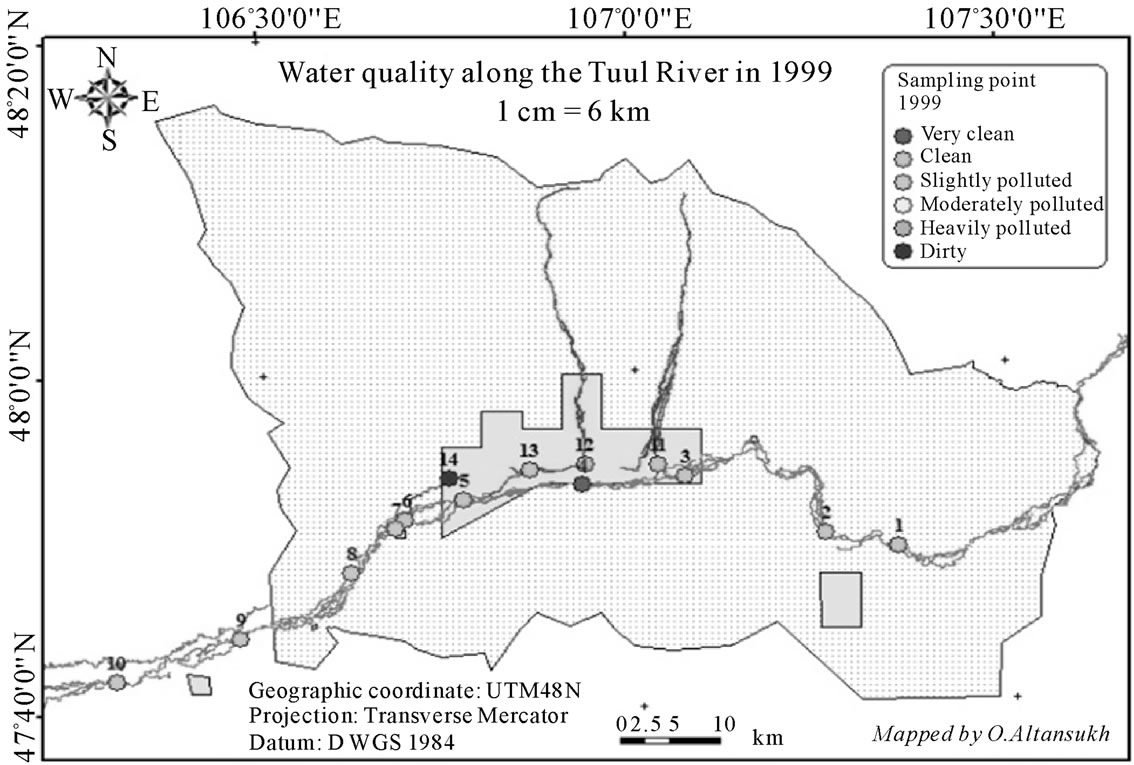


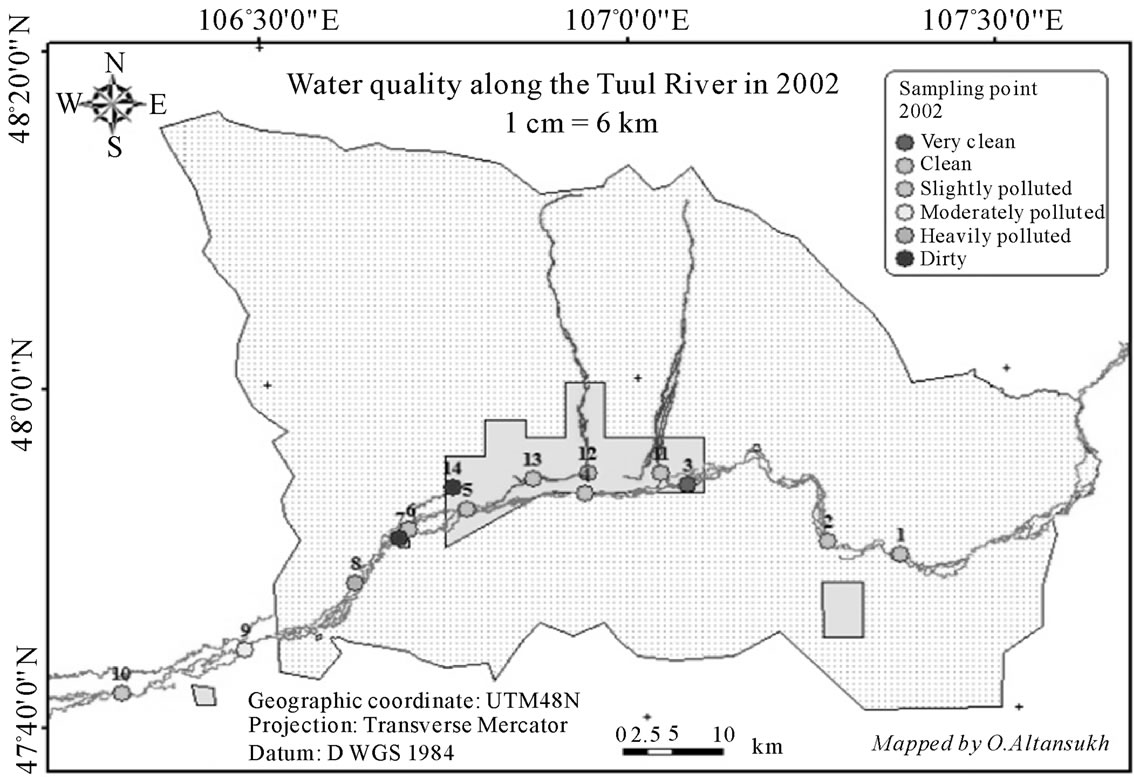
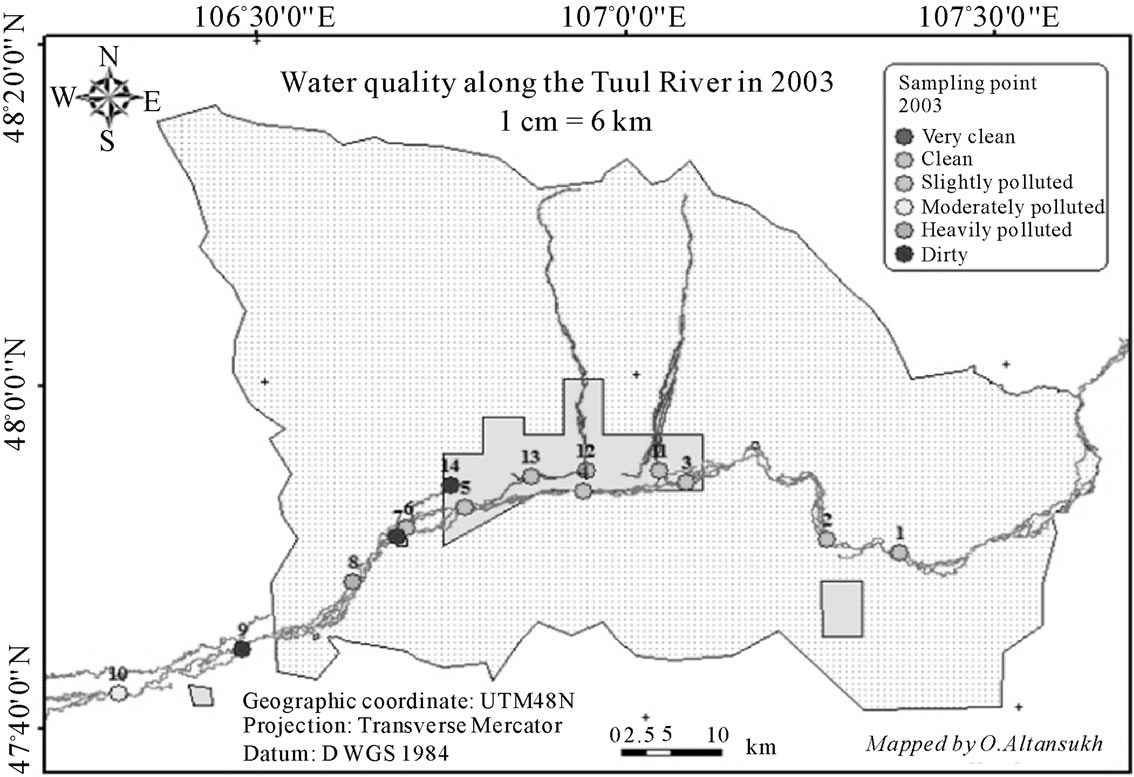
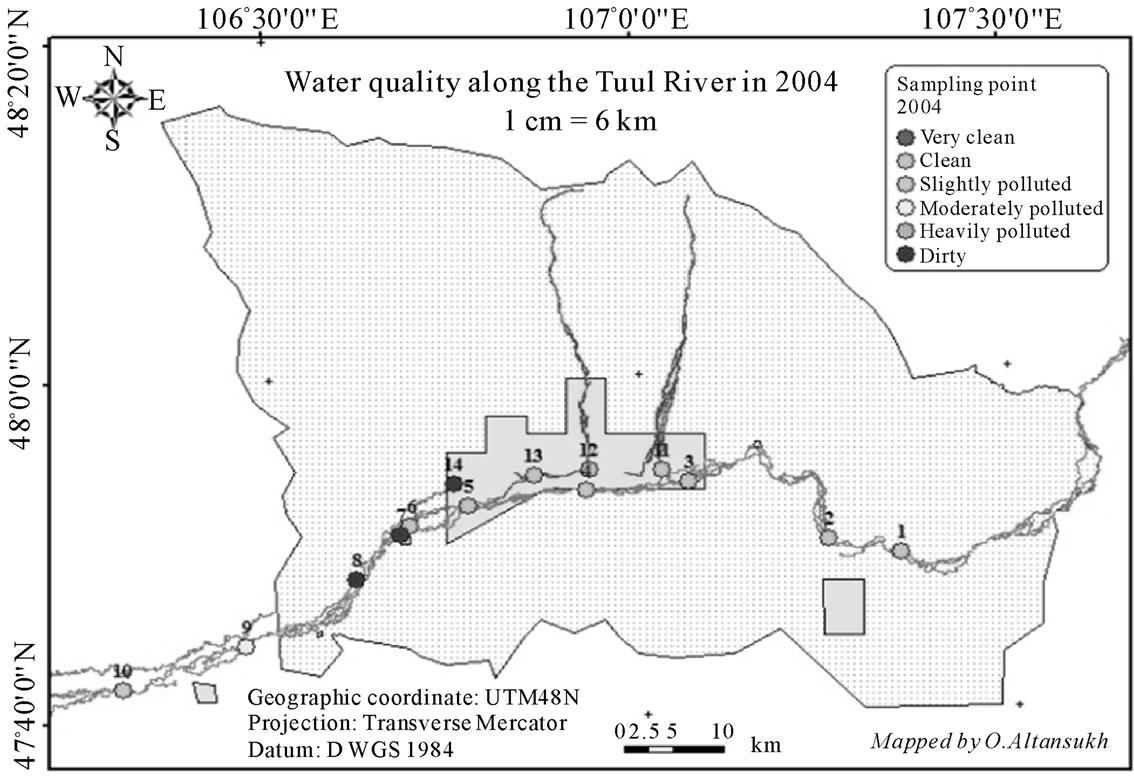
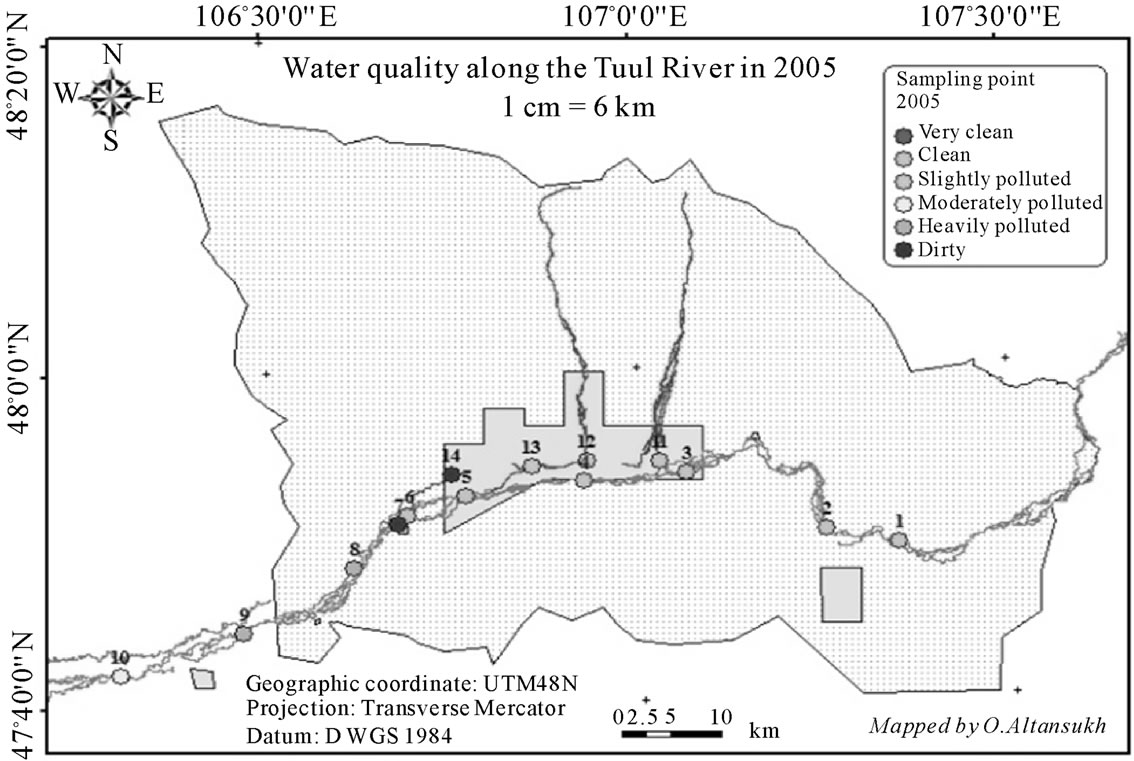
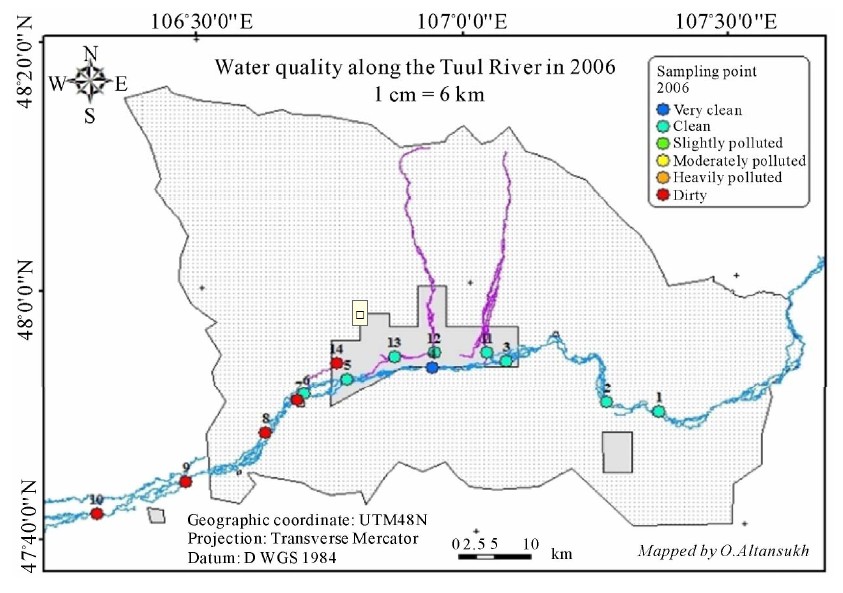
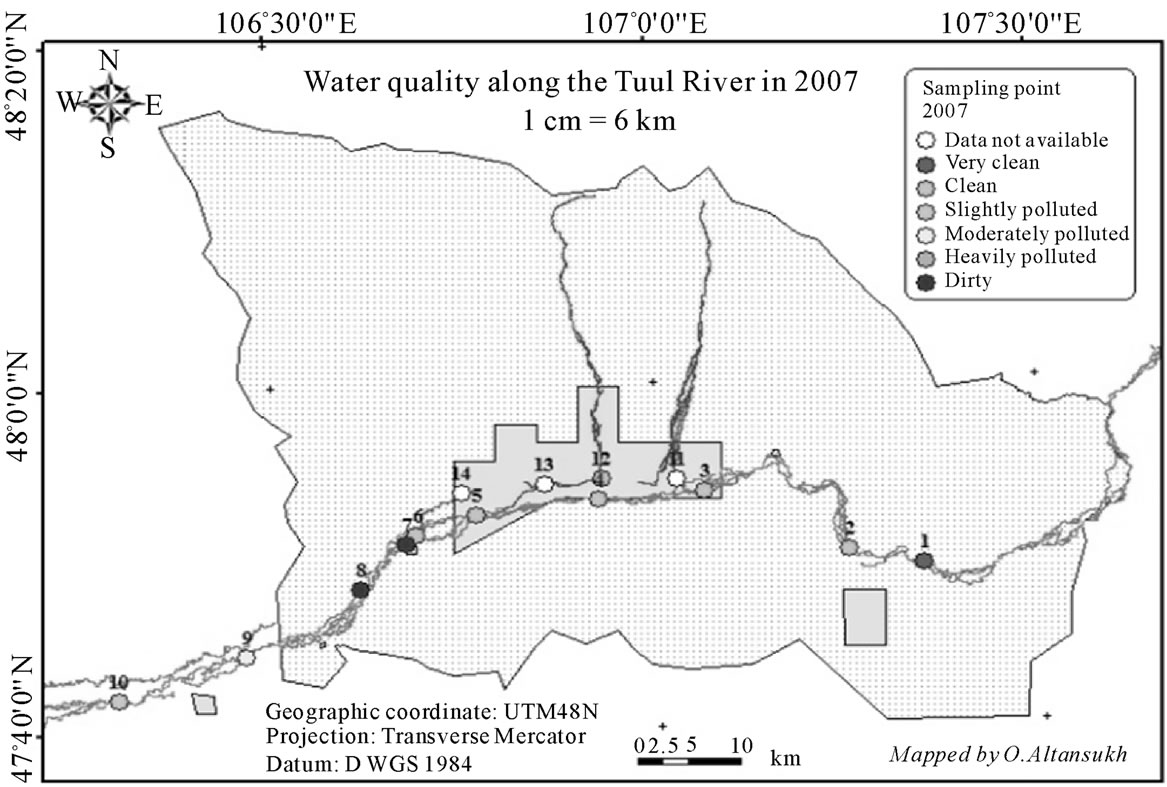
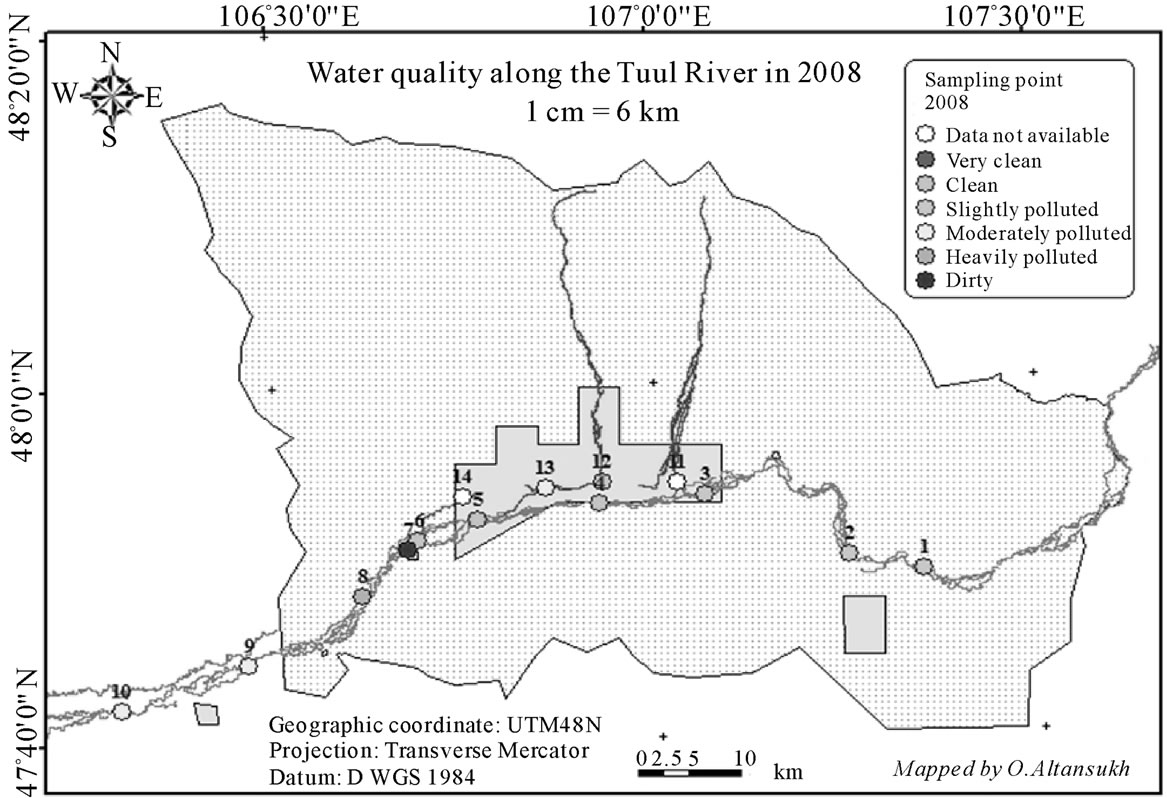
Figure 6. Spatio-temporal series of water quality index map of the Tuul River and its inflows.
data, actual values of the Tuul River have been transformed to log10 values.
It can be seen from Figure 7 the higher values of indices tend to occur in winter and lower values likely to occur in summer. There is a steady descend trend in the index value, means increment of water quality from winter to autumn. This is most likely due to the fact that the river water freezes, preventing interaction between water and other natural components. On the other hand, as the temperature rises, then ice melts, flow resumes and turbulence occurs, allowing natural re-aeration to take place.
The seasonal variability of index depends on both natural and human processes. The higher values in winter time are related to the river low flows and enormous amount of discharge from the CWTP. The river discharge reaches between 0 - 4 m3/s and the CWTP discharge reaches 2.2 m3/s, normally. Almost same concentrations as winter in spring are derived from snow melt and surface runoff, plus the treatment plant discharge. The lower values in summer are associated with not only normal flow of the river, but also related to re-aeration and nitrification process. The increased concentrations in autumn are derived from the rainfall-runoff process that washes away pollution elements from the catchment area.
Overall mean of the entire study period of the seasonal WQI calculated with maximum value 12.65 in winter at site 7 and minimum value 0.26 in autumn at site 1 (Table 10).
 (a)
(a)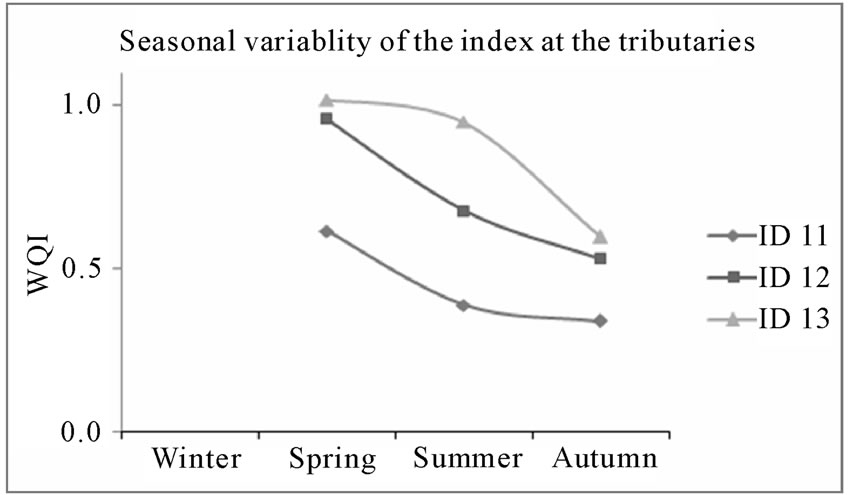 (b)
(b)
Figure 7. Seasonal variability of the index at selected sites from 1998-2008 (a) along the Tuul River, and (b) in the tributaries.
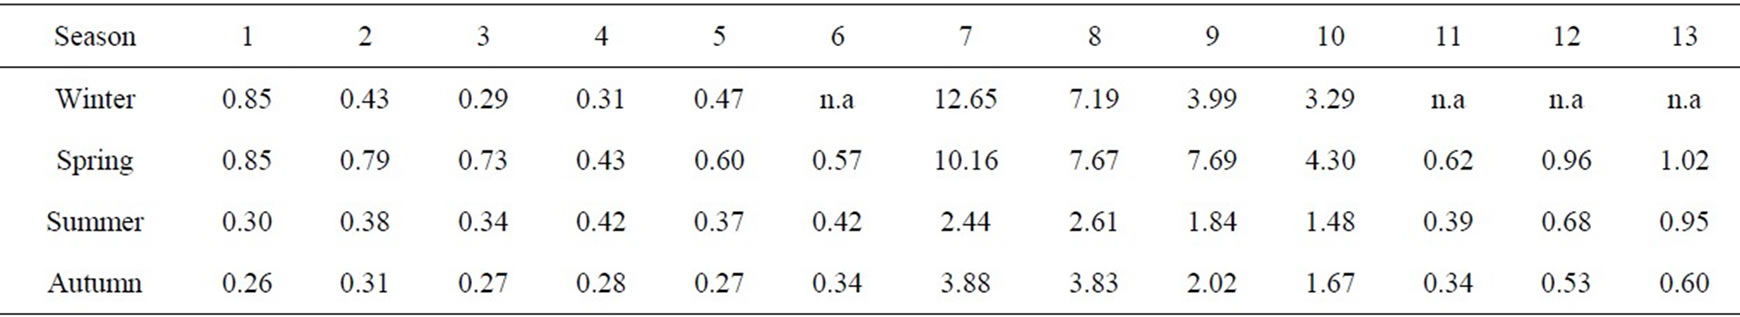
Table 10. Overall mean of the seasonal WQI at sampling sites.
4. Conclusions
This study was carried out on water quality assessment of the Tuul River system in surrounding area of the Ulaanbaatar city, Mongolia at 14 monitoring sites, using an extensive dataset between 1998 and 2008, collected by CLEM. The index method, developed by MNE of Mongolia, used to assess water quality and total, seven hydro-chemical variables, dissolved oxygen, biochemical and chemical oxygen demand, nitrate, nitrite, ammonium and phosphorus, applied in the WQI calculation. It presents the primary data analysis of seven variables and spatio-temporal, seasonal WQI assessment at the 14 monitoring sites in the study area.
Human activity in the region has a significant impact on surface water quality. Increments of hydro-chemicals are strongly associated with CWTP operation. Clearly, there is a need to improve the water quality in the Tuul River system in surrounding area of the Ulaanbaatar in order to bring it up to the class, I or II of the index assessment. The WQI analysis has shown the downstream section of the river is falling into the heavily and dirty water classes. The quality assessment suggests that the waters in the downstream section of the river are unsuitable for drinking and recreational purposes.
This research indicates that the Tuul River is not strongly polluted until the Ulaanbaatar and the pollution level spike appears when the river entering the city. Levels of pollution in the downstream section (sites 7 - 10) of the river are strongly dependant effluent treatment levels from the CWTP. Pollution of the river reduces along the downstream, but not completely purified even 50 km downstream of the city. The water quality of the river gradually has been decreased during the study period due to population growth, rise of industrialization and the CWTP operation fails. According to the spatio-temporal series of water quality maps, the river has started to get strong pollution since 2002. The higher values of WQI tend to occur in winter due to the both natural and human processes. Several point and non - point pollution sources exist in the study area. Among them, the CWTP is a biggest and strongest point source of pollution in the Tuul River in the study area, nowadays. At the moment, agricultural runoff is a not serious pollution source of the river system in the study area. The pollution is associated with urbanization, industrialization and population growth in the settlement area, and more related to densely located tourist camps in the upstream section of the Tuul River.
In order to change this situation, improvement of the operation efficiency of the CWTP becomes crucial to recover the water quality significantly. Accordingly, a modelling of water quality with different scenarios such as certain limits on chemical concentrations of the CWTP discharge and artificial increment of DO concentrations have important roles in the decision making system. DO concentrate can be artificially increased using bull stone wall (not weir) which has big enough holes that fish and sediment can easily pass through. The penetration theory by Higbie, 1935 and a surface renewal model that formalized Danckwerts in 1951 are theoretical part of the DO artificial increment method. This method can be more eco-friendly (economically and ecologically) and works more effectively over the long period. Also, there are several advantages of this method such as 1) materials that can use to build the wall are natural; 2) no extra operation cost after the wall built; 3) no negative impact on river system, aquatic fauna and sediment can easily pass through by holes between bull stones; 4) works efficiently for a long time; 5) easy to stop operation, just take out stones and 6) an artificial pond will not be created in upstream of the wall. However, there are also some disadvantages, which include 1) not applicable to big rivers; 2) the wall may collapse in the fact of strong flows; and 3) heavy machinery such as a crane is required.
Although, the river system still remains highly vulnerable to pollution. With expansion of settlement area and industrialization in the future, it is recommended that the Water Authority of Mongolia should estimate vulnerable zone and protection distances from both river banks and to restrict any future activities, which may have a negative impact on river ecological system. Furthermore, the Mongolian Government should improve the efficient operation of the CWTP in order to reduce the negative impact on surface waters. Perhaps a new wastewater treatment plant is needed for the Ulaanbaatar city.
5. Acknowledgements
Hydro-chemical datasets used in this study have been obtained from the Central Laboratory of Environmental Monitoring, Mongolia. The authors would like to thank all staffs at the laboratory for making the data available. We wish to express our honest gratitude to all staffs of Open Society Foundation-University of Oxford Scholarship Program, especially E.Ariunaa, John Paul Roche, and Inga Pracute for their support for my research and my visit Oxford.
REFERENCES
- R. C. Ferrier, et al., “Water quality of Scottish rivers: spatial and temporal trends,” The Science of the Total Environment, Vol. 265, No. 1-3, 2001, pp. 327-342. doi:10.1016/S0048-9697(00)00674-4
- C. Neal, et al., “Water quality of treated sewage effluent in a rural area of the upper Thames Basin, southern England, and the impacts of such effluents on riverine phosphorus concentrations,” Journal of Hydrology, Vol. 304, No. 1-4, 2005, pp. 103-117. doi:10.1016/j.jhydrol.2004.07.025
- H. P. Jarvie, C. Neal and P. J. A. Withers, “Sewage -effluent phosphorus: A greater risk to river eutrophication than agricultural phosphorus?” Science of the Total Environment, Vol. 360, No. 1-3, 2006, pp. 246-253. doi:10.1016/j.scitotenv.2005.08.038
- C. Neal, et al., “Phosphorus-calcium carbonate saturation relationships in a lowland chalk river impacted by sewage inputs and phosphorus remediation: an assessment of phosphorus self-cleansing mechanisms in natural waters,” The Science of the Total Environment, Vol. 282, 2002, pp. 295-310. doi:10.1016/S0048-9697(01)00920-2
- P. G. Whitehead, P. J. Johnes and D. Butterfield, “Steady State and Dynamic Modelling of Nitrogen in the River Kennet: Impacts of Land Use Change Since the 1930s,” The Science of the Total Environment, Vol. 283, 2002, pp. 417-434. doi:10.1016/S0048-9697(01)00927-5
- P. G. Whitehead, et al., “A Review of the Potential Impacts of Climate Change on Surface Water Quality,” Hydrological Sciences Journal, Vol. 54, No. 1, 2009, pp. 101-123. doi:10.1623/hysj.54.1.101
- P. G. Whitehead et al., “Impacts of Climate Change on in-Stream Nitrogen in a Lowland Chalk Stream: An Appraisal of Adaptation Strategies,” Science of the Total Environment, Vol. 365, No. 1-3, 2006, pp. 260-273. doi:10.1016/j.scitotenv.2006.02.040
- P. J. Johnes, “Uncertainties in Annual Riverine Phosphorus Load Estimation: Impact of load Estimation Methodology, Sampling Frequency, Baseflow Index and Catchment Population Density,” Journal of Hydrology, Vol. 332, No. 1-2, 2007, pp. 241-258. doi:10.1016/j.jhydrol.2006.07.006
- C. P. Mainstone and W. Parr, “Phosphorus in Rivers—Ecology and Management,” The Science of the Total Environment, Vol. 282-283, 2002, pp. 25-47. doi:10.1016/S0048-9697(01)00937-8
- T. Sato, F. Kimura and A. Kitoh, “Projection of Global Warming onto Regional Precipitation over Mongolia Using a Regional Climate Model,” Journal of Hydrology, Vol. 333, No. 1, 2007, pp. 144-154. doi:10.1016/j.jhydrol.2006.07.023
- D. Couillard and Y. Lefebvre, “Analysis of Water -Quality Indices,” Journal of Environmental Management, Vol. 21, No. 2, 1985, pp. 161-179.
- N. Stambuk-Giljanovic, “Water quality evaluation by a in Dalmatia,” Water Research, Vol. 1999, No. 33, 1999, pp. 3423-3440. doi:10.1016/S0043-1354(99)00063-9
- C. Javzan, A. Sauleguli and B. Tsengelmaa, “Study of Tuul river contamination,” Geo-ecology in Mongolia, Vol. 4, 2004, pp. 213-219.
- “Report on State of Environment for 2004-2005,” Ministry of Nature and Environment, Ulaanbaatar, 2006, p. 27.
- N. Roza-Butler, “An overview of the current condition of the Tuul river,” Geo-ecology in Mongolia, Vol. 4, 2004, pp. 220-226.
- Orchlon, “Pollution mitigating measures for the Tuul river—Three assessments,” Daily News, Ulaanbaatar, 1995.
- Orchlon, “Pollution mitigating measures for the Tuul river—Three assessments,” Geographic Issues, Vol. 245, 2005, p. 8.
- O. Altansukh, “Surface Water Quality Assessment and Modelling – A Case Study in the Tuul River, Ulaanbaatar city, Mongolia,” MSC, Water Resource Management, International Institute for Geo-information science and earth observation, Enschede, 2008.
- D. Basandorj and G. Davaa, “Tuul River Basin of Mongolia—Integrated Water Resource Management,” Interpress, Ulaanbaatar, 2006.
- NAMHEM, “Surface Water in Mongolia,” Interpress, Ulaanbaatar, 1999.
- “Causes of Decreasing Water Resource of Tuul River and Ways of Its Protection,” Ministry of Nature and Environment, Ulaanbaatar, 1997.
- O. Altansukh, “Surface water quality study in Ulaanbaatar city,” Geoecological Issues, Vol. 4, No. 250, 2005, pp. 127-132.
- R. K. Horton, “An Index Number System for Rating Water Quality,” Journal of Water Pollution Control Federation, Vol. 37, No. 3, 1965, pp. 300-306.
- R. M. Brown et al., “A Water Quality Index—Do We Dare,” Water sewage works, Vol. 117, 1970, pp. 339-343.
- G. Davaa, D. Oyunbaatar and M. Sugita, “Surface water of Mongolia,” Environmental book of Mongolia, Vol. 2006, pp. 55-82.
- “Permissible level of surface water variables,” National Standardization Agency, Ulaanbaatar, 1998.
- Y. Erdenebayar and T. Bulgan, “Formulae for water quality index,” Ulaanbaatar, Mongolia, 2006.
- “Definition of quality grades used to surface water in Mongolia,” Ministry of Nature and Environment, 1997, p. 14.