Journal of Water Resource and Protection
Vol. 3 No. 7 (2011) , Article ID: 6259 , 9 pages DOI:10.4236/jwarp.2011.37062
Trace Elements in the Drinking Water and Their Possible Health Effects in Aligarh City, India
Department of Geology, Aligarh Muslim University, Aligarh, India
E-mail: taqveemk@yahoo.co.in
Received January 10, 2011; revised March 19, 2011; accepted May 8, 2011
Keywords: Water Quality, Trace Elements, Drinking Water, Health
ABSTRACT
Environmental degradation and unethical human intervention in the natural system has increased the concern for the betterment of healthy living. The deterioration of aquatic system is commonplace in the developing world. The present paper shows the trace elements (Ni, Zn, Fe, Pb, Cd, Co, Cu and Mn) concentrations in the drinking water of Aligarh city and their possible effect on the health of the inhabitants. The higher concentration of some elements in the drinking water and the poor health of inhabitants are found correlated. The statistical analysis of the data shows positive correlation between some elements. The principal component analysis of the data gives four factors with significance level of 42%, 29%, 15% and 12% respectively.
1. Introduction
Heavy metals are among the most persistent of pollutants in the aquatic ecosystem because of their resistance to decomposition in natural conditions [1]. High concentrations of these metals can be released into the aquatic environment as a result of leaching from bedrocks, atmospheric deposition, water drainage, runoff from riverbanks, and discharge of urban and industrial wastewaters [2-3].
The elemental anomaly in the groundwater regime once created through natural processes or by unintended or unethical human intervention, often goes unabated. The toxicity of an element depends on the dose, the chemical form, route of exposure, bio–availability, distribution in the body, and storage and excretion parameters.
In recent years, considerable interest has been focused on assessing the human health risk posed by metals, metalloids, and trace elements in the environment. It has long been recognized that large areas of the globe contain human populations characterized by having trace element deficiency, or excess including chronic poisoning [4-6].
Many current examples of environmental health problems are the result of long – term, low-level exposure to heavy metals. One notable example is the widespread poisoning caused by high arsenic levels in well waters in Bangladesh and West Bengal, India.
During the past several decades, studies in a number of other locations have demonstrated widespread occurrence of trace elements in water at concentration signifycantly higher than background levels.
Elevated trace element concentrations are not limited to certain water types or polluted areas; they appear in all type of systems and in all geographic areas. It is clear that metal enters the aquatic system from diverse sources, both point and non – point and can be readily transported from a-biotic to biotic system In Aligarh City, India, famous for its lock and hardware industries, the population may be at risk because of mobilization of metals from the electroplating processes used by these industries. Most of these operations are conducted in dark alleys in the city where there is neither proper drainage nor a proper sewer system. It has been reported that at some places the effluents from the local industry has been pumped into the bore wells that joins the groundwater used for drinking purposes. To assess the mobilization of metals from these activities six groundwater samples, from the hand-pumps used for drinking purposes, were collected and analyzed for their trace element contents.
1.1. Health Status
In the third world countries environmentally related diseases are rampant. In the poor cities, environmental problems tend to originate in or around the home where crowding, smoky kitchen, garbage, pets, unsanitary food and dirty water continues to plague the inhabitants day in and day out. The inhabitants are susceptible to a range of environmentally related diseases owing to the high density of population. The population density of the study area is 16,500 persons per sq. km. The population density of India’s Capital New Delhi is 9294 persons per sq km and that of India as a whole is 324 person per sq km. This is high in comparison to the density of United States with about 80 people per sq mile. According to recent estimates, premature death and illness due to major environmental health risks accounts for nearly 20% of the total burden of disease in India, second to malnutrition and greater than all other preventable risk factors and casual disease group [7].
Aligarh is the main producer of locks in India it has the major portion of the population engaged in lock related industries. A study related to health problems in Aligarh District was conducted by Hanif et al. [8], to asses lead toxicity in lock factory workers. The study concluded that 60% of the subjects in the study group who were exposed to lead in the lock factory had blood lead levels more than 40 μgm/dl. The mean for the control and study group was 22.29 μgm/dl and 48 μgm/dl respectively, a statistically significant difference in the study group and the lock factory workers.
A study conducted by Atiq [9] (2006) on the prevalence of diseases and poor living conditions in Aligarh city concluded that 55% of the total households sampled suffer from diarrhea/dysentery, 43% jaundice, 42% malaria and 41% respiratory diseases. About 40% suffer from skin diseases and a similar percentage suffers from small pox/chicken pox. Whereas 35% of the people reported other diseases (i.e. hypertension and diabetes). Only 14.42% reported tuberculosis.
Down to earth [10] (2008) reports that more than 80% of the groundwater in Aligarh is susceptible to contamination with 50% of the city’s groundwater resources at high risk. 24% moderately vulnerable and only 19% somewhat safe.
All these studies [8-10] refer to poor health status of the inhabitants of the Aligarh City. No single study was conducted to asses the concentration of trace elements in the drinking water of Aligarh city and its probable effects on the health of the inhabitants. This paper deals with a short review of the various health effects related to trace elements (i.e. nickel, zinc, iron, lead, cadmium, cobalt, copper and manganese) and their concentration in the groundwater of Aligarh city.
1.2. Study Area
The study area lies between latitude 27˚50′ and 28˚N and longitude 78˚ and 78˚5′E (Figure 1) and is spread over 152 sq km.
The area lies between the Karwan River in the west and the Sengar River in the east and is a part of the Central – Ganga basin. The central depression and western upland are two prominent physiographic units of the area. The NW-SE trending upland forms the eastern margin of the western upland and sub parallel to it lies the central depression due east. The elevation varies from NW – SE with an average gradient of 0.26 m/km. Usually, the surface down to a depth of 20 to 25 cm is a well – drained soil and contains loose loam that can easily be cultivated. The pH of the soil ranges from 7 to 8. Iron and alumina remain constant, whereas, magnesia is less through out the area.
The area falls under sub-tropical climatic zone and is characterized by hot summer and chilly winter. During summer the temperature shoots up to 47˚C and in winter the temperature may fall to 2˚C. The monsoon normally breaks in the second week of June and ends in September. Heavy precipitation takes place in the months of July and August. The area on an average receives 760 mm of rainfall per year.
1.3. Synopsis of Geology and Hydrogeology
The Ganga basin is one of the largest groundwater repositories of the world. It is located between the northern fringe of Indian Peninsula and Himalayas and extends from Delhi Haridwar ridge in the west to Monghyr – Saharsa ridge in the east. The study area forms part of this vast basin. In the study area the bed rock encountered at a depth of 340 meter below ground level is upper Bhander red shale of the Upper Vindhyan group of Proterozoic age which is further overlain by quaternary alluvium. The river Ganga and its various tributaries derived from the newly risen Himalayas and also from the northern fringe of the peninsula deposited the quaternary sediments on the eroded surface of the upper Vindhyans.
Hydrogeologically there is a three to four tier aquifer system. Aquifers seem to merge with each other, thus, developing a single bodied aquifer. The granular zones comprise 40 - 50 percent of the total formations encountered at various depths. This makes the aquifer vulnerable to contamination. In the southeast the clay formation attains considerable thickness and predominance of the clay to the granular zones form 50% of the total litho units encountered. However, the clay beds pinch out laterally. The shallow aquifers in the area mainly comprise fine to medium sands and vary in thickness from 3 to 26 meters. The groundwater occurs in these aquifers under phreatic condition. Due to excessive withdrawal of water from these aquifers, they are highly strained. The dis-
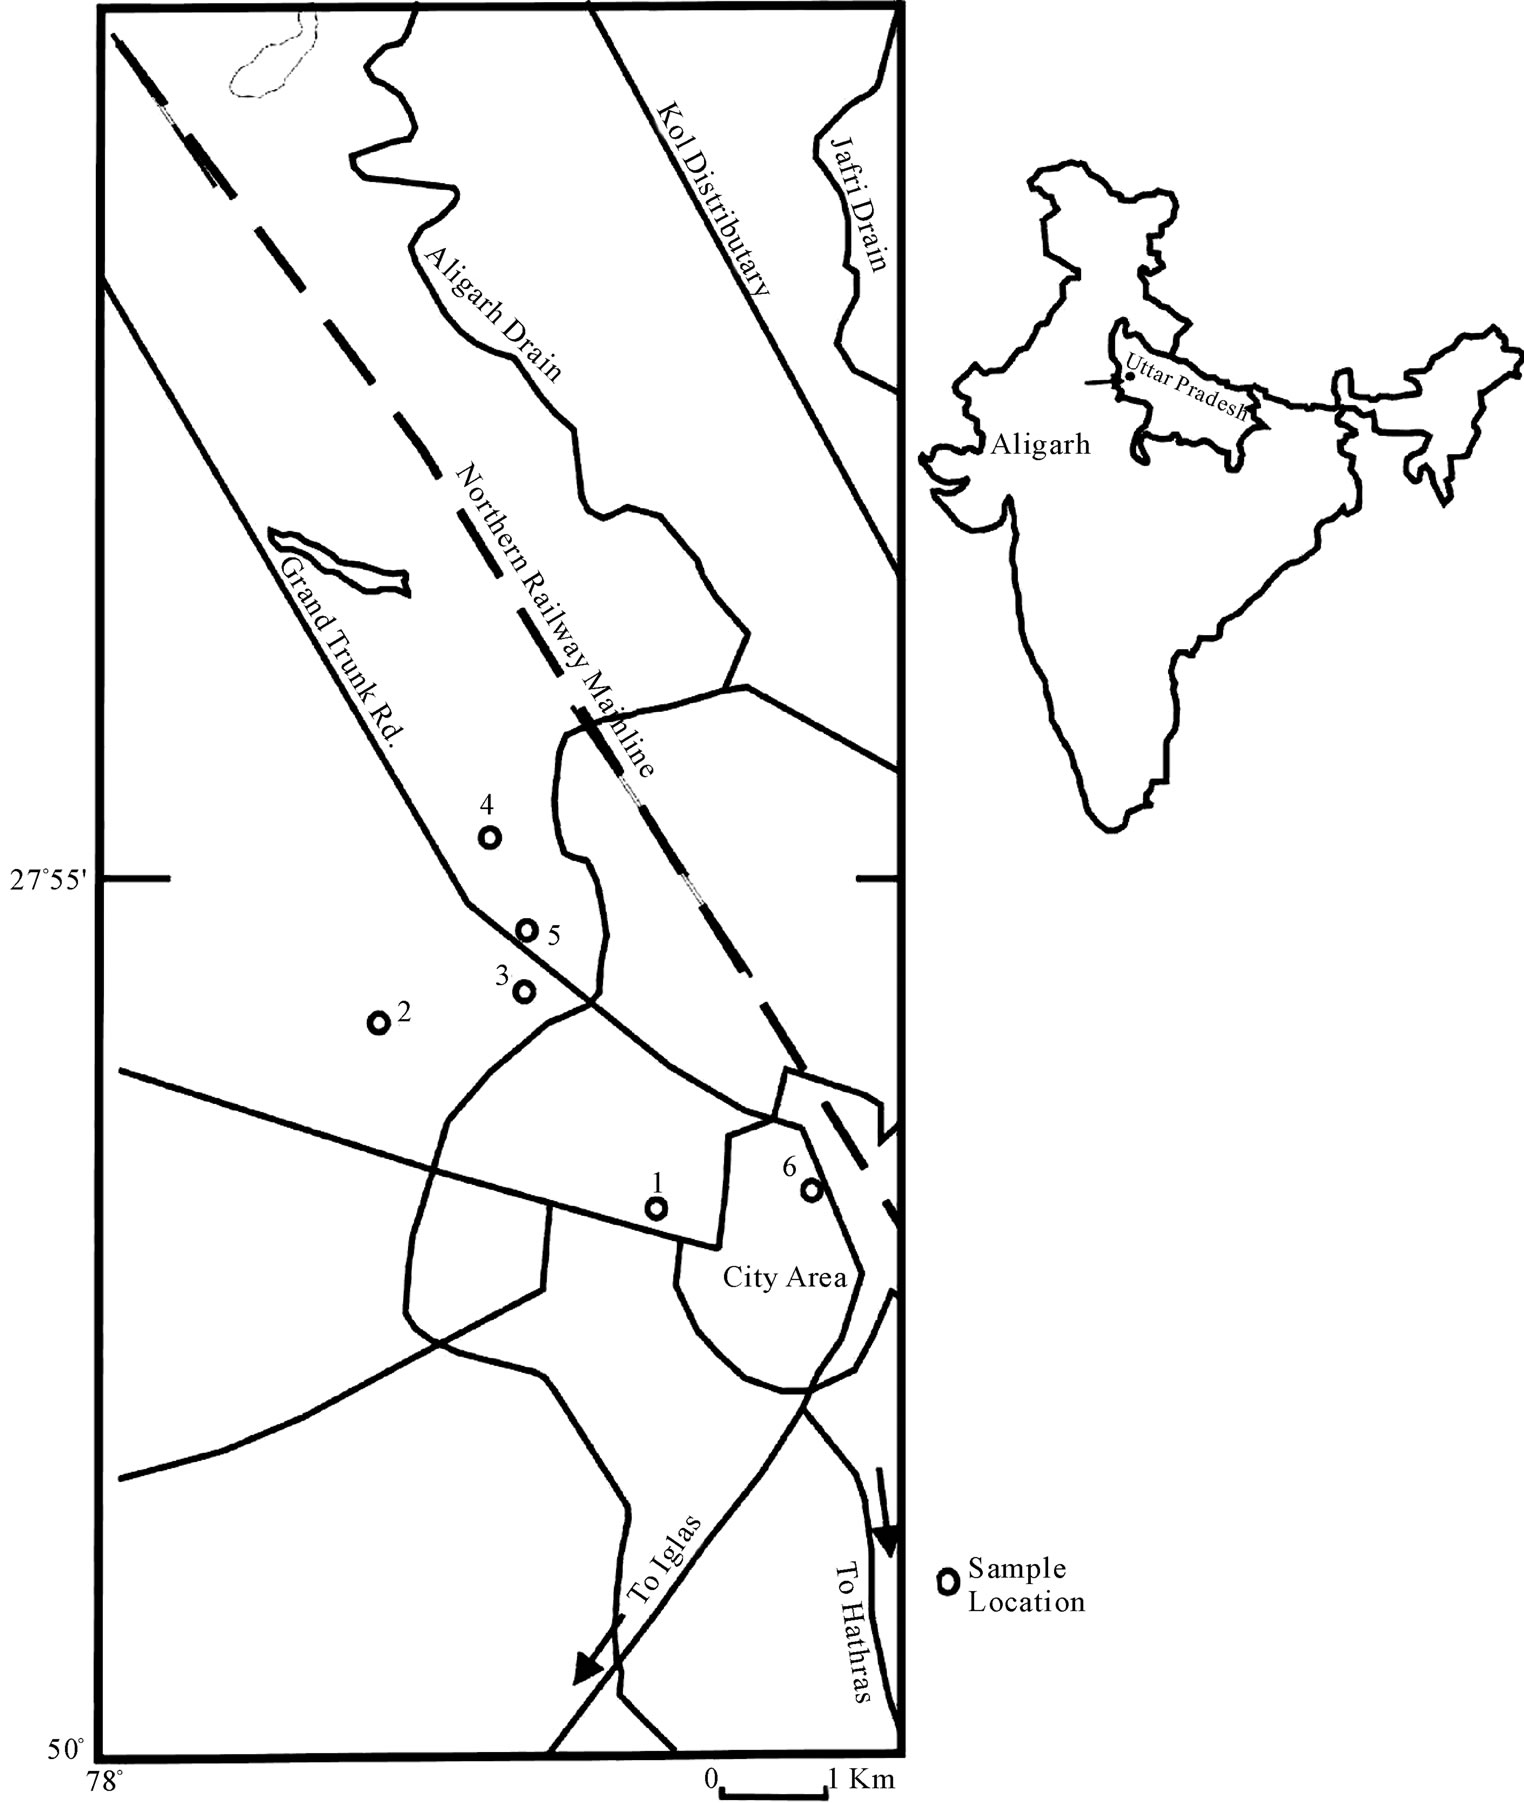
Figure 1. Showing study area.
charge of these wells varies from 30 to 50 m/hr at a nominal draw down of 3 to 4.5 meters. The elevation of water table ranges between 179mts in the northwest to 171mts in the southeast above the mean sea level. The general flow of groundwater is northwest to southeast in consonance with the over all trend of groundwater flow in the Ganga basin save minor alteration that are governed by local lithologic and anthropogenic factors [11].
Risk assessment is essential for the effective management of groundwater resources. There are two components to the risk of pollution from groundwater-groundwater vulnerability and contaminant load. Groundwater vulnerability is the intrinsic susceptibility of the specific aquifer in question to contamination An aquifer that is close to the surface, overlain by sandy soil, and located in an area with high precipitation rates would clearly be more vulnerable to contamination than an aquifer in an area of low precipitation that is hundreds of meters below ground surface and overlain by clay soils or other relatively impervious material [12]. In the light of the above criteria groundwater in the study area is vulnerable to pollution.
2. Material and Method
Groundwater is the only source of water supply in the area. In the absence of any effective water law there is substantial extraction from the shallow aquifer. Shallow aquifer being the main source of potable water supply in the area, the water samples were collected from the hand pumps in one liter polythene bottles and duly treated with 6N HNO3 at the site itself. Atomic absorption Spectrophotometer was used to find – out the concentration of the trace element in the collected water samples.
3. Discussion
The results of the analytical analysis are given in the Table 1.
Nickel generally poses no threat to humans because its absorption from food and water is very low. It is not known to cause any health problems when people are exposed to it at levels above the Maximum Contaminant Level (MCL) for relatively short periods of time. The long term or occupational exposure of nickel causes the following effects: decrease body weight, heart and liver damage, and skin irritation. If it goes to the respiratory tract it increases the risk of lung and nasal cavity cancer. The MCL level of nickel in drinking water is 0.1mg/l and 0.07 mg/l [13]. The concentration of nickel in the drinking water of the Aligarh City area ranges between 0.14 - 0.22 mg/l. This is above the MCL established by the USEPA and WHO. Thus, there is a probable threat from nickel to residents of the area if their consumption of the water is for the lifetime, as it is for most residents.
Nickel is one of the most mobile of the heavy metals when released to water, particularly in polluted waters, where organic material will keep nickel soluble. Though nickel does accumulate in aquatic life, it does not become magnified along food chains. Nickel released to the soil may leach into ground water or be washed into surface water. The primary source of nickel in drinking water is leaching from sanitary fixtures. The main threat of nickel contamination comes from the industrial pollution of groundwater.
The importance of zinc to human nutrition has been recognized since 1962 when overt zinc deficiency was observed among rural inhabitants of the Middle East [14]. The daily requirement of Zn for an adult of 70 kg is 15 mg. Likely concentration of Zn in drinking water is 0.1 - 0.245 mg/lt. If a person drinks two liters of water per day than he gets about 1.3% - 3.3% of the Zn requirement through water. The desirable limit of zinc established by the Indian Council of Medical Research is 0.1 mg/l and the maximum permissible limit is 5 mg/l. The concentration of Zn in the groundwater samples of the area ranges between 0.062 to 1.798 mg/lt. Save for a few samples the concentration of Zn in the groundwater is more than the desirable limit but less than the maximum permissible limit.
The desirable and maximum permissible limit of iron in the drinking water is 0.1 and 1 mg/lt, respectively. The concentration of iron in the shallow groundwater of the study area ranged between 0.26 - 1.66 mg/l, which is above the desirable limit and at some location it was found to be above the permissible limit. Thus, there is the possibility of iron toxicity in the area.
Iron is most abundant in earth’s crust but its deficiency occurs throughout the world. This is because humans have a mechanism that prevents excess absorption of iron. This is because iron is toxic when accumulated in tissues in high concentration. Iron is necessary for the activity of cytochromes, peroxides, catalase, and certain other hemoprotien and flavoprotien enzymes. According to the results of some experimental studies conducted on rodents, iron deficiency significantly increases the incidence of certain type of tumors and multiplied sensitivity of animals to some carcinogens [15]. When administered parenterally, iron is a highly toxic element. Humans are generally well protected from oral overdose, but children from 1 to 2 years of age are particularly vulnerable to iron toxicity from ingestion of iron supplements that have been commercially prepared for adults [16].
The permissible limit of lead in drinking water is 0.01 mg/l. The concentration of lead in the drinking water
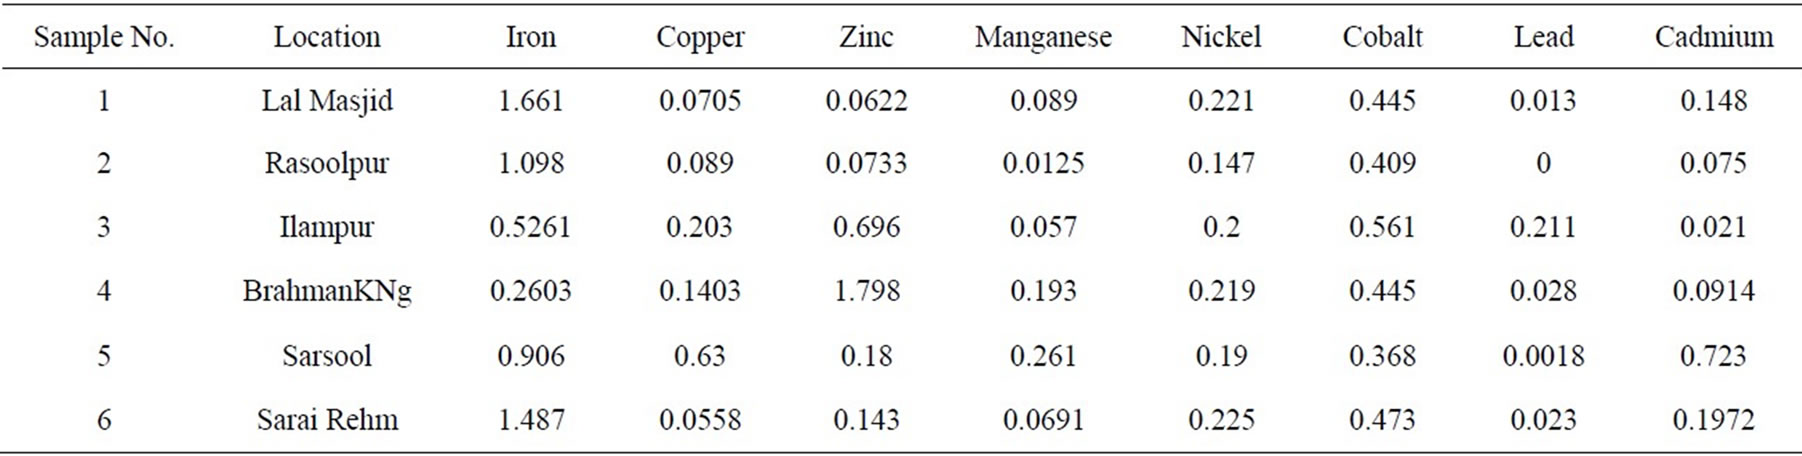
Table 1. Trace elements concentration in the study area in mg/l.
of the study area is from nil-0.211 mg/l that is above the permissible limit set by standard agencies and can cause ill effects on the health of the consumers.
The main source of lead in groundwater is from the rocks containing lead sulfide and oxides. The household plumbing fixture made up of lead may contribute lead in the drinking water. The other contributors are the leaded gasoline and lead in paint.
The beneficial effects of lead are not known. No biological function of lead is known. Lead taken into the body can be injurious to health. The bulk of lead contamination in the human body is of nutritional origin. High exposure to lead may cause decreased fertility and ovulatory disturbances and increase malformations and abortions. It may also cause renal and gastrointestinal disturbances. Children exposed to lead pollution are under high risk of mental retardation, impaired learning ability, disturbances of peripheral nervous system, and renal atrophy. The study of the lock factory workers of Aligarh [8] shows that blood lead level is high. The cause may be exposure to lead in the lock factories supplemented by the lead from drinking water. The situation behooves immediate intervention by the government to take preventive measures in ensuring good health.
The recommended permissible limit of cadmium in drinking water is 0.003 mg/l [17] and its concentration in the study area water ranges from 0.021 - 0.723 mg/l. Cadmium is least soluble in water when pH is 8 - 9 and become more soluble with the decrease in pH. The pH in the area ranges from 7.6 - 8.6. The value of 8.6 is found in only one sample. The rest of the samples had pH less than 8. The dissolution of cadmium would be more because the pH is less than 8. This makes the area a potential cadmium hazard zone owing to the vast metal and electroplating industries working in the city.
Cadmium is frequently used in electroplating and in pigment manufacturing industries. Cadmium occurs in zinc ores and is an important by-product in the zinc metallurgy.
Of all the toxic metals, cadmium has drawn a great amount of attention in Aligarh City. In high amount, Cd is a deadly poison, but even small amount taken over a long period of time accumulates in the biological system and causes serious illness. It is mainly retained in liver and kidney, causing pathological changes in hepatocytes and kidney tubules. The major effects in the persons occupationally exposed to cadmium are lung diseases and renal functions [18-20]. In addition, exposure to cadmium can lead to high concentrations in the blood and increased frequency of chromosomal deformities. Nervous symptoms disorders caused by cadmium toxicity include; dizziness, headache, cramps, and loss of consciousness [21]. The best-described accident related to discharge of cadmium into water is the occurrence of Itai-Itai disease among residents along the Jintsu River in Japan [22]. The residents were not only exposed to cadmium through drinking water but also through the rice grown in the contaminated water. There is also evidence from animal studies that cadmium is implicated in the etiology of hypertension [23]. Recent experimental studies indicate that cadmium at very high doses can interfere with the activation of vitamin D in both liver and kidneys to the final active 1, 2, 5-dihydroxycholecalciferol.
In the study area cobalt ranges between 0.368 - 0.561 mg/l. Cobaltous sulfate, CoSO4, a red crystalline substance that is readily soluble in water, is used in decorating and plating and for remedying cobalt deficiencies in cattle and sheep [24]. The richest source of cobalt in human diets is green leafy vegetables. Cobalt is present in igneous rocks in small amount but quite common in basic and ultra basic rocks. During the process of weathering it forms solution but may be adsorbed by oxidized sediments. It is an essential element for all living beings as it is the part of vitamin B12 molecule. Deficiency of cobalt in the geological background affected the health of sheep and cattle in many parts of the world (Europe, New Zealand, and Australia) [25].
The desired level of copper in potable water is 0.05 mg/l [17]. The concentration of Cu in the groundwater of the study area ranges between 0.05 and 0.63 mg/l.
At a normal concentration copper is a biologically important trace element; at elevated concentration it is toxic for living organisms. It is an important and indispensable element for the vital functions of humans, animals and plants. It is a component of enzymes-oxidases (cytochromoxidase, ceruloplasmin, superoxide scavenger, tyrosinase, urateoxidase, etc.) [26-28]. In terms of its adverse impact on organisms (both terrestrial and aquatic) copper ranks among the most toxic heavy metals (after Hg and Cd) [29]. Cu deficiency in food causes various pathological states in animals, accompanied by disturbance of hemopoiesis (anemia), dystrophic changes in the central nervous system, and changes in the color and quality of hair [30]. The deficiency of Cu in the human body could indirectly increase the risk of skin cancer. Because of the depletion of stratospheric ozone layer, skin cancer may become more common. The health hazard would be much higher, if there is coincidence of exposure of ultraviolet radiation and deficiency of protecting factors [31]. Symptom of Copper deficiency may appear, even if the amount of the metal in diet is adequate, but there is excess in sulfates, which reduce the solubility of copper―containing substances in water and so its bioavailability for the living organism [32].
Copper in the body is capable of binding bacteriotoxins and increase the activity of antibiotics [33]. Reduced blood concentration of trace element has been reported in pregnancy and pathological conditions, e.g., anemia, renal disorders, leukemia, and certain type of tumors; invasive diseases caused by worms are also connected with the deficiency of Copper and Iron in the body [34].
The desired and permissible level of manganese in drinking water is 0.05 mg/l to 0.5 mg/l respectively. The concentration of manganese in the groundwater of the area ranged from 0.057 to 0.261 mg/l which is above the desired level and below the permissible limit. The groundwater of the area thus does not appear to be a manganese hazard.
Statistical Analysis
Multivariate statistical analysis techniques are widely used in groundwater quality studies. It is an effective way to elaborate the hydrochemistry of an area. In the present work the statistical analysis is carried out to determine the natural association between the variables and demonstrates the usefulness of the statistical analysis to improve the understanding of the groundwater composition.
Correlation coefficient is used to measure the strength of the association between two continuous variables. This tells if the relation between the variables is positive or negative, that is, if one increase with the increase of the other or one decreases with increase of the other. Thus, the correlation measures the observed co-variation. The most commonly used measure of correlation is Pearson’s “r”. It is also called the linear correlation coefficient because “r” measures the linear association between two variables [35]. The data were statistically computed using correlation coefficient in order to indicate the sufficiency of one variable to predict the other [36].
Pearson’s Correlation Coefficient is usually signified by r (rho), and can take on the values from –1.0 to 1.0. Where -1.0 is a perfect negative (inverse) correlation, 0.0 is no correlation, and 1.0 is a perfect positive correlation. The variables having coefficient value (r) > 0.5 or < –0.5 are considered significant. The correlation matrix is given in the Table 2.
Positive correlation exists between lead and cobalt. Copper cadmium and manganese are positively correlated in the study area. The cadmium concentration in the groundwater samples of the area was found higher than the permissible limit. It means there is source of pollution that is increasing the cadmium concentration in water. If the process continues manganese and copper will also increase as they have positive correlation with each other in the study area. Lead has a positive correlation with cobalt. In the study area lead is found above the permissible limit. Cobalt has a negative correlation with cadmium and manganese. Iron shows the same relation with zinc. This indicates that these variables have an inverse relation.
Principal component analysis (PCA), a multivariate statistical technique, was initially developed as a tool in the social sciences but has proven quite effective in groundwater quality studies [37-40]. The technique is used for data reduction and for deciphering patterns within large sets of data [41,42]. The multivariate analysis is used in making the relationship between variables (water quality data). This technique aims to transform the observed variables to a set of variables, which are uncorrelated and arranged in decreasing order of importance. The principal aim is to simplify the problem and to find new variables (principal components), which make the data easier to understand [43]. The result of these techniques helps the interpretation of the data. The numbers of factors, called princepal components (PC), were defined according to the criterion that only factors that account for variance greater than 1 (eigenvalue-one criterion) should be included. The rational for this criterion is that any component should account for more variance
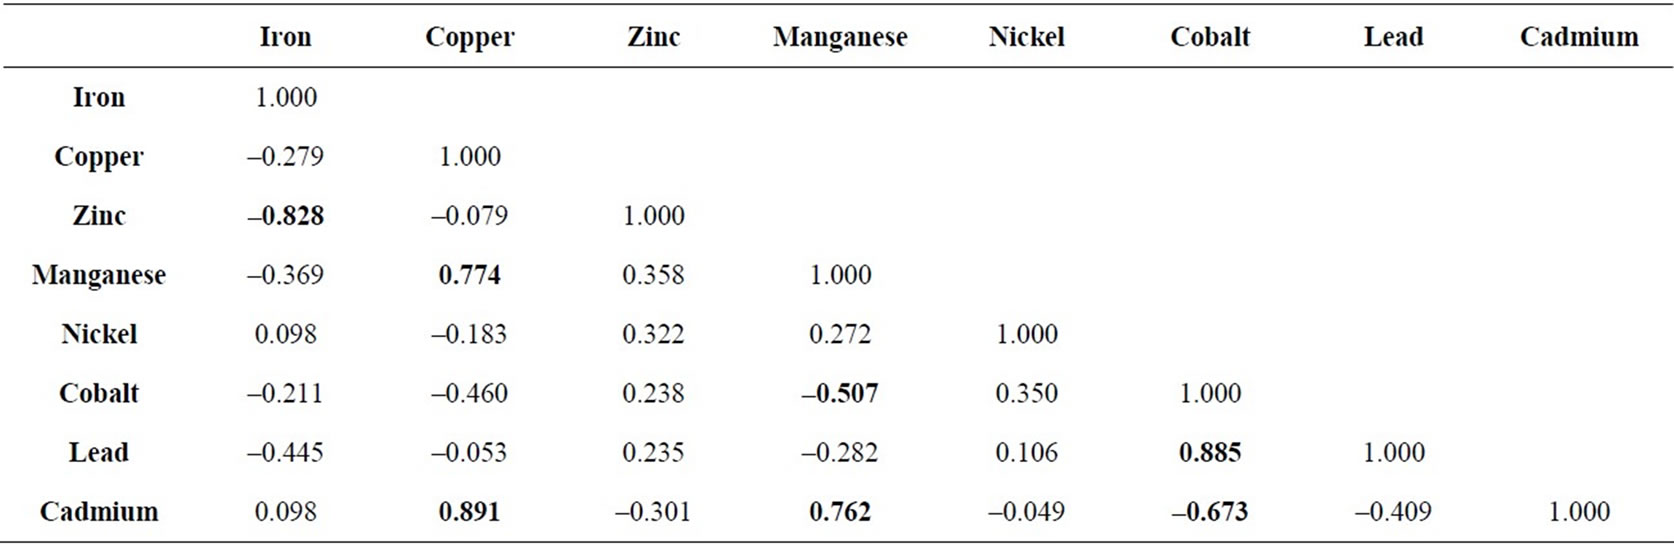
Table 2. Pearson’s correlations.
than any single variable in the standardized test score space [44].
The Principal component analysis generated four significant factors that are given in Table 3. These factors explain 99.74% of variance. Each factor consists of variable with eigen value more than 1. The factor showing maximum variance (42.2%) is assigned number one position and rest of the components is given in descending order according to the variance. The fourth component which shows least variance (12.74%) is given in the last. Those variables which have values ≥0.5 are considered significant and are discussed here.
Factor 1 shows 42% variance. The significant variables in this factor are copper, manganese cadmium, cobalt and lead. The first three variables show positive loading while cobalt and lead show negative loading (Pb - 0.65; Co - 0.882).
Factor 2 consists of zinc and manganese with positive loading and iron with negative loading. This factor shows the total variance of 29.759%.
Factor 3 comprises of nickel with total variance of 15.04%.
Factor 4 shows only 12.74% of variance and consists of lead only. This suggests the concentration of lead is consistent in the area.
4. Conclusions
It is evident from the studies carried out in relation to the prevalence of diseases and metal toxicity in Aligarh that this industrial town has a poor health record. And the quality of groundwater quality is also not good. The present study concludes that the concentration of the trace elements i.e., nickel, iron, lead, and cadmium in the drinking water of the study area is higher than the permissible limits established by the World Health Organization (2006). This high concentration may be causing the detrimental effect on the inhabitants of the area that is evident from the poor health status. The statistical analysis of the trace elements also shows that certain elements that are causing damages have a positive correlation with each other. So, the increase of one element may increase the concentration of other element in the present conditions.
The present study had its limitations. Therefore to have more conclusive results it is suggested that: water quality evaluation with special emphasis to trace elements should be carried out on a monthly basis. The soil and the crops cultivated in the surrounding of the town which is consumed by the locals have to be evaluated to find the concentration of trace elements in them. In the absence of any relevant data base in the Public health departments a questionnaire is to be prepared to assess the inhabitant’s health status at regular intervals. This questionnaire should also take feedback from the local private clinical practitioners. A more comprehensive correlation between presence of trace elements in the drinking water and prevalent diseases shall be made to come to a final decision that it is the polluted drinking water that is causing poor health in the town. Safety measures have to be applied to protect the health of the inhabitants.

Table 3. Principal component analysis Component Matrix.
5. Acknowledgements
The author is thankful to Prof. Robert Bob Finkelman of University of Texas, for helping in bringing out the paper in the present form. The author is also grateful to Dr. Shadab Khursheed, Chairman, Department of Geology, A.M.U. Aligarh for providing necessary facilities.
REFERENCES
- J. G. Arnason and B. A. Fletcher, “A 40+Year Record of Cd, Hg, Pb, and U Deposition in Sediments of Patroon Reservoir, Albany Country, NY, USA,” Environmental Pollution, Vol. 123, No. 3, 2003, pp. 383-391. doi:10.1016/S0269-7491(03)00015-0
- H. M. V. M. Soares, R. A. R. Boaventura, A. A. S. C. Machado and J. C. G. Esteves da Silva, “Sediments as Monitors of Heavy Metal Contamination in the Ave River Basin (Portugal): Multivariate Analysis of Data,” Environmental Pollution, Vol. 105, No. 3, 1999, pp. 311- 323. doi:10.1016/S0269-7491(99)00048-2
- H. Yang and N. Rose, “Trace Element Pollution Records in Some UK Lake Sediments, Their History, Influence Factors and Regional Differences,” Environment International, Vol. 31, No. 1, 2005, pp. 63-75. doi:10.1016/j.envint.2004.06.010
- J. E. Bunnell, R. B. Finkelman, J. A. Centeno and O. Selinu, “Medical Geology: A globally Emerging Discipline,” Geologica Acta, Vol. 5, No. 3, 2007, pp. 273-281.
- R. B. Finkelman, “Health Impacts of Coal: Facts and Fallacies,” A Journal of the Human Environment, Vol. 36. No. 1, 2007, pp. 103-106.
- O. Selinus and D. Frank, “Environmental Medicine,” 2000. http://en.wikipedia.org/wiki/Environmental_medicine
- World Bank, “Health and Environment,” Background Paper for the World Bank Environment Strategy, Washington, 2000.
- S. A. Hanif, A. Rahman and S. J. Rizvi, “A Study of Occupation-Related Lead Toxicity in Lock Factory Workers in District Aligarh,” Journal of Forensic Medicine & Toxicology, Vol. 24, No. 2, 2007, pp. 36-39.
- A. Rahman, “Assessing Income-Wise Household Environmental Conditions and Disease Profile in Urban Areas: Study of an Indian City,” Geo Journal, Vol. 65, No. 3, 2006, pp. 211-227. doi:10.1007/s10708-005-3127-y
- Down to Earth, 2008. http://www.downtoearth.org.in/
- T. A. Khan and M. S. Ahmad, “Micro-Level Hydrogeological Studies in Parts of Central Ganga Basin-Aligarh, U.P., India,” Asian Profile, Vol. 30, No. 3, 2002, pp. 221-231.
- M. L. Brusseau and G. R. Tick, “Subsurface Pollution,” 2nd Edition, Academic Press, Boston, 2006, pp. 259-278.
- World Health Organization, 2006. http://www.who.int/water_sanitation_health/dwq/fulltext.pdf
- A. S. Prasad, A. Miale, Z. Farid, H. H. Stanstead and A. R. Schubert, “Zinc Metabolism in Patients with the Syndrome of Iron Deficiency Anemia, Hepatosplenomegaly, Dwarfism and Hypogonadism,” Journal of Laboratory and Clinical Medicine, Vol. 61,1975, pp. 537-549.
- T. A. Khan and M. A. Abbasi, “Effect of Trace Elements on Human Metabolism and Their Presence in the Potable Water of Ganga-Nim Sub Basin, India,” Water Resources, Vol. 31, No. 4, 2004, pp. 588-591.
- V. F. Fairbanks, J. L. Fahey and E. Beutler, “ClInical Disorders of Iron Metabolism,” 2nd Edition, Grune and Stratton, New York, 1971, p. 486.
- World Health Organization, “Guideline for Drinking Water Quality,” World Health Organization, Genewa, 1984.
- World Health Organization, “Environmental Health Criteria for Cadmium,” Ambio, Vol. 6, 1977, pp. 287-290.
- M. Fleischer, A. F. Sarofim and D. W. Fassett, “Environmental Impact of Cadmium, a Review by the Panel on the Hazardous Traces Substance,” Environmental Health Perspectives, Vol. 7, 1974, pp. 253-323. doi:10.1289/ehp.747253
- L. Friberg, M. Piscator and G. Nordberg, “Cadmium in the Environment,” 2nd Edition, CRC Press, Cleveland, 1971.
- J. R. Dipalma, “Drills Pharmacology in Medicine,” McGrawhills Book Company, New York, 1965.
- L. Friberg, T. Kjellstrom, G. Nordberg and M. Piscator, “Cadmium in the Environment. III: A Toxicological and Epidemiological Appraisal,” U.S. Environmental Protection Agency, Environmental Protection Series, EPA-650/ 2-75-049, Washington D.C., 1975.
- H. A. Schroeder, J. J. Balassa and W. H. Vinton Jr., “Chromium, Cadmium and Lead in Rats: Effects on Life Span, Tumors and Tissue Levels,” Journal of Nutrition, Vol. 86, 1965, pp. 51-66.
- J. E. McKeeand and H. W. Wolf, “Water Quality Criteria,” 2nd Edition, Water Resources Control Board Publication n.-A. The Resources Agency of California State, Sacramento, 1963.
- O. Selinus, “Medical Geology: An Emerging Speciality,” TERR/E, Vol. 1, No. 1, 2004, pp. 8-15.
- A. P. Avtsyn, A. A. Zhavoronkov, S. A Rish and L. S. Strochkova, “Mikroelementozy Cheloveka (Human Microelementoses),” Meditsina, Moscow, 1991.
- M. Y. Shkol’nik, “Mikroelementy v Zhizni Rastenii (Trace Elements in the Life of Plants),” Nauka, Leningrad, 1974.
- V. K. Kashin and G. M. Ivanov, “Copper in Natural Waters in Transbaikalia,” Water Resources, Vol. 35, No. 2, 2008, pp. 228-233. doi:10.1134/S0097807808020127
- E. Eikhenberger, “Relationships between the Demand for and Toxicity of Metals in Aquatic Ecosystems, in Nekotorye Voprosy Toksichnosti Ionov Metallov (Some Issues of the Toxicity of Metal Ions),” Mir, Moscow, 1993, pp. 62-87.
- I. P. Kondrakhin, “Alimentarnye i Endokrinnye Bolezni Zhivotnykh (Alimentary and Endocrine Illnesses of Animals),” Agropromizdat, Moscow, 1989.
- S. B. Vohra and J. W. Dobrowolski, “New Horizons of Health Aspects of Elements,” Jamia Hamdard University, New Delhi, 1990.
- J. Opienska-Blauth and Z. Stanskiewicz, “Skaldniki Mineralen W Rodiwisku Czowieda, Problemy (Polish),” 1979, p. 8.
- P. Karlson, “Zarys Biochemil,” PWN, Warszawa, 1987.
- R. Passmore, N. Rao and R. M. Nicole, “Handbook on Nutritional Requirements,” World Health Organization, Genewa, 1974.
- D. R. Helsel and R. M. Hirsch, “Statistical Methods in Water Resources,” 2002. http://pubs.usgs.gov/twri/twri4a3/
- J. C. Davis, “Statistics and Data Analysis in Geology,” 2nd Edition, John Willey and Sons, New York, 1986.
- D. Love and D. K. Hallbauer, “Groundwater Chemistry Trends and Possible Interventions at a Southern African Iron Ore Mine,” Journal of African Earth Sciences, Vol. 31, 2000, pp. 41-42.
- I. Olmez, J. W. Beal and J. F. Vilaaume, “A New Approach to Understanding Multiplesource Groundwater Contamination: Factor Analysis and Chemical Mass Balances,” Water Research, Vol. 28, No. 5, 1994, pp. 1095-1101. doi:10.1016/0043-1354(94)90195-3
- R. Reghunath, T. R. S. Murthy and B. R. Raghavan, “The Utility of Multivariate Statistical Techniques in Hydrogeochemical Studies: An Example from Karnataka, India,” Water Research, Vol. 36, No. 10, 2002, pp 2437- 2442. doi:10.1016/S0043-1354(01)00490-0
- C. Subbarao, N. V. Subbarao and S. N. Chandu, “Characterisation of Groundwater Contamination Using Factor Analysis,” Environmental Geology, Vol. 28, No. 4, 1995, pp. 175-180. doi:10.1007/s002540050091
- S. Wold, K. Esbensen and P. Geladi, “Chemometric and Intelligent Laboratory Systems,” Chemometrics and Intelligent Laboratory Systems, Vol. 2, No. 1-3, 1987, pp. 37-52. doi:10.1016/0169-7439(87)80084-9
- I. M. Farnham, K. H. ohannesson, A. K. JSingh, V. F. Hodge and K. J. Stetzenbach, “Factor Analytical Approaches for Evaluating Groundwater Trace Element Chemistry Data,” Analytica Chimica Acta, Vol. 490, No. 1-2, 2003, pp. 123-138. doi:10.1016/S0003-2670(03)00350-7
- N. Mazlum, A. Ozer and S. Mazlum, “Interpretation of Water Quality Data by Principal Component Analysis,” Turkish Journal of Engineering & Environmental Sciences, Vol. 23, 1999, pp. 19-26.
- E. M. Andrade, H. A. Q. Palácio, L. A. Crisóstomo, I. H. Souza and A. S. Teixeira, “Índice de Qualidade de Água, Uma Proposta Para o Vale do rio Trussu,” Ceará. Revista Ciência Agronômica (in Portuguese), Vol. 36, No. 2, 2005, pp. 135-142.