Journal of Water Resource and Protection
Vol. 2 No. 12 (2010) , Article ID: 3512 , 11 pages DOI:10.4236/jwarp.2010.212126
Hydrogeochemical and Groundwater Quality Studies in the Northern Part of the Densu River Basin of Ghana
1Department of Chemistry, National Nuclear Research Institute, GAEC, Ghana
2Graduate School of Nuclear and Allied Sciences, Legon, Ghana
3Department of Physics, National Nuclear Research Institute, GAEC, Ghana
4AVRL Accra west, Weija Water treatment Plant, Ghana
E-mail: gibrilla2abass@yahoo.co.uk
Received October 1, 2010; revised November 6, 2010; accepted December 2, 2010
Keywords: Aquifer, Hydrogeochemical, Weathering, Densu River, Ion-Exchange
ABSTRACT
Agriculture, rapid urbanization and geochemical processes have direct or indirect effects on the chemical composition of groundwater and aquifer geochemistry. Hydrochemical investigations which are significant for assessment of water quality have been carried out to study the source of dissolve ions in the groundwater in some rural communities in the northern part of the Densu River basin. Twenty six samples comprising of twenty one boreholes, one hand-dug well and four surface waters were sampled for this study. The samples were analyzed in-situ for pH, Conductivity and salinity using a Hach potable meter, bicarbonate using a digital titrator. Major ions such as Na+, Ca2+, K+, SO42-, NO3-, Cl- etc were analyzed using ion-chromatography, flame photometer and Atomic Absorption spectrometer. The results showed that the groundwater in the study area are fresh and low in TDS (49.5-361 mg/l) and generally mildly acidic to alkaline (pH 5.57-7.48). The ground water quality of the study area are suitable for domestic purposes, since most of the parameters measured were within the WHO recommended values for drinking water, with the exception of nitrate (NO3--N which showed an elevated concentration in most of the samples (about 60%). Higher concentrations of NO3-, Cl-, SO42- etc were observed at the middle portion of the basin where there is extensive agriculture and rapid urbanization. The Piper diagram shows three major water types namely Na-Cl or Na-HCO3-Cl, Na-Mg-Ca-HCO3 and Na-HCO3 water types and Ca-Mg-HCO3 as minor about (8%) which are moderately mineralized. Ion-exchange, Weathering, Oxidation and Dissolution of minerals were found to be the major geochemical processes governing the groundwater evolution in the study area.
1. Introduction
Water is abundant on the planet as a whole, but fresh potable water is not always available at the right place in the right quantity for human or ecosystem use. The importance of water is underscored by the fact that many great civilizations sprung along or near water bodies. The development of water resources has often been used as yardstick for socio-economic and health status of many nations worldwide. Predictions from the Ghana Water Resources Commission allude to increases in the consumption of fresh water by almost 27%. It is predicted that by the turn of the next century, water shortages will become more widespread [1] due to pollution, urbanization and agriculture.
The Densu River is one of the important rivers in Ghana which has attracted a lot of interest due to its socioeconomic and environmental importance; it serves as a source of potable water supply for the western part of Accra the national capital of Ghana and Koforidua and its surrounding communities. Most communities along the river which do not have access to potable water relies solely on the raw water from the Densu River which is one of the most heavily polluted rivers in Ghana and well noted for its water quality deterioration [2]. This is as result of human or anthropogenic activities such as urbanization, industrialization, agricultural activities (enhance use of fertilizers, improper land use, use of agrochemicals and fishing with chemicals). In some cases the extent of pollution of the river is so severe that the waters can not sustain aquatic life and also make treatment of the water expensive [3,4]. The Densu river basin is recently experiencing an accelerating land degradation resulting in erosion, siltation of the river channel and consequently flooding. It further developed into a situation of occasional water shortages in an otherwise perennial river system. Consequently there has been a huge dependence on groundwater by major industrial establishment and communities as source of potable water through the drilling of many boreholes and hand-dug wells [5]. Since groundwater is not immune to pollution and activities such as mechanized agricultural practices, rapid urbanization as well as domestic and industrial waste can pose a serious threat to the groundwater potential in the Basin. In some cases poor productivity of wells or sometimes poor quality is also responsible for unsuccessful provision of the groundwater.
To sustain and maximize the benefit of this resource, knowledge about the natural hydro-geological and geochemical processes, as well as associated human effects on the groundwater resource is required for a comprehensive and complete scientific understanding of the vulnerability of the aquifers to pollution.
This study will seek to understand the chemical evolution of the aquifers, groundwater quality and characterize the groundwater system using hydrochemical methods to identify the relevant water-rock interaction.
2. Materials and Methods
2.1. Study Area
2.1.1. Location and Drainage
The Densu River Basin has a typical rain forest zone at north-west of Koforidua and forms part of the coastal river basins of Ghana, The River takes its source from the Atewa Range of hills near Kibi in the Eastern Region of Ghana. It lies between latitude 5030’N and 6020’N and longitudes 0010’W to 0035’W. The river shares its catchments boundary with the Odaw and Volta basins to the east and north respectively, the Birim basin in the northwest and the Ayensu and Okrudu in the west. The main tributaries include rivers Adeiso, Nsakyi, Dobro and Kuia [6]. The Densu river Basin covers a total area of about 2564 km2 and the river covers a total distance of about 116 km form the source to the point where it enters the sea (Gulf of Guinea) through a small delta (Sakumo tidal lagoon) at Botianor, west of Accra.
2.1.2. Hydrogeology and Groundwater Occurance
The basin is underlain mainly by the Proterozoic basin-type granitoid (called Cape Coast batholiths), granite with associate gneiss (Figure 1). This geological formation covers a larger part of the basin (90%) and is composed of quartz, muscovite, schists gneisses, orthoclase and albite. These gneissic rocks are intruded by both acidic and basic igneous rocks, which include white and pink pegmatite, aplites, granodiorite and dykes. The other formations are the Birimian formation, which occurs at the watershed of the river in the northwest and consist of sandstones, tuffs, grit, quartzites and some breccia. The Togo formation underlies the southeastern portion and the area south of Weija to the estuary portion of the basin made up of sandstone, quartzite and quartz schist, shale, phyllite and some talc mica schist [7].
The basement rocks underlying about 90% of the basin have very little intergranular pore-space and are thus characterised by little or negligible primary porosity and permeability. This means that the rocks are cemented to a degree that the hydrogeological meaning of the original porosity in the rock has lessened and the major part of the groundwater flow occurs in secondarily formed structures, mostly fractures, joinings, shearings, and deep weathering in the rocks [7,8]. The secondary porosity and flow guiding structures have, as a rule, mainly been created by tectonic processes such as folding, mineral orientation (foliation), fracturing and faults (displacement along fractures), shrinking during cooling of rock mass and weathering [7,9]. The development of the secondary porosity gives rise to two distinct types of aquifers in the basin, i.e. the fractured zone aquifer and the weathered zone aquifers.
The fractured zone aquifers develop in the bedrock at depth of about 20 m or more below ground surface, they tend to be localized in nature and groundwater occurrences are controlled by degree of fracturing and the nature of groundwater recharge. Borehole yields within the fractured zone are determined by the extent and degree of fracturing [10]. Transmisivity varies between 1 and 72 m2/day.
The thickness zone varies greatly depending on the climatic conditions of the rocks and ranges between 4 to 20m as a unit [11]. In most communities, the weathered zone aquifer is developed for water supply by hand dug wells [12]. But most of these wells dry up during the dry season. The thick weathered zones occur in the forested area in the basin. A formation which combines the thick weathered zone with well fractured bedrock provides the most productive aquifers.
The Birimian formation to the northwestern portion of the basin are generally well folded and deeply weathered, hence groundwater occurrence in this formation is very high. The granites in the basin are less fractured and weathered, hence groundwater occurrence are moder
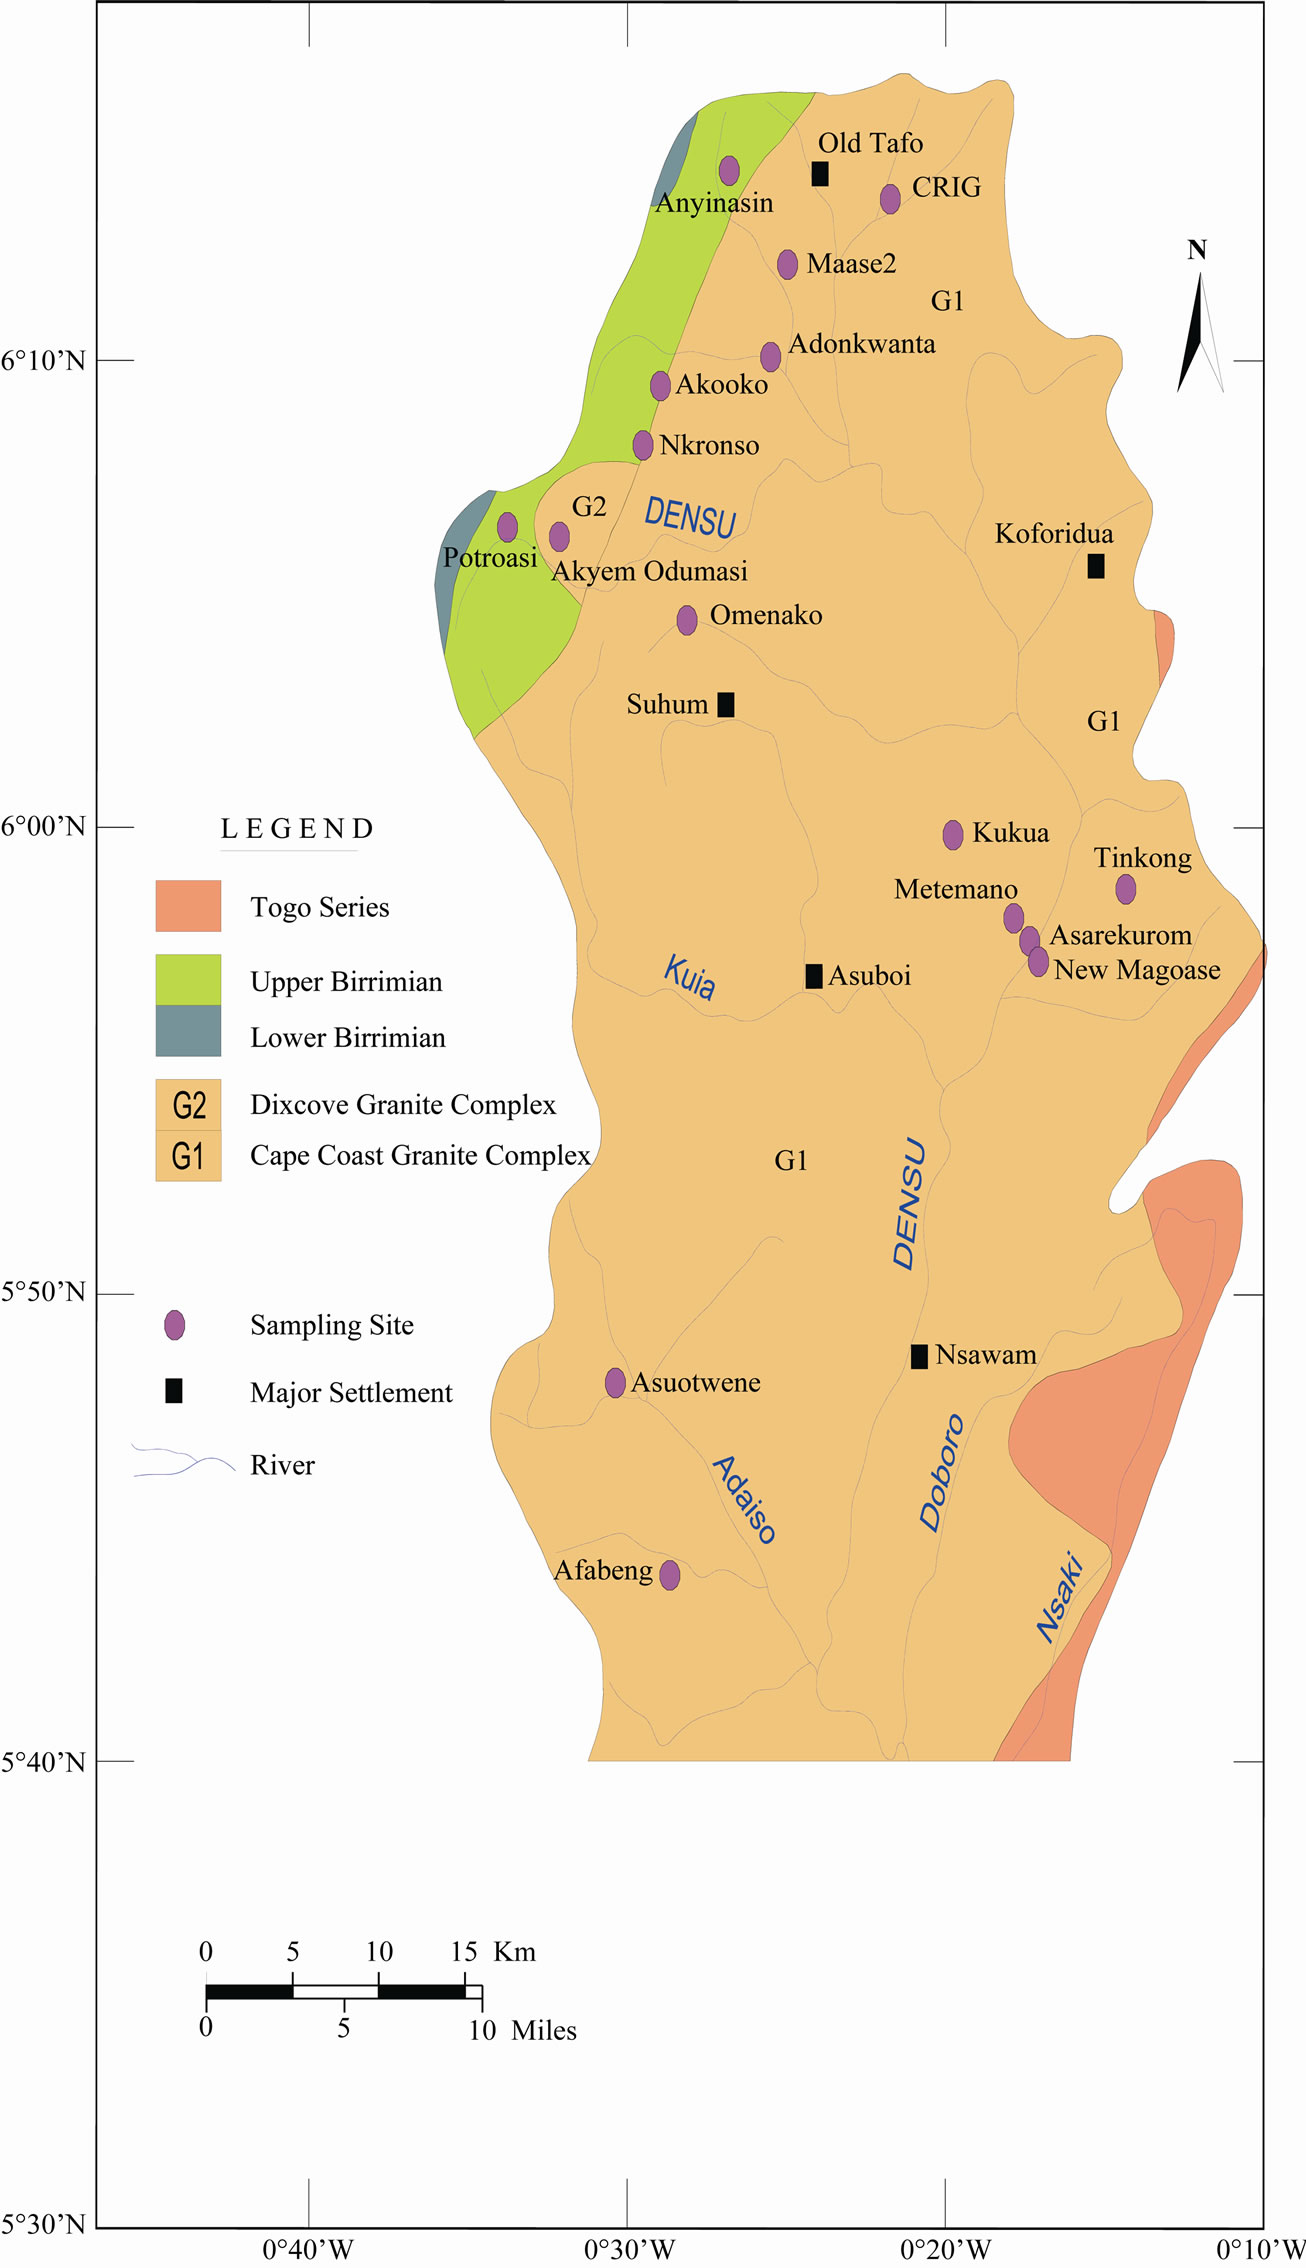
Figure 1. Geological and sampling site of the study area.
ately low. The granitic aquifers thus formed are usually phreatic to semi-confined in character, structurally dependent and often discontinuous in occurrence [10,11].
However, in the northern portion of the granitic formation relatively high productive wells exist. The Togo formation in the Southeastern portion of the basin is highly folded, jointed and fractured. The contact zone between the granites and the Togo formation provides a favourable condition for groundwater accumulation. The thickness of the mean weathered zone ranges from 1.0 and 32.0 m, 5.0 and 27.0 m and 3.0 and 36.0 m in the granites, Birimian and Togo series respectively. The depth of the borehole varies from 9.1 to 103.0 m in the granites, 23.0 to 40.0 m in the Birimian and 28.0 to 97.0 m in the Togo series [13]. Borehole yields are highly variable and lie in the range of 0.1-30.0 m3 h-1 with mean value of 2.0 m3 h-1 in the granite. In the Togo and the Birimian borehole yields are within 0.6-6.0 m3 h-1and 0.7-9.0 m3 h-1 with the mean values of 2.8m3 h-1 and 3.7 m3h-1 respectively [11]. However, borehole yields vary from location to location and the chemistry of the groundwater also varies from well to well. The general direction of groundwater is estimated to be from the northern portion of the basin towards the southern portion [14].
During the wet seasons, the water table generally gets higher supplying water to a number of shallow wells. This also permits the movement of fresh recharge water beyond the weathered zone into the fractured aquifer, particularly in places where there is hydraulic continuity between the weathered zone and the underlying fractures or fissures [10].
2.2. Methodology
A total of twenty one boreholes and hand-dug well and four surface water (River Densu) were sampled at various locations (Figure 1). All the water samples were collected in 500ml pre conditioned high density polyethylene bottles. They were conditioned by washing initially with five (5%) percent nitric acid, and then rinsing several times with distilled water. This was carried out to ensure that the samples bottles were free from contaminants.
At the sampling points, the boreholes were pumped until the pH was constant in order to purge the aquifer of stagnant water to acquire fresh aquifer samples for analysis.
Most the wells were being used for domestic water supply and were being pumped during the sampling period therefore purging mostly lasted for 5-10 minute.
The samples earmarked for ion analysis were filtered on site through 0.45 µm cellulose filters with the aid of a hand operated vacuum pump. The bottles and caps meant for collecting major ions were rinsed three times with the filtered water after which they were filled to the brim and caped. Samples for cations analysis were preserved with few drops of Merk ultra pure nitric acid to a pH < 2.
All the samples were then kept in an ice chest containing ice blocks and transported to the laboratory.
Temperature, Electrical conductivity (EC) and Total dissolve solids (TDS) measurements were conducted in situ in the field by mercury in glass thermometer, pre calibrated Metrolin model 691 pH meter and HACH conductivity meter.
HCO3- titration was done at the wellhead using a HACH digital Titrator. Sodium Na+ and potassium K+ were analyzed using flame photometer, magnesium (Mg2+), calcium (Ca2+) using Atomic Absorption Spectroscopy. Chloride(Cl-), sulphate(SO42-) nitrate(NO3-) were analyzed using ICS-90 ion chromatography at Ghana Atomic Energy Commission, department of chemistry. The ion-balance-error was computed, taking the relationship between the total cation (Ca2+, Mg2+, Na+ and K+) and the total anions (HCO3-, Cl-, SO42-) for each set of complete analysis of water samples. Only samples which fall within ±5% were reported in this work.
3. Results and Discussions
Statistical summary of the Hydrochemical parameters measured in the groundwater and surface waters were presented in Table 1. The pH of the groundwater ranges from 5.58-7.48. The lowest pH occurred at ANY while the highest pH was found at DPOT. The mean pH was 6.63. The very acidic groundwater were found in the Birimian ANY, AK, NK, POT (5.58-6.66) while in the granite where most of the samples were located, the pH are slightly acidic to neutral (5.98-7.09). This deviation can be attributed to the activities occurring in the unsaturated zone which might have effect in the groundwater before recharge since these areas are characterized by intensive agricultural activities. All the surface waters D POT, D AKD, D MAN and NS were found to have pH values very close (7.38-7.47). The WHO recommended limit for potable water is 6.5-8.5. This implies that about 42.30% of the samples fall outside the recommended range while 58.7% fall within the range.
Electrical conductivity (EC) values were generally low. Maximum and minimum values were 722µs/cm-1 and 98.8µs/cm-1 respectively, with the mean value of 305.9. Total dissolve solid (TDS) ranged from 49.5-361mg/l. According to TDS classification by Freeze and cherry [15], all the groundwater’s are fresh (TDS<1000). Major cations (Ca2+, Mg2+, Na+ and K+) were also generally low with Na+ being the most dominant cation with concentra
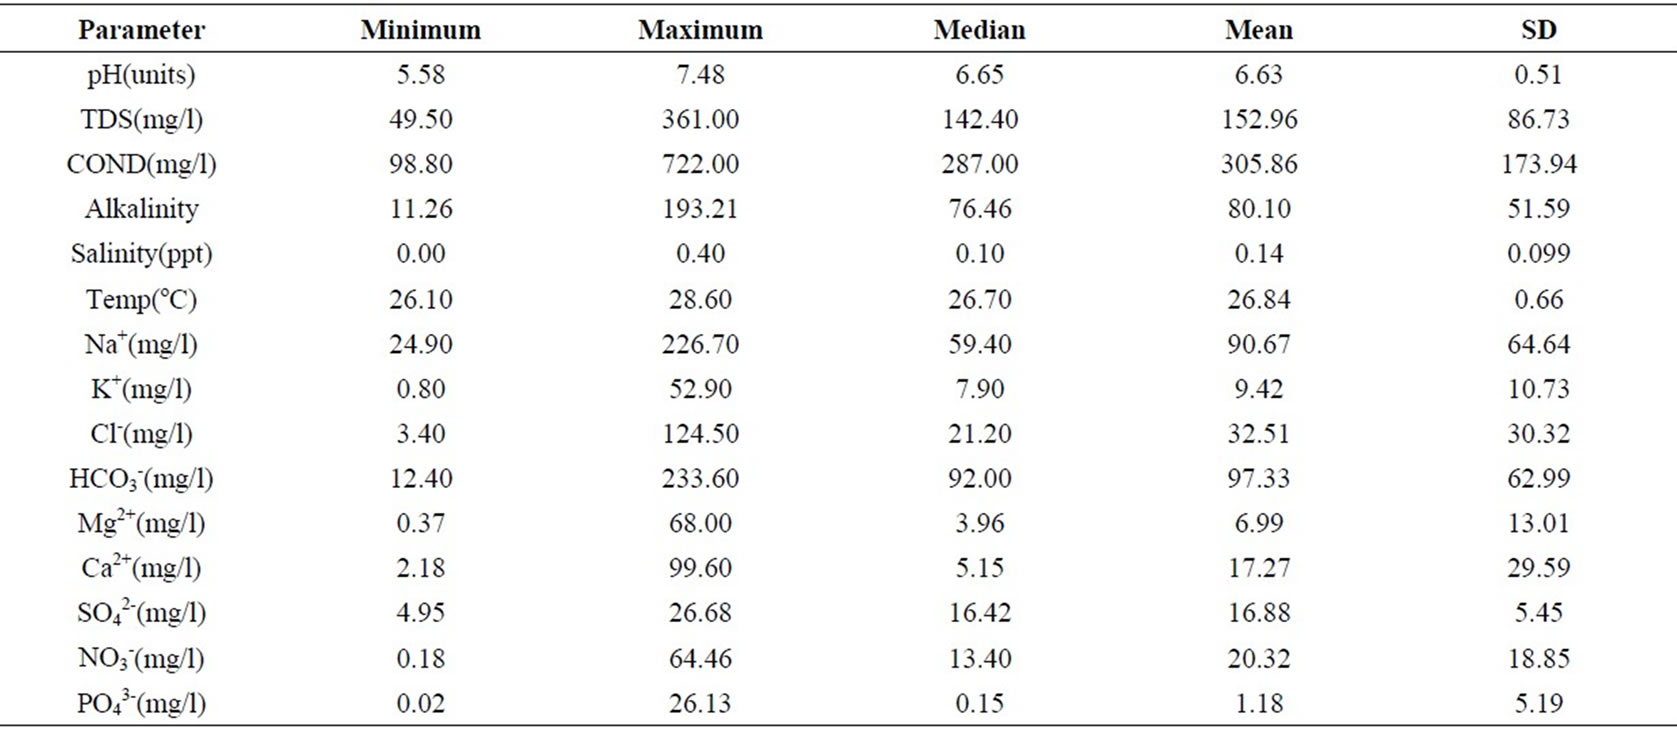
Table 1. Statistical summary of the hydrochemical parameters in the study area.
tion ranges from 59.2 - 490.05 mg/l and a mean value of 214.65 mg/l. HCO3- is also the most dominant anion with maximum and minimum values ranging from 233.6 - 12.4 mg/l respectively.
Electrical conductivity (EC) values were generally low. Maximum and minimum values were 722 µs/cm-1 and 98.8 µs/cm-1 respectively, with the mean value of 305.9. Total dissolve solid (TDS) ranged from 49.5-361 mg/l. According to TDS classification by Freeze and cherry [15], all the groundwater’s are fresh (TDS<1000). Major cations (Ca2+, Mg2+, Na+ and K+) were also generally low with Na+ being the most dominant cation with concentration ranges from 59.2- 490.05 mg/l and a mean value of 214.65 mg/l. HCO3- is also the most dominant anion with maximum and minimum values ranging from 233.6 - 12.4 mg/l respectively.
The nitrate in the groundwater varied from 0.18 - 64.46 mg/l with an average of 15.85 mg/l. Even though it has been observed that igneous rocks contain small amounts of nitrate [16], most nitrate in water comes from fertilizers, nitrification by leguminous plants and animal excreta. Industrial and domestic sources can also contribute to higher elevation of nitrate in water. Nitrogen is an essential component of protein hence occurs in all living organisms. When these materials decay through microbial activities, the complex protein changes through amino acid to ammonia, nitrite and finally nitrate. The nitrate produce may then leach to the groundwater.
Fears have been expressed that nitrate contaminated water supplies carries the risk of methaemoglobinaemia (blue-baby syndrome) and stomach cancer. The main pollution risk for the aquifers is vertical infiltration of precipitation and flushing of pollutants from the soil. About 57.7% of the samples have nitrate concentrations above the recommended value of 10 mg/l by WHO.
There was no general trend in the different geological formations; nitrate from the rocks is therefore not likely to be the source of the nitrate, but since the area is a forest zone dominated by agriculture activity and also heavily populated, higher nitrate concentrations can be attributed to decay of organic matter, nitrogen fixation, fertilizer applications and sewage.
The surface water nitrate was also observed to be almost uniform with little variation from the upper to the lower portion of the study area. This can also be attributed to run-offs, sewage and industrial effluents being discharge into the river.
SO42- and PO43- were observed to have generally low concentration ranging from 4.95-26.68 mg/l and 0.02- 26.13 mg/l respectively.
3.1. Water Types
Groundwater are grouped into facies depending on the dominant ions present [17]. Figure 2 shows the piper trilinear plot of groundwater in the study area. Three principal hydrochemical water types have been delineated. These are Na-Cl or Na-HCO3-Cl, water type I. This is the dominant water type which may apparently evolve from a combination of processes that include halite dissolution from the soil zone and evaporative concentration. These water types constitute about 40% of the groundwater samples from the area.
The second water type Na-Mg-Ca-HCO3 designated as II is the mixed water type where no particular cation dominates and HCO3 is the main anion. This occupies about 20% of the samples in the area. The third water type III is Na-HCO3- this water type constitutes about 32% of the
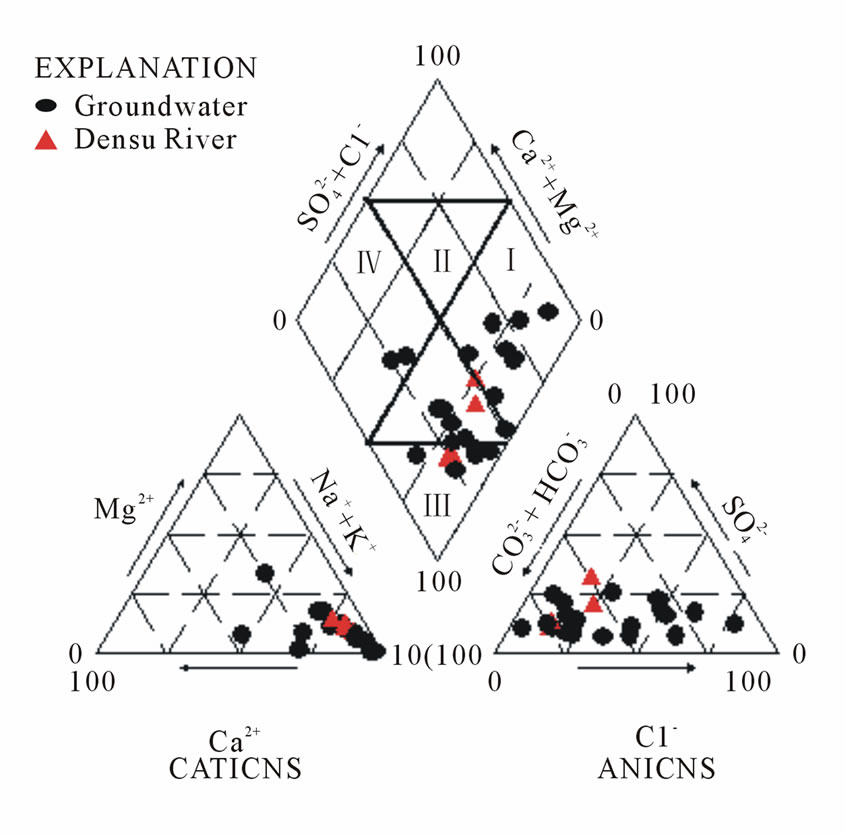
Figure 2. Piper trilinear chart of the groundwater samples.
groundwater in the area. This water type depicts rockwater interaction involving the dissolution of carbonates and feldspars by the recharging groundwater within the relatively permeable weathered zone above the underlying rocks. The geology of the study area as discuss earlier consist mainly granite, albite, schist, biotite etc. Meteoric water dissolving Na from Na-bearing silicates could also produce NaHCO3 water type.
Finally the fourth water type IV is the Ca-Mg-HCO3 which constitutes about 8% and is dominated by alkaline earths metals and weak acids.
3.2. Compositional Relation
The compositional relations among the dissolved ions can be used to assess the origin of solutes and the processes that results in water compositions. Since Ca2+, Mg2+, Na+, K+, HCO3-, Cl−, SO42-, NO3- are the observed solutes in the groundwater, an examination is made of their stoichiometric relation that could account for their sources or origin. The chemical data of the groundwater samples are plotted on Ca2++ Mg2+ vrs HCO3- diagram (Figure 3). The data was observed to fall below the equiline (1:1), with the exception of one sample, this suggests that excess alkalinity in the water has been balanced by the alkalis (Na++K+) metals. Furthermore, all the sample points were found lie below the equiline in a plot of Ca2++Mg2+ vs TC (total cations) Figure 4. This emphasized an increasing contribution of the alkalis metals to the major ions chemistry. In a plot of Na+ + K+ vs TC (Figure 5), most of the samples fall on the 1:1 equiline with few falling below, but above Na+ + K+ : 0.5 TC line. This leads to infer that the supply of cations via silicate weathering and/or soil minerals dissolution is quiet significant [18]. Whereas, the increase in alkalis metal with a simultaneous increase in Cl- , SO42- (Figure 6) (R2 =0.83) reflects a common source for these ions [19,20].
The distribution of the data in Fig. 6 also suggests that the Na+ + K+ and Cl- + SO42- are significant in the cation and anion balances; Na+ and HCO3- being especially most dominant ions. This supports the fact that major contribution of ions are from mineral dissolutions [19].
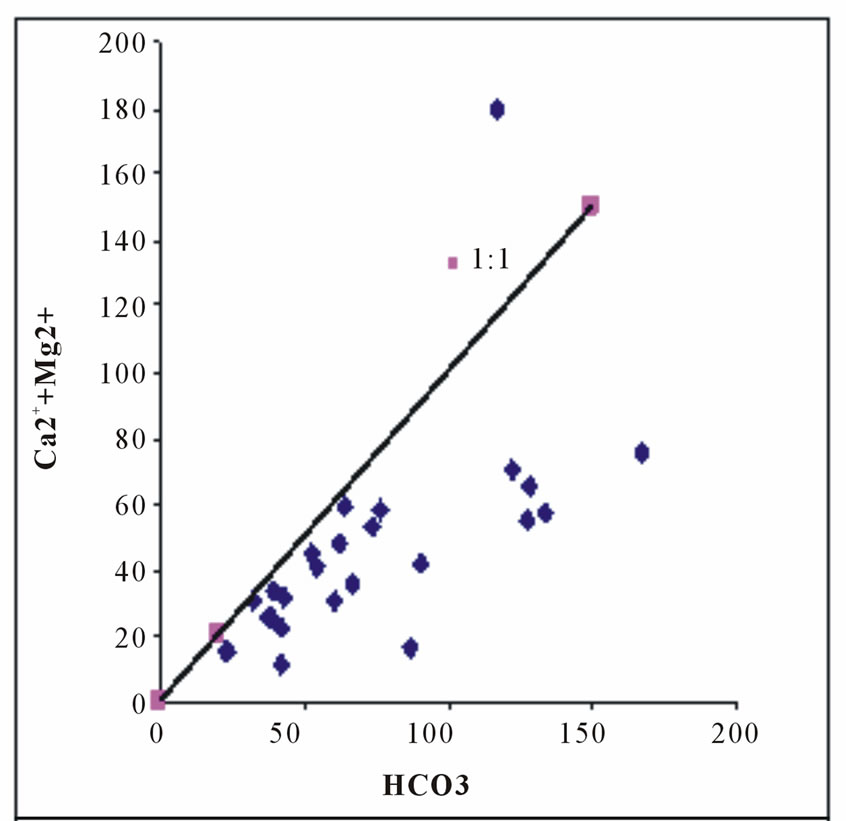
Figure 3. Ca2++Mg2+vrs HCO3.
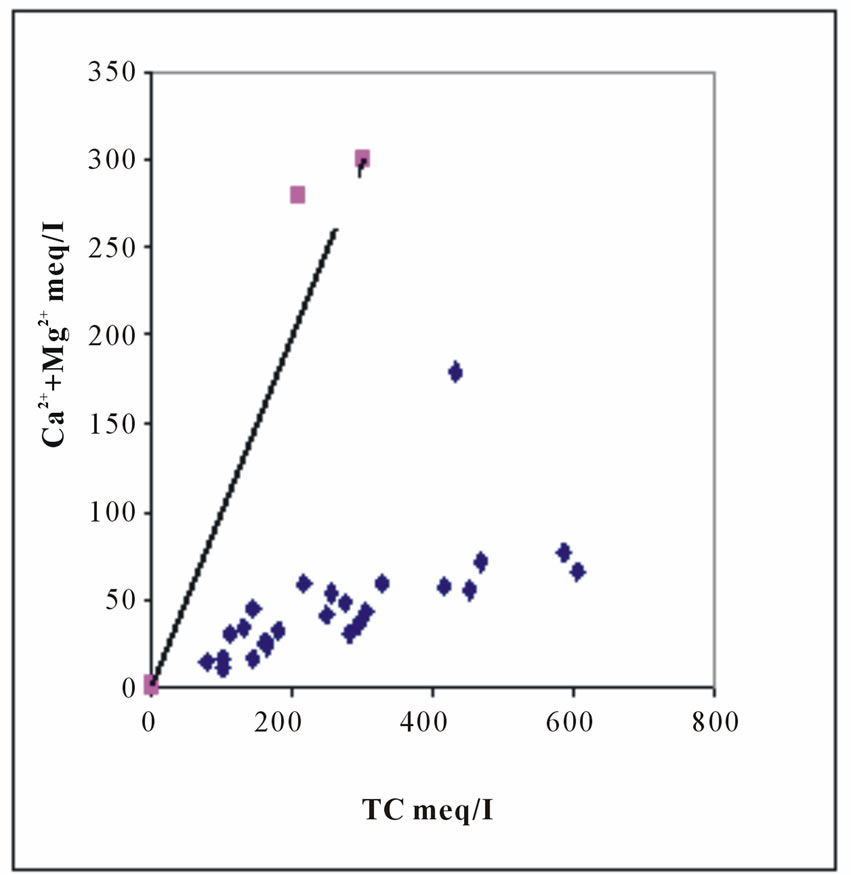
Figure 4. Ca2++Mg2+ vs. TC.
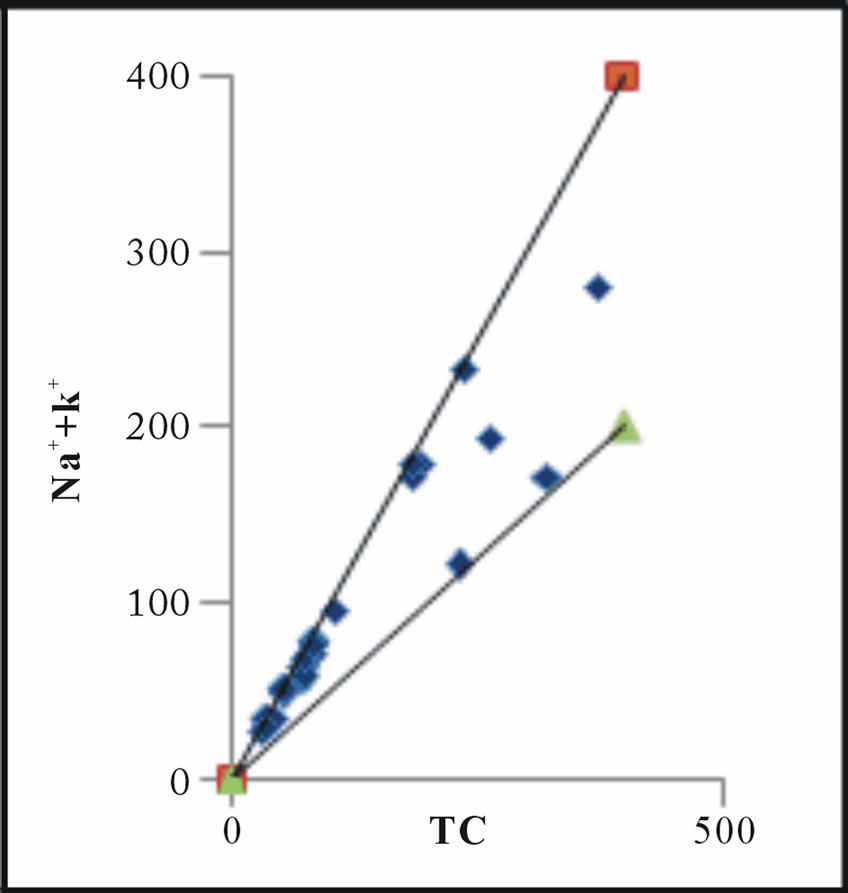
Figure 5. Na+ + K+ vs. TC.
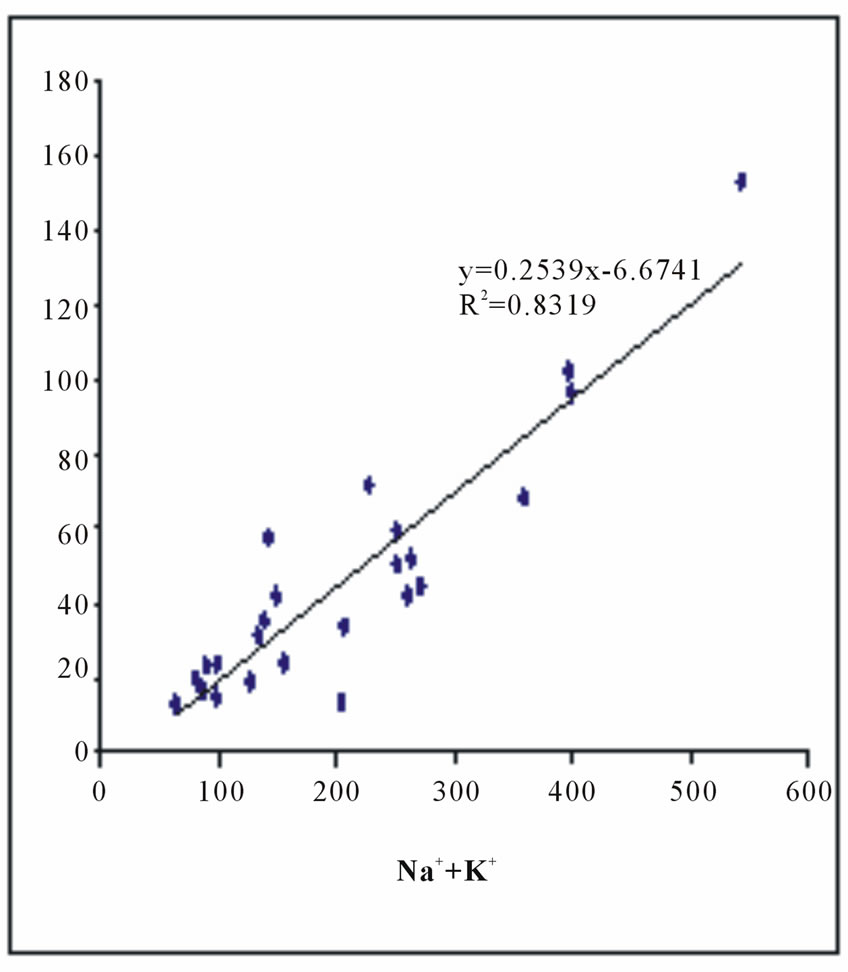
Figure 6. Na++K+ vs. Cl-+SO42-.
Most groundwater samples have Na+/Cl− ratio more and below unity with few falling on the line (Figure 7). A ratio equal to one attributes dissolution of NaCl and a ratio greater than one reflect a release of Na+ from silicate weathering [21]. The observed excess of Na+ over K+ is because of the greater resistance of K+ to chemical weathering and its adsorption on clay minerals.
Climatic condition affect the rate of evapotranspiration, hence, to examine the contribution of evaporation as an effective indicator of concentration for further enrichment of dissolved ions in the groundwater.
The groundwater samples were plotted in Na+/Cl− vs EC diagram, the points were found to spreads horizontally (Figure 8). This means that the Na+/Cl− ratio does not change significantly with the increase of EC. Therefore, the process of evapo-transpiration, as suggested by Jankowski and Acworth [22] might not the main cause of the increase of Na+ and Cl− ions concentrations in the groundwater.
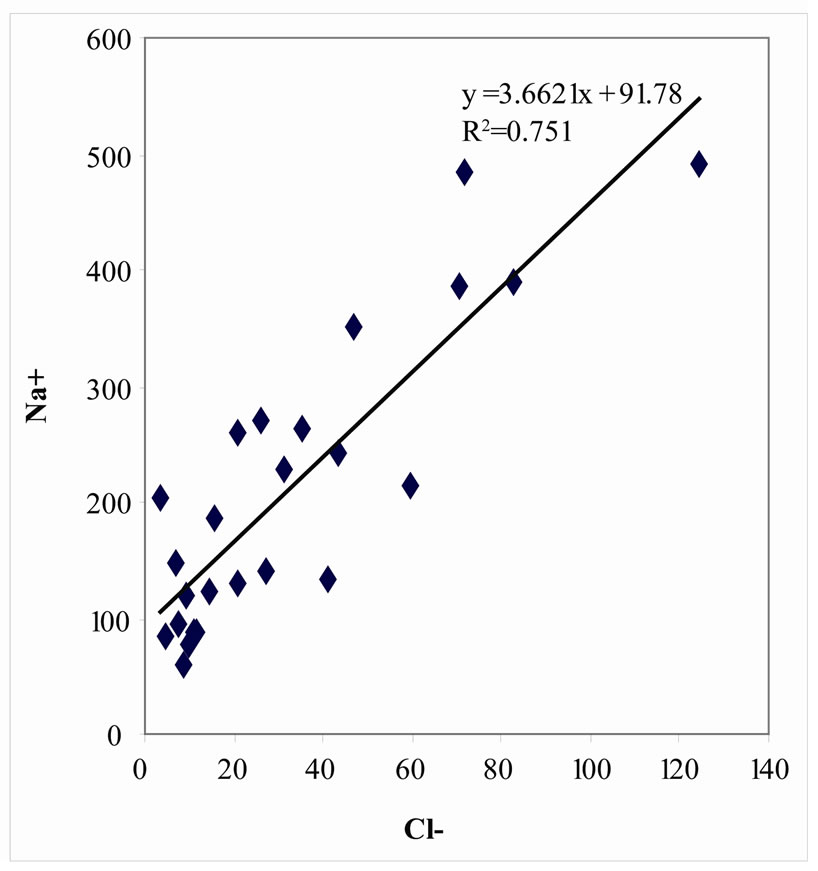
Figure 7. Na+ vrs Cl-..
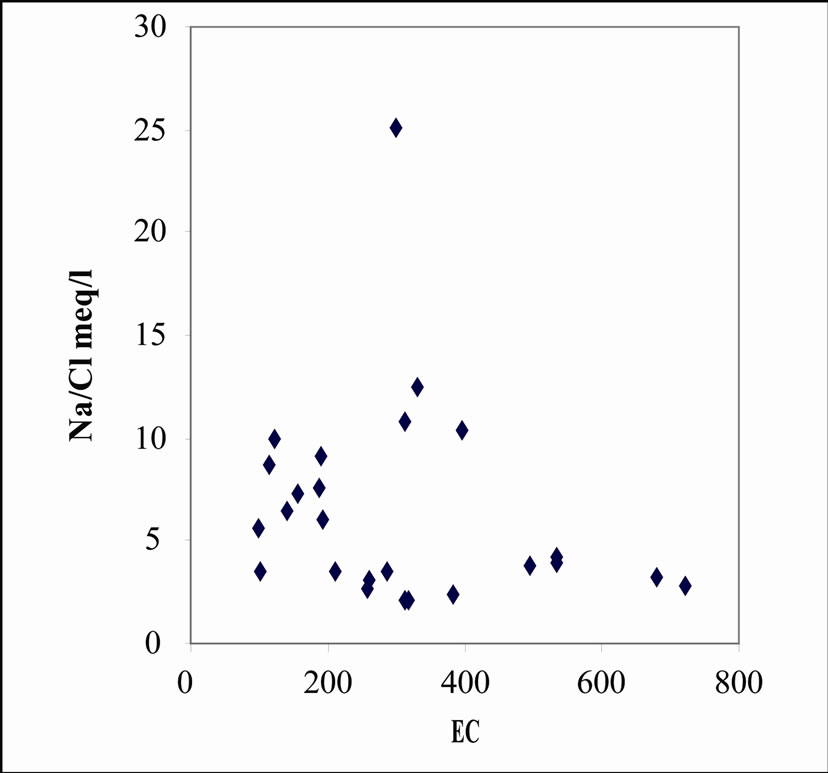
Figure 8. Na+/Cl− vs. EC.
3.3. Cation-Exchange
Cation exchange is a regulation factor of ionic concentrations in the water that plays a role as a temporary buffer when the ionic contents are variable, causing non-steady-state conditions [23]. The exchangeable cations on exchange sites tend to compensate for the variations of the chemical composition of waters, modifying considerably the cationic concentrations [24]. The observed increase in Na+ concentration without an associated increase in Cl− concentration can be explained by this process [25].
The evidence for ion exchange in the development of salinization can lead to release of Na+ from clay products replacing Ca2+ that is present in groundwater. Figure 9 shows a plot of Na+ against Ca2+, the data plot above 1:1 line signifying that there is an excess of Na+ over Ca2+, this may be due to the proximity of the wells to the clay horizons. Ion exchange process therefore appears to be responsible for higher concentration of Na+ in the groundwater. To further test for the possibility that cation exchange significantly affects groundwater composition a plot of Ca2+ + Mg2- - HCO3- - SO42- as a function of Na+– Cl− were examined. Na+– Cl− represents the amount of Na+ gained or lost relative to that provided by chloride salt dissolution (mostly halite dissolution), while Ca2+ + Mg2- - HCO3- - SO42- represents the amount of Ca2+ and Mg2+ gained or lost relative to that provided by gypsum, calcite and dolomite dissolution. If these processes are significant composition controlling process, the relationship between these two parameters should be linear with a slope of -1. Figure 10 indicates an increase in Na+ related to a decrease in Ca2+ + Mg2+ or an increase in HCO3- + SO42- . Data plots are close to a straight line (r2 = 0.82) with the slopes of from -1.03 indicating that Na+, Ca2+ and Mg2+ participate in the ion exchange reaction [25].
3.4. Weathering
Mineral weathering can contribute to the groundwater chemistry Kim et al. [27] suggested that the 1:1 ratio would be maintained between total cation and alkalinity when mineral weathering is the major process affecting the groundwater chemistry. Feldspar and carbonates are the most important minerals regulating the chemistry of natural waters from the standpoint of reactivity and abundance in the earth’s crust [28,29]. Feldspars such as plagioclase and K-feldspar occupy about 58% of the earth’s crust and is reactive relative to other silicate minerals [27]. In addition, carbonate minerals such as calcite and dolomite largely influence the water chemistry if they are present in the geological material because their
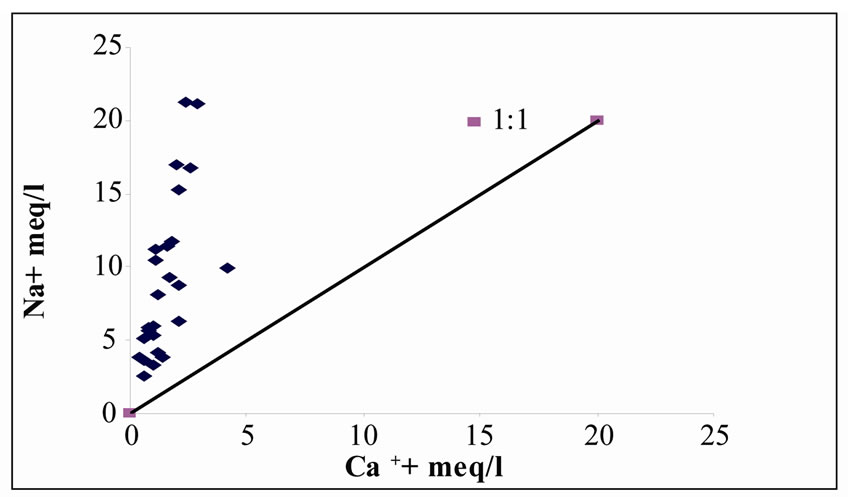
Figure 9. Relationship between Ca2+ and Na+ in the study area.
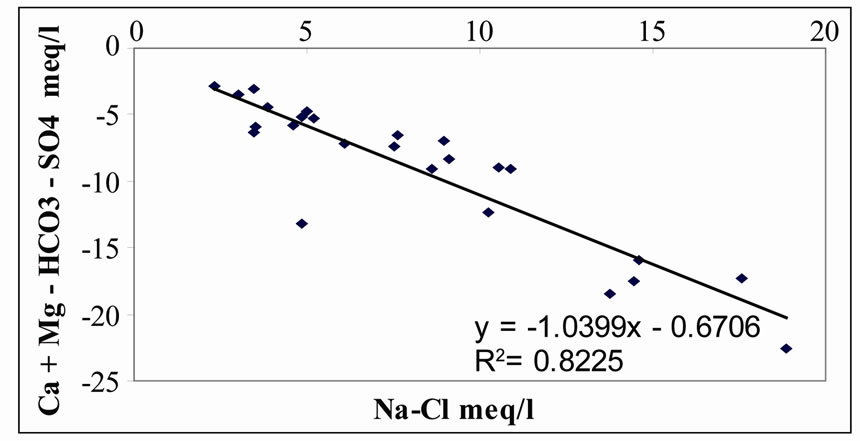
Figure 10. Relation ship between Ca2+ + Mg2- - HCO3- - SO42 and Na+-Cl- in the study area.
dissolution rates are up to six orders of magnitude faster than those of alumino-silicate minerals [30]. As a result, the 1:1 relationship between total cation and alkalinity can be used as an indicator for the influence of mineral weathering on water chemistry. Figure 11 show the relationship between total cation and alkalinity. The samples are close to the 1:1 mineral dissolution lines with R2 = 0.8592, indicating that dissolution of minerals in the groundwater is an important geochemical process governing the chemistry of the groundwater.
3.5. Oxidation Process
The chemistry of groundwater is also likely to be significantly influenced by other chemical processes, such as oxidation of ammonium and/or organic matters. This oxidation process is one of the suggested reasons for the deviation from the mineral dissolution lines. To determine how much of the total water chemistry can be explained by the proposed processes, a mass balance analysis was performed, using the method suggested by Kim et al. [27].
The oxidation of ammonium and organic matter increases the NO3- concentration by decreasing alkalinity and therefore, the total cation concentrations become unbalanced by alkalinity. The influence of Cl-salts also
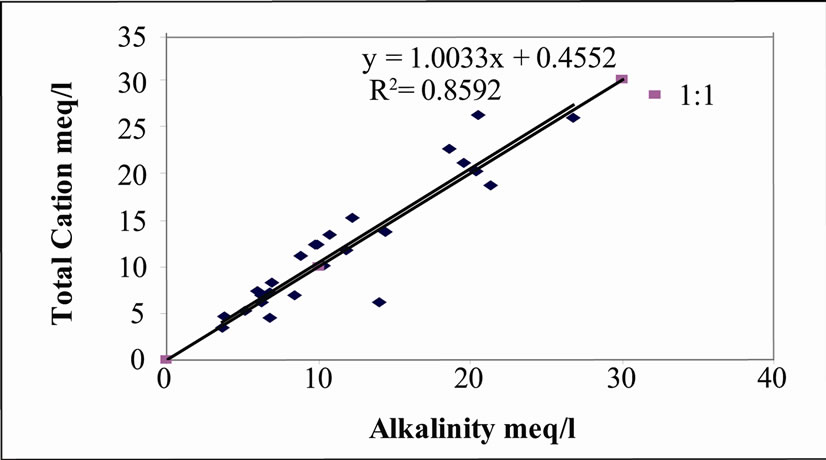
Figure 11. Relationship between Alkalinity and total cation in the study area.
causes the upward deviation from the mineral dissolution line by supplying additional cations without changing alkalinity. Therefore, the total cation concentrations were corrected for the effects of ammonium oxidation and Cl-salt.
As the equivalent ratio between total cation and Clis nearly 1:1 for Cl salt related processes, Cl-concentration was subtracted from total cation concentration to correct for the Cl-salt influence [27]. For the ammonium oxidation correction, it was assumed that NO3- is derived from ammonium oxidation (nitrification) only. Ammonium oxidation requires two equivalents of alkalinity to generate an equivalent of NO3-, so twice the amount of NO3- concentration was subtracted from the total cation to correct for the anthropogenic effect [27]. Figure 12 shows the chloride correction graph, the results show that the total cation corrections make the relationships more linear with respect to alkalinity and the samples showed a closer relationship to the mineral dissolution lines with R2 = 0.8657 when the Cl- correction was made.
Figure 13 shows the nitrate correction graph. The result shows that, there was no improvement in linearity but rather a reduction when NO3- correction was made, R2 = 0.851 indicating that not all the samples are influenced by this factor. It also emphasized the point that nitrification may not be the dominant NO3- supplying
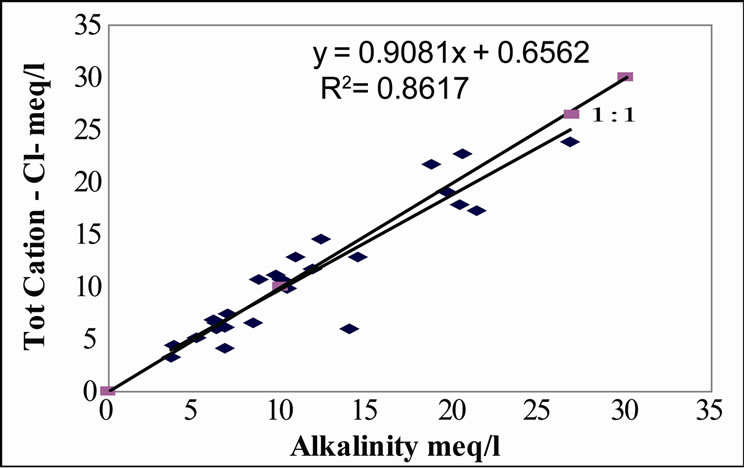
Figure 12 Relationship between Alkalinity and total cation-Cl.
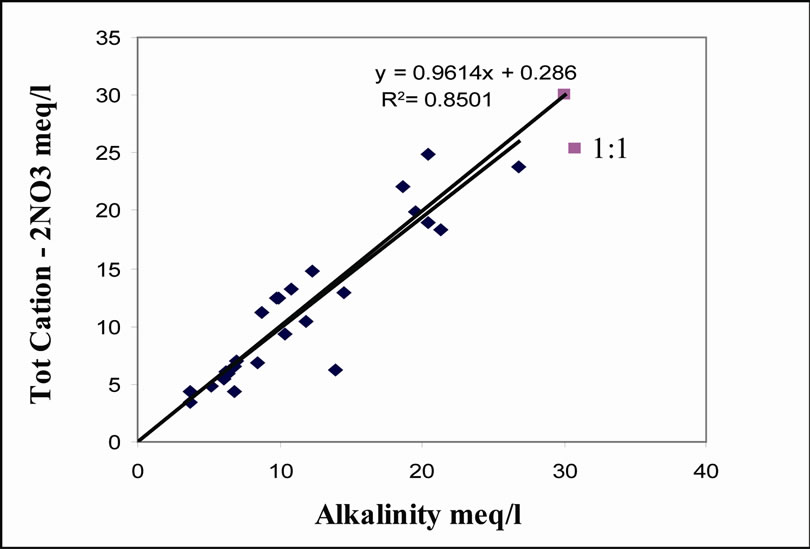
Figure 13. Relationship between Alkalinity and total cation-2NO3.
process in groundwater of the studied area, but other sources such as fertilizers may be the major source NO3- in this agricultural area.
4. Conclusions
Analysis of the Hydrochemical data from the northern part of the Densu basin has revealed that, the groundwater is generally mildly acidic to neutral. Major cations were generally low with bicarbonate being the most dominant anion. The groundwater in the study area are fresh. The physico-chemical parameters are within the WHO guidelines for drinking water, with the exception of nitrate which shows an elevated concentration in most of the samples, about 60%. Fertilizer application and decay of organic matter are the probable origin of these nitrates while nitrification was observed to contribute little to the nitrate concentration.
Based on the major constituents analyzed, in general, groundwater from the study area corresponded to Na-Cl or Na-HCO3-Cl, Na-Mg-Ca-HCO3 and Na-HCO3 as the principal water types and Ca-Mg-HCO3 as minor about 8%. The groundwater types are moderately mineralized.
Ion-exchange, Weathering, Oxidation and Dissolution of minerals were found to be the major geochemical processes governing the groundwater evolution in the study area. The extents of their influence are different for each sample.
REFERENCES
- C. Lee and P. Linneman, “Dynamics of the Greenbelt Amenity Effect on the Land Market - The Case of Seoul’s Greenbelt,” Real Estate Economics, Vol. 26, No. 1, 1998, pp. 107-129.
- T. J. Pearson, C. Tisdell and A. T. Lisle, “The Impact of Noosa National Park on Surrounding Property Values: An Application of the Hedonic Price Method,” Economic Analysis and Policy, Vol. 32, No. 2, 2002, pp. 155-171.
- N. Hanley, R. E. Wright and B. Alvarez-Farizo, “Estimating the Economic Value of Improvements in River Ecology Using Choice Experiments: An Application to the Water Framework Directive,” Journal of Environmental Management, Vol. 78, No. 4, 2006, pp. 183-193.
- H. Chen, N. Chang and D. Shaw, “Valuation of In-Stream Water Quality Improvement via Fuzzy Contingent Valuation Method,” Stochastic Environmental Research Risk Assessment, Vol. 19, No. 2, 2005, pp. 158-171.
- R. A. Kramer and J. I. Eisen-Hecht, “Estimating the Economic Value of Water Quality Protection in the Catawba River Basin,” Water Resources Research, Vol. 30, No. 9, 2002, p. 1182.
- R. C. Mitchell and R. T. Carson, “Using Surveys to Value Public Goods: The Contingent Valuation Method,” Resources of the Future, Washington, D. C, 1989.
- M. K. Alam and D. Marinova, “Measuring the Total Value of a River Cleanup,” Water Science and Technology, Vol. 48, No. 7, 2003, pp. 149-156.
- R. S. Rosenberger and J. B. Loomis, “Benefit Transfer of Outdoor Recreation Use Values. A Technical Document Supporting the Forest Service Strategic Plan,” Gen. Tech. Rep. RMRS-GTR-72. Fort Collins, CO: U.S. Department of Agriculture, Forest Service, Rocky Mountain Research Station, 2001, p. 59.
- G. Van Houtven, J. Powers and S. K. Pattanayak, “Valuing Water Quality Improvements in the United States Using Meta-analysis: Is the Glass Half Full or Half Empty for National Policy Analysis?” Resource and Energy Economics, Vol. 29, No. 3, 2007, pp. 206-228.
- S. Rosen, “Hedonic Prices and Implicit Markets: Product Differentiation in Perfect Competition,” Journal of Political Economy, Vol. 82, No. 1, 1974, pp. 34-55.
- S. D. Shultz, “The Use of Census Data for Hedonic Price Estimates of Open-Space Amenities and Land Use,” Journal of Real Estate Finance and Economics, Vol. 22, No. 2-3, 2001, pp. 239-252.
- G. Acharya and B. L. Lewis, “Valuing Open Space and Landuse Patterns in Urban Watersheds,” Journal of Real Estate Finance and Economics, Vol. 22, No. 2-3, 2001, pp. 221-237.
- B. L. Mahan, S. Polasky and R. M. Adams, “Valuing Urban Wetlands: A Property Price Approach,” Journal of Land Economics, Vol. 76, No. 1, 2000, pp. 100-113.
- E. D. Benson, J. L. Hansen, J. Arthur, L. Schwartz and G. T. Smersh, “Pricing Residential Amenities: The Value of a View,” Journal of Real Estate Finance and Economics, Vol. 16, No. 1, 1998, pp. 55-73.
- B. Colby and S. Wishart, “Riparian Areas Generate Property Value Premium for Landowners,” Working paper, University of Arizona College of Agriculture and Life Sciences, Department of Agricultural and Resource Economics, 2002.
- K. Boyle and L. Taylor, “Does the Measurement of Property and Structural Characteristics Affect Estimated Implicit Prices for Environmental Amenities in a Hedonic Model?” Journal of Real Estate Finance and Economics, Vol. 22, No. 2-3, 2001, pp.303-318.
- L. Tyrvainen, “The Amenity Value of the Urban Forest: An Application of the Hedonic Pricing Method,” Landscape and Urban Planning, Vol. 37, No. 3-4, 1997, pp. 211- 222.
- W. A. Donnelly, “Hedonic Price Analysis of the Effect of a Floodplain on Property Values,” Journal of the American Water Resources Association, Vol. 25, No. 3, 2007, pp. 581-586.
- S. Sengupta and D. E. Osgood, “The Value of Remoteness: A Hedonic Estimation of Ranchette Prices,” Ecological Economics, Vol. 44, No. 1, 2003, pp. 91-103.
- B. Fraser and G. Spencer, “The Value of an Ocean View: An Example of Hedonic Property Amenity Valuation,” Australian Geographical Studies, Vol. 36, No. 1, 1998, pp. 94-98.
- J. Luttik, “The Value of Trees, Water and Open Space as Reflected by House Prices in the Netherlands,” Landscape and Urban Planning, Vol. 48, No. 3-4, 2000, pp. 161-167.
- C. Bastian, D. McLeod, M. Germino, W. Reiners and B. Blasko, “Environmental Amenities and Agricultural Land Values: A Hedonic Model Using Geographical Information Systems Data,” Ecological Economics, Vol. 40, No. 3, 2002, pp. 337-349.
- I. R. Lake, A. Lovett, I. J. Bateman and I. H. Langford, “Modelling Environmental Influences on Property Prices in an Urban Environment,” Computers, Environment and Urban Systems, Vol. 22, No. 2, 1998, pp. 121-136.
- A. Freeman and I. I. I. Myrick, “The Measurement of Environmental and Resource Values,” Theory and Methods, Resources for the Future, 1997.
- D. W. Pearce and A. Markandya, “Environmental Policy Benefits: Monetary Valuation,” Organisation for Economic Co-Operation and Development, Paris, 1989.
- J. A. Anderson, “An Introduction to Neural Networks”. M. I. T. Press, 1995.
- T. Khanna, “Foundations of Neural Networks,” Addison-Wesley, 1990.
- H. Selim, “Determinants of House Prices in Turkey: Hedonic Regression versus Artificial Neural Network,” Expert Systems with Applications, 2008 (in press).
- R. O. Strobl and F. Forte, “Artificial Neural Network Exploration of the Influential Factors in Drainage NetWork Derivation,” Hydrological Processes, Vol. 21, No. 22, 2007, pp. 2965-2978.
- Y. Miao, D. J. Mulla and P. C. Robert, “Identifying ImPortant Factors Influencing Corn Yield and Grain Quality Variability Using Artificial Neural Networks,” Precision Agriculture, Vol. 7, No. 2, 2006, pp. 117-135.
- J. C. Ingram, T. P. Dawson and R. J. Whittaker, “Mapping Tropical Forest Structure in Southeastern Madagascar Using Remote Sensing and Artificial Neural Networks,” Remote Sensing of Environment, Vol. 94, No. 4, 2004, pp. 491-507.
- N. Garcia, M. Gamez and E. Alfaro, “ANN+GIS: An Automated System for Property Valuation,” Neurocomputing, Vol. 71, No. 4-6, 2008, pp. 733-742.
- P. S. Jarvis, I. D. Wilson and S. E. Kemp, “The Application of a New Attribute Selection Technique to the Forecasting of Housing Value Using Dependence Modelling,” Neural Computing and Applications, Vol. 15, No. 2, 2006, pp. 136-153.
- L. J. Pearson, A. J. Higgins, L. Laredo and S. Whitten, “Maroochy River Value Project,” Final Report Submitted to the Sunshine Coast Regional Council, 2008.