Journal of Water Resource and Protection
Vol.2 No.5(2010), Article ID:1796,6 pages DOI:10.4236/jwarp.2010.25051
Projection Pursuit Dynamic Cluster Model and its Application to Water Resources Carrying Capacity Evaluation
1Institute of Plateau Meteorology, China Meteorological Administration, Chengdu, China
2Business School, Sichuan University, Chengdu, China
E-mail: wsjbnu@163.com
Received January 14, 2010; revised March 2, 2010; accepted April 2, 2010
Keywords: Projection Pursuit, Dynamic Cluster, Genetic Algorithm, Water Resources
ABSTRACT
The research shows that projection pursuit cluster (PPC) model is able to form a suitable index for overcoming the difficulties in comprehensive evaluation, which can be used to analyze complex multivariate problems. The PPC model is widely used in multifactor cluster and evaluation analysis, but there are a few problems needed to be solved in practice, such as cutoff radius parameter calibration. In this study, a new model-projection pursuit dynamic cluster (PPDC) model-based on projection pursuit principle is developed and used in water resources carrying capacity evaluation in China for the first time. In the PPDC model, there are two improvements compared with the PPC model, 1) a new projection index is constructed based on dynamic cluster principle, which avoids the problem of parameter calibration in the PPC model successfully; 2) the cluster results can be outputted directly according to the PPDC model, but the cluster results can be got based on the scatter points of projected characteristic values or the re-analysis for projected characteristic values in the PPC model. The results show that the PPDC model is a very effective and powerful tool in multifactor data exploratory analysis. It is a new method for water resources carrying capacity evaluation. The PPDC model and its application to water resources carrying capacity evaluation are introduced in detail in this paper.
1. Introduction
The difficulty frequently encountered in water resources carrying capacity evaluation is that there are so many factors and the complex interrelationship among them, which cannot be evaluated according to only one factor, all the effect factors associated with water resources carrying capacity must be thought over. However, up till now, there is no a unified standard of evaluation index system in the world. Presently, it is difficult to resolve complex high dimensional problem directly. If there is an effective way to reduce the dimensionality, multidimensional space problems can be resolved on visual space, such as three-dimensional space, two-dimensional space even one-dimensional space.
Friedman and Tukey developed a projection pursuit principle [1]. It is able to find a right projection direction that can retain the main feature of data according to a projection index. On the basis of the right projection direction, high dimensional problem can be converted to low dimensional problem such as one-dimension. Therefore, high dimensional data characteristics can be analyzed on two-dimensional or one-dimensional space, and many ordinary methods used on low dimensional space can be used to analyze high dimensional problems.
According to projection pursuit principle, many new mathematical analysis methods for high-dimensional data exploratory analysis also have been developed [2-8], and projection pursuit cluster (PPC) model is one of them. The PPC model is an effective method for multifactor data exploratory analysis, which is widely used in multivariable prediction, cluster and evaluation [9-15].
However, the PPC model does have disadvantage in practice as follows: 1) Being the only parameter in the PPC model, the cutoff radius is hard to estimate, even though it has a significant effect on the results. Nowadays, the cutoff radius are still set based on experience, i.e. it may be set to ten percent of the square root of the data variance along the largest principal axis [1]. There is no theory or common formula to calibrate the cutoff radius. 2) The cluster results cannot directly be obtained from the output of the PPC model. The PPC model only can provide the projected characteristic value remaining the major characteristics of data according to the projection index. In other words, other approaches such as the method of scatter points should be used to re-analyze the projected characteristic value series in order to obtain the desired cluster results [16].
In order to resolve the problem mentioned above, Wang and Ni developed a projection pursuit dynamic cluster (PPDC) model and it was used in regional partition of water resources in China [16]. In this paper, the PPDC model will be used in water resources carrying capacity evaluation in China for the first time. The PPDC model and its application will be introduced in detail in the following.
2. PPDC Model
A linear projection technique is described in this study. High-dimensional data is projected onto one-dimensional space, and the feature of high-dimensional data was studied through the projected characteristics of the one-dimensional space [1].
If  (
( and
and .
.  is the total number of samples,
  is the total number of effect factors of sample) is the initial value of the
  factor of the
  sample, the steps of developing the PPDC model are the following [16].
2.1. Data Standardization
In order to eliminate the effect of different ranges of values of cluster factors, the initial data are standardized before it is used in the PPDC model. And the standardization formula used in this study is
 (1)
(1)
where  and
and  are the initial maximum and minimum of the
  factor respectively.
2.2. Linear Projection
In essence, projection is to observe data characteristic from all angles. The main purpose of projection pursuit is to find hidden structure in higher-dimensional data sets by searching through all their low-dimensional projections [17]. If 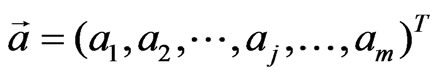 is a
is a  -dimensional unit vector and
  is the projected characteristic value of
 , linear projection can be described as,
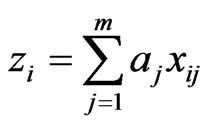 (2)
(2)
where  is projection axis vector, and it is also called projection direction vector in the PPC model.
2.3. Projection Index
Cluster analysis is a tool for exploratory data analysis that tries to find the intrinsic structure of data by organizing patterns into groups or clusters [18]. In the PPDC model, a new projection index is generated on the basis of dynamic cluster principle [19].
Define  (
( ) as the absolute value of distance between the projected characteristic values
  and
and , namely
 .
.
Let , and define
  as
as
 (3)
(3)
Then, assume that the all samples are classified as  (
( ) clusters.
 is the projected characteristic value space of cluster
 , which contains all the projected characteristic values of cluster
 , and that
 (4)
(4)
where , and
, and ,
,  and
and  is the initial cluster core of both cluster
  and cluster
 , respectively. In practice, the average projected characteristic value of clusters is used as new cluster core to conduct the iteration until the criterion is met [19].
Next define
 (5)
(5)
and
 (6)
(6)
Finally, according to  and
and , the new projection index
  in the PPDC model can be defined as
 (7)
(7)
The bigger the value of  is, the bigger of distance between data points will be, and the smaller the value of
  is, the smaller of distance between data points will be. The projection index measures the degree to which the data points in the projection are both concentrated locally (
 small) while, at the same time, expanded globally (
 large) [1].
2.4. Model Optimization
According to the above analysis, the PPDC model can be expressed by
 (8)
(8)
From (8), it is shown that the PPDC model reflects an optimum problem. Genetic algorithm (GA) has been able to converge with global optimum while coping with the large and complex problems [20]; it possesses powerful and efficient search ability in the complex search space [21]. And it has been widely used in practice recently [10-12,22-25]. Here, the GA is used to resolve the optimization problem of the PPDC model, and the steps are introduced in detail in [16].
3. Case Study
The PPDC model is used in water resources carrying capacity evaluation in China. Five major factors of water resources carrying capacity are selected as index system: 1) per capita available amount of water resources (m3·person-1), 2) per unit GDP available amount of water resources (10-2 m3·(RMB Yuan)-1), 3) available amount of water resources per the estimated price of 45 kinds of potential resources (10-2 m3·(RMB Yuan )-1), 4) per arable area available amount of water resources(m3·hm-2) and 5) per unit area of available amount of water resources (104 m3·km-2). This Index system may reflect the water resources supporting capacity for population development (1 factor), economy development (2 and 3 factors) and eco-environment protection (4 and 5 factors). The data is shown in Table 1 [26].
The IPPC model is used to do a cluster analysis of regional partition in China according to its water resources carrying capacity.
In order to comparative analysis, we do water resources carrying capacity clustering in two cases, namely three clusters and four clusters. Based on the data in Table 1, we can develop the PPDC model. Here m = 5, n = 30 and p = 3 or 4.
The right projection direction  is, when p = 3
 and when
 .
.
The projected characteristic value z and the cluster results also can be got, which are shown in Table 1, too.
In Table 1, cluster 1 means the best situation of water resources carrying capacity in this administrative area, cluster 2 means better, and by analogy to others.
The schematic diagram of regional partition of water resources carrying capacity in China is shown in Figure 1.
The bigger the value of z is, the better the water resources carrying capacity will be. According to the index system in this study, the results of the PPDC model led
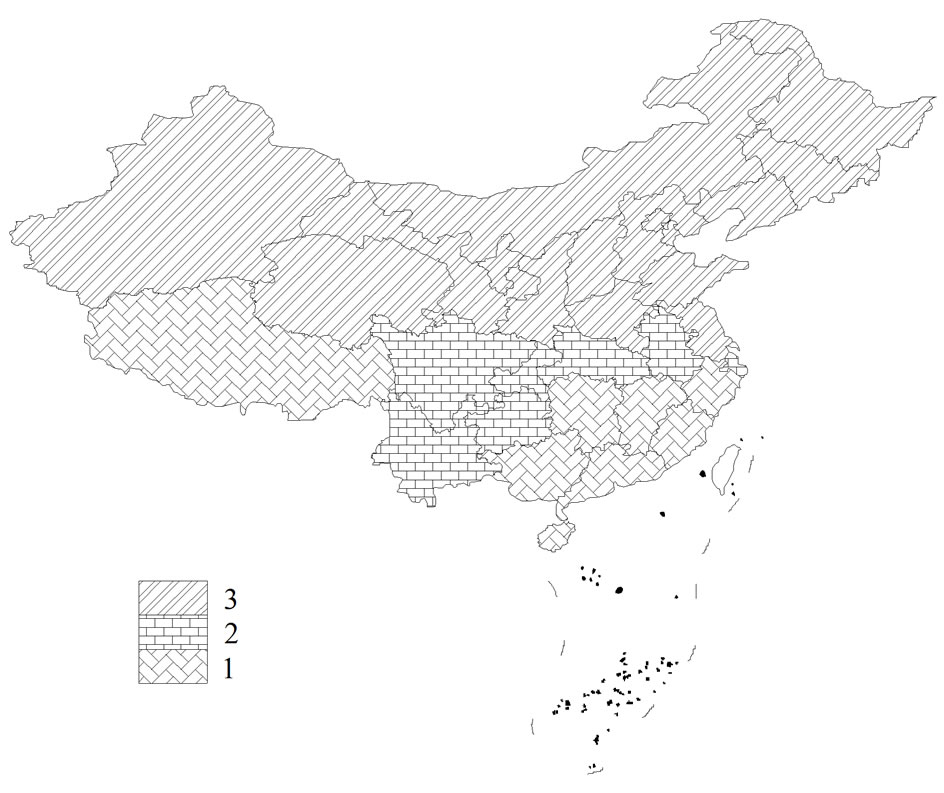 (a)
(a)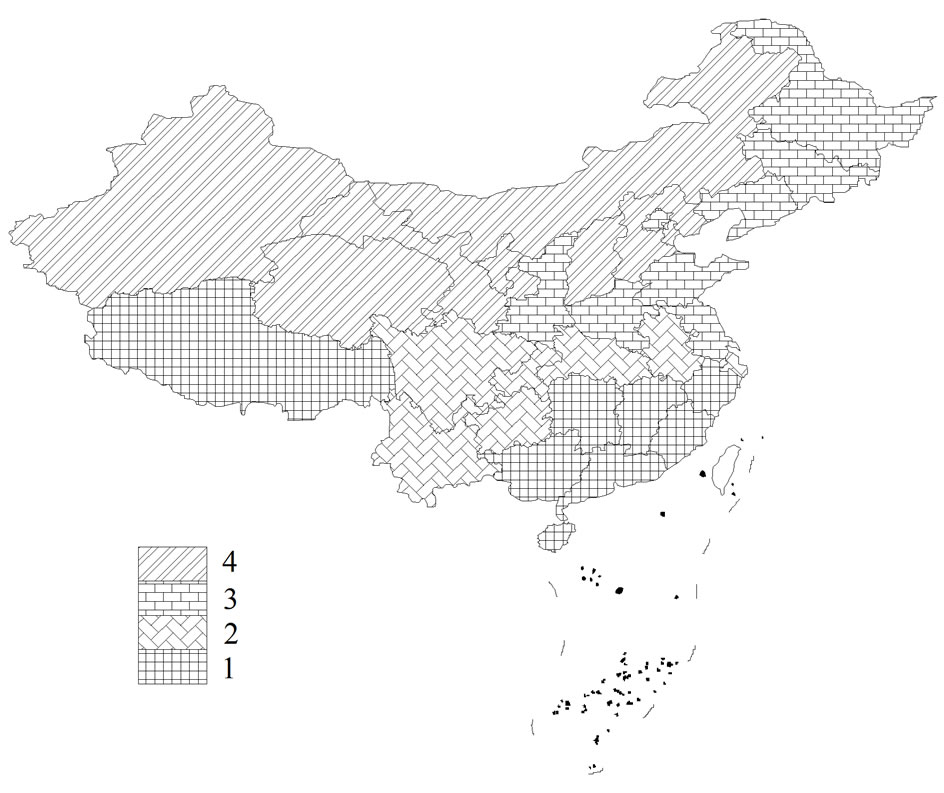 (b)
(b)
Figure 1. Schematic diagram of regional partition of water resources carrying capacity in China: (a) three clusters; (b) four clusters.
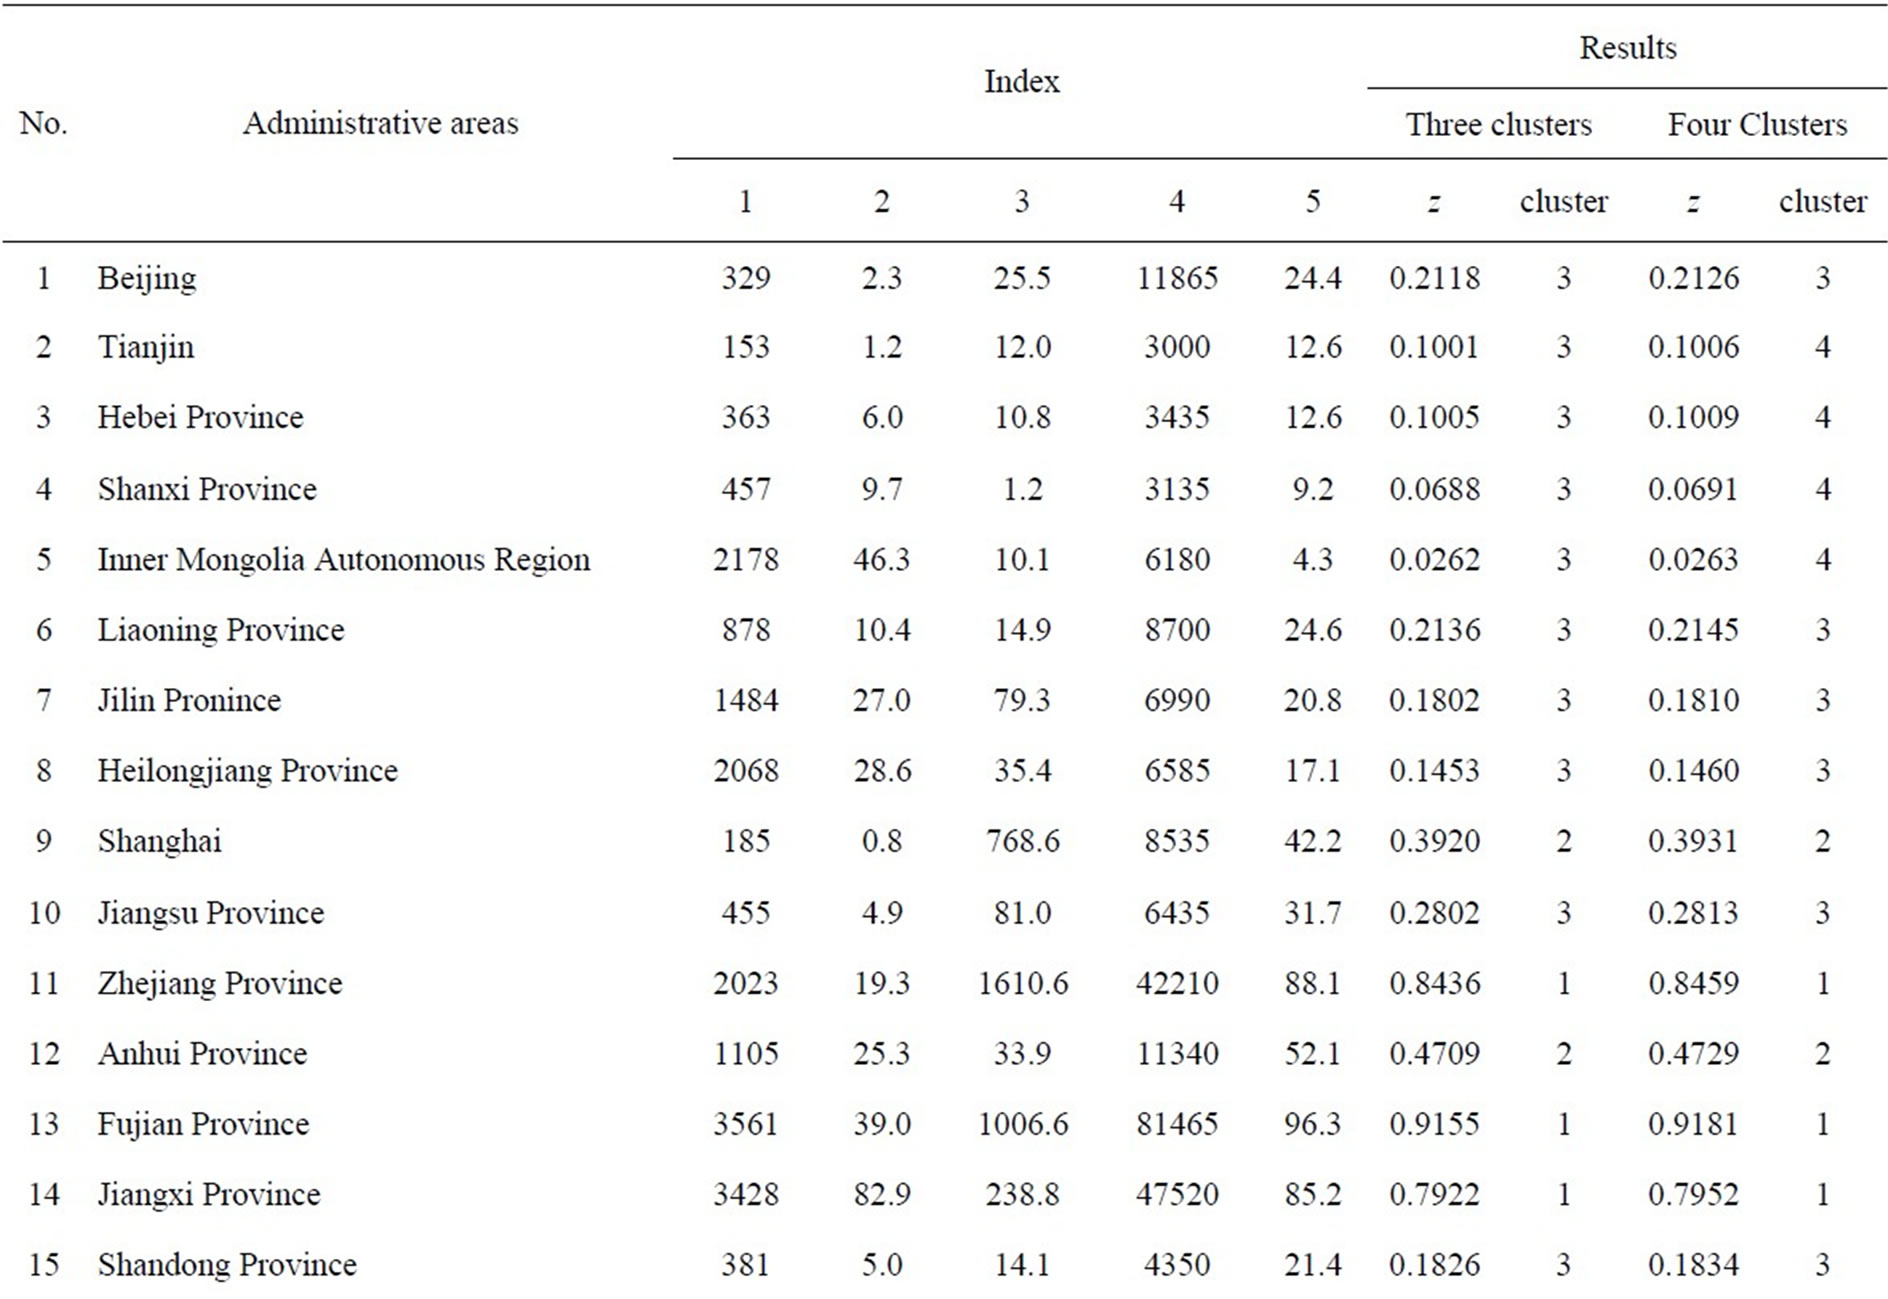
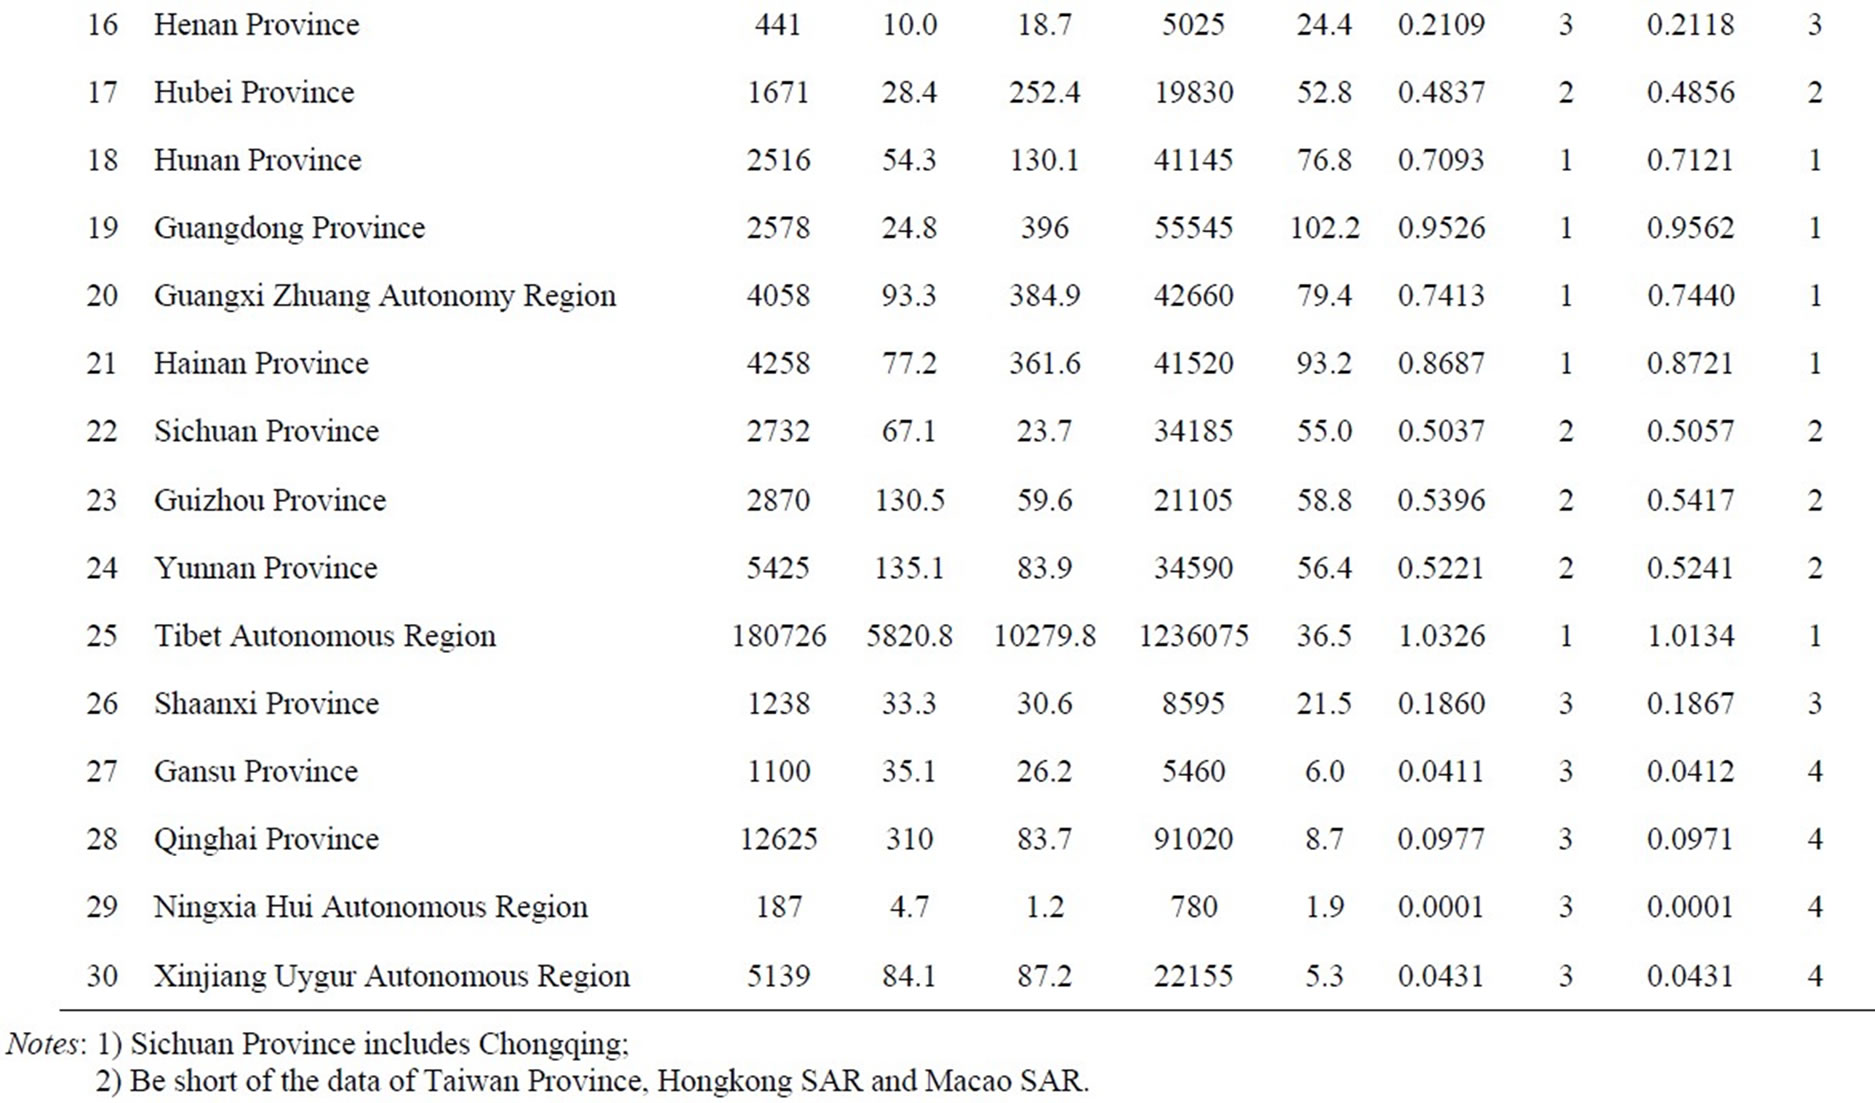
Table 1. index and results.
to four major conclusions: 1) the situation of water resources carrying capacity in south China is better than that of in north China. Tibet Autonomous Region, Guangdong Province and Fujian Province are the first three regions being the best in water resources carrying capacity in China. That is to say, in the regions of cluster 1, the development of society and economy may be very suitable for water resources situation; 2) the most regions being poor level of water resources carrying capacity are centered largely in north China and Gansu Panhandle. Ningxia Hui Autonomous Region is a serious situation of water resources carrying capacity, and Inner Mongolia Autonomous Region, Gansu Province and Xinjiang Uygur Autonomous Region next; 3) the cluster results in this study are consistent with the facts of China. Because many rivers such as Yangtze River, Ya-lu-tsang-pu River, Nujiang-Salween River, Lancangjiang-Mekong River, and Pearl River run through or rise in the southern part of China, there are abundant water resources in south China. There is good water resources carrying capacity in south China, too. Therefore, South-to-North Water Transfer Project that is being put into practice is one of the effective measures to improve the water resources carrying capacity level for north China; 4) the distribution situation of regional partition of water resources carrying capacity is similar to that of water resources quantity in China [16].
4. Conclusions
The PPDC model combines dynamic cluster method with projection pursuit principle, which is an effective improvement for the PPC model. Because there is no parameter calibration and the final result of need can be outputted directly, the PPDC model is easy to operate in practice. The studies show that the PPDC model is a new method for water resources carrying capacity evaluation. However, the application of the PPDC model in multifactor evaluation needs to be improved further. On the other hand, water quality is one of the main factors of water resources carrying capacity, which related to the availability of water resource. Because of lacking water quality data, there are no water quality indexes in evaluation index system in this research. The evaluation in this study is mainly focus on the water resources quantity rather than water quality.
5. Acknowledgements
This work is part of the Program of China Meteorological Administration (CCFS-09-19) and Institute of Plateau Meteorology of China Meteorological Administration (BROP200801 and BROP200907). The constructive comments and suggestions from the editor and anonymous reviewers, which resulted in a significant improvement of the manuscript, are gratefully appreciated. The opinions expressed here are those of the authors and not those of other individuals or organizations.
REFERENCES
- J. H. Friedman and J. W. Tukey, “A Projection Pursuit Algorithm for Exploratory Data Analysis,” IEEE Transactions on Computers, Vol. 23, No. 9, September 1974, pp. 881-890.
- J. H. Friedman and W. Stuetzle, “Projection Pursuit Regression,” Journal of American Statistical Association, Vol. 76, No. 376, December 1981, pp. 817-823.
- J. H. Friedman, W. Stuetzle and A. Schroeder, “Projection Pursuit Density Estimation,” Journal of American Statistical Association, Vol. 79, No. 387, September 1984, pp. 599-608.
- P. Hall, “On Projection Pursuit Regression,” The Annals of Statistics, Vol. 17, No. 2, 1989, pp. 573-588.
- P. Hall, “On Polynomial-Based Projection Indices for Exploratory Projection Pursuit,” The Annals of Statistics, Vol. 17, No. 2, 1989, pp. 589-605.
- J. N. Hwang, S. R. Lay, M. Maechler, R. D. Martin and J. Schimert, “Regression Modeling in Back-Propagation and Projection Pursuit Learning,” IEEE Transactions on Neural Networks, Vol. 5, No. 3, 1994, pp. 342-353.
- M. Basu and M. Su, “Deblurring Images Using Projection Pursuit Learning Network,” Proceedings of International Joint Conference on Neural Networks’99, Washington, D.C., 10-16 July 1999, pp. 2674-2678.
- W. Lin, Z. Tian and F. He, “On Improving Unsupervised Restoration of Image with PPWLN,” Journal of Northwestern Polytechnical University, Vol. 21, No. 3, 2003, pp. 344-347.
- J. L. Jin, Y. M. Wei and Q. Fu, “Projection Pursuit Model for Comprehensive Evaluation of Agricultural Productive Capacity,” System Sciences and Comprehensive Studies in Agriculture, Vol. 17, 2001, No. 4, pp. 241-243.
- X. L. Zhang, J. Ding and J. L. Jin, “Application of Parametric Projection Pursuit Regression Based on Genetic Algorithm in Flood Forecasting,” Journal of Hydraulic Engineering, Vol. 31, No. 6, 2000, pp. 45-48.
- X. L. Zhang, J. Ding, Z. Y. Li and J. L. Jin, “Application of New Projection Pursuit Algorithm in Assessing Water Quality,” China Environmental Science, Vol. 20, No. 2, 2000, pp. 187-189.
- X. L. Zhang, J. Ding and S. J. Wang, “Projection Pursuit Method for Assessing Analogy Basins,” Advances in Water Science, Vol. 12, No. 3, 2001, pp. 356-360.
- X. L. Zhang, S. J. Wang and J. Ding, “Application of Projection Pursuit in Environmental Impact Assessment of Project Management,” Systems Engineering—Theory & Practice, Vol. 22, No. 6, 2002, pp. 131-134.
- S. J. Wang, X. L. Zhang, Y. Hou and J. Ding, “Projection Pursuit Model for Evaluating of Flood Events,” Hydrology, Vol. 22, No. 4, 2002, pp. 1-4.
- S. J. Wang, X. L. Zhang, J. Ding and Y. Hou, “Projection Pursuit Cluster Model and its Application,” Journal of Yangtze River Scientific Research Institute, Vol. 19, No. 6, 2002, pp. 53-55, 61.
- S. J. Wang and C. J. Ni, “Application of Projection Pursuit Dynamic Cluster Model in Regional Partition of Water Resources in China,” Water Resources Management, Vol. 22, No. 10, October 2008, pp. 1573-1650.
- H. J. Cui, “The Laws of the Iterated Logarithm for Two Kinds of PP Statistics,” Statistics & Probability Letters, Vol. 32, No. 3, 1997, pp. 235-243.
- M. Hareven and V. L. Brailovsky, “Probabilistic Validation Approach for Clustering,” Patter Recognition Letters, Vol. 16, No. 11, November 1995, pp. 1189-1196.
- R. E. Ren and H. W. Wang, “Multi-Dimensional Statistics Data Analysis-Theory, Method and Practice,” Beijing: National Defence Industry Press, 1999, pp. 76-80.
- J. H. Holland, “Adaptation in Natural and Artificial Systems,” The University of Michigan Press, Ann Arbor, 1975.
- D. E. Goldberg, “Genetic Algorithms in Search, Optimization and Machine Learning,” Addison-Wesley, Boston, 1989, pp. 1-180.
- K. W. Chau, “Calibration of Flow and Water Quality Modeling Using Genetic Algorithm,” Lecture Notes in Computer Science, Vol. 2557, 2002, p. 1-720.
- K. W. Chau and F. Albermani, “Knowledge-based System on Optimum Design of Liquid Retaining Structures with Genetic Algorithms,” Journal of Structural Engineering-ASCE, Vol. 129, No. 10, September 2007, pp. 1312-1321.
- K. W. Chau, “A Two-Stage Dynamic Model on Allocation of Construction Facilities with Genetic Algorithm,” Automation in Construction, Vol. 13, No. 2, July 2004, pp. 481-490.
- C. T. Cheng, C. P. Ou and K. W. Chau, “Combining a Fuzzy Optimal Model with a Genetic Algorithm to Solve Multi-Objective Rainfall—Runoff Model Calibration,” Journal of Hydrology, Vol. 268, No. 1-4, November 2002, pp. 72-86.
- D. X. Wang, H. Wang and J. Ma, “Water Resources Supporting Capacity for Regional Development in China,” Journal of Hydraulic Engineering, Vol. 31, No. 6, 2000, pp. 21-26.
- M. C. Jones and R. Sibson, “What is Projection Pursuit?” Journal of the Royal Statistical Society, Series A, Vol. 150, 1987, pp. 1-18.