Journal of Software Engineering and Applications
Vol.6 No.5(2013), Article ID:31796,6 pages DOI:10.4236/jsea.2013.65034
Mixed Music Analysis with Extended Specmurt
![]()
Graduate School of System Informatics, Kobe University, Kobe, Japan.
Email: nishimura@me.cs.scitec.kobe-u.ac.jp, nakashika@me.cs.scitec.kobe-u.ac.jp, takigu@kobe-u.ac.jp, ariki@kobe-u.ac.jp
Copyright © 2013 Daiki Nishimura et al. This is an open access article distributed under the Creative Commons Attribution License, which permits unrestricted use, distribution, and reproduction in any medium, provided the original work is properly cited.
Received March 16th, 2013; revised April 18th, 2013; accepted April 26th, 2013
Keywords: Mixed Music Analysis; Specmurt Analysis; Matrix Representation
ABSTRACT
This paper introduces a mixed music analysis method using extended specmurt analysis. Conventional specmurt can only analyze a multi-pitch music signal from a single instrument and cannot analyze a mixed music signal that has several different types of instruments being played at the same time. To analyze a mixed music signal, extended specmurt is proposed. We regard the observed spectrum extracted from the mixed music as the summation of the observed spectra corresponding to each instrument. The mixed music has as many unknown fundamental frequency distributions as the number of instruments since the observed spectrum of a single instrument can be expressed as a convolution of the common harmonic structure and the fundamental frequency distribution. The relation among the observed spectrum, the common harmonic structure and the fundamental frequency distribution is transformed into a matrix representation in order to obtain the unknown fundamental frequency distributions. The equation is called extended specmurt, and the matrix of unknown components can be obtained by using a pseudo inverse matrix. The experimental result shows the effectiveness of the proposed method.
1. Introduction
In recent years, music information processing technology has improved dramatically. This gives us many changes for creating music. For example, in the past only those who had specific musical skills could compose or arrange music, but now, anyone can enjoy these activities by using various music-related software. However, there still remain some fields that rely on people with specific skills, such as perfect-pitch. This ability is necessary when attempting to reproduce or score music by simply hearing it, and considerable experience and effort are needed in order to acquire this skill. In particular, it is difficult to analyze the signal that has several different types of pitches or instruments at the same time. Therefore, a technology for analyzing mixed music signals is required.
Monophonic music can be analyzed with relatively high accuracy [1-3]. However, multi-pitch or mixed music is more difficult to analyze than a single tone. An acoustic signal has information of fundamental frequentcies and harmonic frequencies, but in the case of multipitch or mixed music sounds, it is unknown which peak corresponds to the fundamental frequency or the harmonic frequency. Moreover, the number of fundamental frequencies is not always known. This is one reason for the difficulty of multi-pitch or mixed music analysis.
Many techniques have been tried in multi-pitch or mixed music analysis in the past, such as a comb filter [4], statistical information of chords and their progression [5,6], iterative estimation and separation [7], linear models for the overtone series [8], parameter estimation of superimposed spectrum models [9,10], acoustic object modeling using GMM and estimation with an EM algorithm [11-13]. Specmurt analysis [14-18] is another method of multi-pitch analysis. The method defines the observed spectrum as a convolution of instrumental information and the fundamental frequency distribution, and it differs from the methods listed above in terms of the introduction of the specmurt domain while [4] is processed in the time domain and [5-13] are processed in the spectrum domain.
Conventional specmurt cannot analyze a mixed music signal or indicate the analysis results corresponding to each instrument separately since the analysis result is shown as only one vector. Therefore, we extended specmurt and propose a novel mixed music analysis method to indicate the fundamental frequency distributions corresponding to each instrument separately by introducing a matrix representation.
2. Specmurt Analysis
2.1. Multi-Pitch Spectrum in Log-Frequency
In our study, the acoustic signals having harmonics are analyzed, and percussive signals such as drums are not targeted. The ![]() -th harmonic frequency is equal to
-th harmonic frequency is equal to ![]() multiples of the fundamental frequency in the linear frequency scale. Therefore, when the fundamental frequency shifts by
multiples of the fundamental frequency in the linear frequency scale. Therefore, when the fundamental frequency shifts by , the
, the ![]() -th harmonic frequency also shifts by
-th harmonic frequency also shifts by  as shown in left side of Figure 1. Meanwhile, in the log-frequency scale, the
 ![]() -th harmonic frequency is located at
-th harmonic frequency is located at  away from the fundamental frequency. This means that all harmonic frequencies shift by
  when the fundamental frequency shifts by
  in the log-frequency scale. The right side of Figure 1 shows the relationship.
In specmurt analysis, it is assumed that the relative powers of the harmonic components are common and do not depend on the fundamental frequency. This is called common harmonic structure , where
 ![]() represents log-frequency. The fundamental frequency is located at the origin, and the power is normalized to be 1. All pitch spectra can be expressed by a shift of
represents log-frequency. The fundamental frequency is located at the origin, and the power is normalized to be 1. All pitch spectra can be expressed by a shift of  along the xaxis in the log-frequency domain when a fundamental frequency in the log-frequency given.
It is considered that a multi-pitch spectrum can be generated by addition of a common harmonic structure  multiplied by the power corresponding to the fundamental frequency. If the distribution of the power of fundamental frequencies is defined as a fundamental frequency distribution
 , a multi-pitch spectrum
  is a convolution of
  and
and  as shown in Figure 2
 (1)
(1)
2.2. Analysis of Fundamental Frequency Distribution
If a common harmonic structure  is known, a fundamental frequency distribution
  can be estimated by the deconvolution of an observed multi-pitch spec-
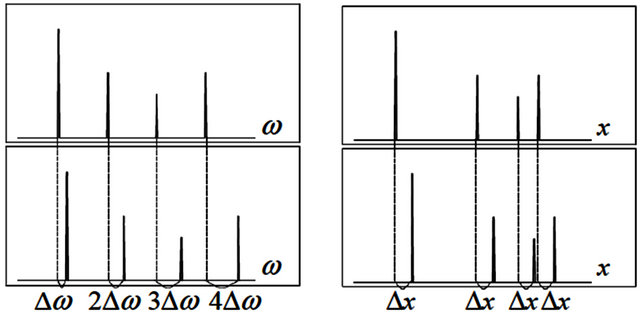
Figure 1. Positional relationship between fundamental and harmonic frequencies in the linear frequency domain (left) and the log-frequency domain.
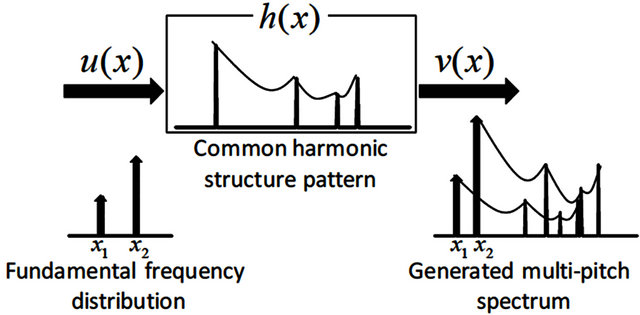
Figure 2. Generation of a multi-pitch spectrum by convolution of a common harmonic structure and a fundamental frequency distribution [17].
trum  by
by 
 (2)
(2)
According to the convolution theorem, Equation (2) can be expressed as
 (3)
(3)
where ,
,  and
and  are the inverse Fourier transform of
 ,
,  and
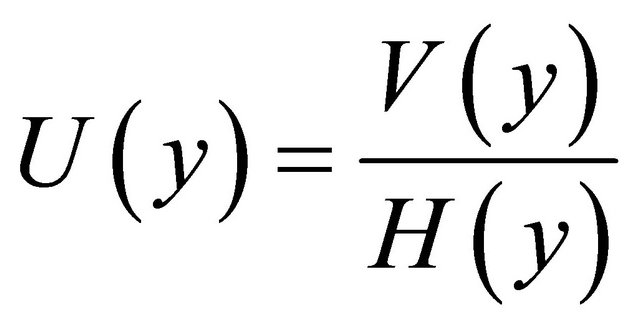
and , respectively. We can obtain
  using the Fourier transform of
  in the
 ![]() domain as follows:
domain as follows:
 (4)
(4)
As described above, the method to estimate the fundamental frequency distribution by deconvolution in the log-frequency domain is called specmurt analysis [14-18], and the ![]() domain (defined as the inverse Fourier transform of the log-frequency spectrum) is called the specmurt domain. In practical calculation, the
domain (defined as the inverse Fourier transform of the log-frequency spectrum) is called the specmurt domain. In practical calculation, the ![]() domain may be regarded as the Fourier transform.
domain may be regarded as the Fourier transform.
In specmurt analysis, a wavelet transform that can perform an analysis in the log-frequency is used to extract spectra instead of the short-term Fourier transform since the observed spectrum  is dealt with in the log-frequency domain.
One characteristic of specmurt analysis is that it can analyze music signals where pitch changes occur in a short time. Therefore, the analysis result of a piano roll, for example, can be obtained as visual information, where the horizontal axis represents the time index and the vertical axis represents the pitch.
3. Proposed Method
3.1. Problem with Applying Specmurt to Mixed Music
Conventional specmurt can only analyze a music signal from a single instrument although most music we listen to is mixed music featuring various instruments at the same time. In addition, the analysis result corresponding to each instrument cannot be indicated separately even if the conventional method can calculate the fundamental frequencies in mixed music. Therefore, we extend specmurt and propose a novel mixed music analysis method to indicate ![]() fundamental frequency distributions corresponding to
fundamental frequency distributions corresponding to ![]() instruments separately (
instruments separately (![]() is the number of instruments existing in mixed music).
is the number of instruments existing in mixed music).
3.2. Outline of Proposed Method
Conventional specmurt expresses the observed spectrum vector  extracted from the signal having a single instrument as convolution of the common harmonic structure vector
  and the fundamental frequency distribution vector
  in each frame (Equation (1)). Our proposed method extends specmurt and expresses the observed spectrum matrix generated from a mixed music signal as the product of the harmonic structure matrix and the fundamental frequency matrix in each frame. The fundamental frequency matrix is calculated by using a pseudo inverse matrix.
 ![]() fundamental frequency distributions corresponding to
fundamental frequency distributions corresponding to ![]() instruments can be obtained by extracting the components from the fundamental frequency matrix.
instruments can be obtained by extracting the components from the fundamental frequency matrix.
Figure 3 shows the flowchart of our method. First, the observed spectrum matrix is generated from the observed spectrum extracted from mixed music. The harmonic structure matrix is generated from prepared ![]() common harmonic structures corresponding to
common harmonic structures corresponding to ![]() instruments. The fundamental frequency matrix is calculated using the product of the pseudo inverse matrix of the harmonic structure matrix and the observed spectrum matrix.
instruments. The fundamental frequency matrix is calculated using the product of the pseudo inverse matrix of the harmonic structure matrix and the observed spectrum matrix. ![]() fundamental frequency distributions corresponding to
fundamental frequency distributions corresponding to ![]() instrument are generated by separating of the fundamental frequency matrix.
instrument are generated by separating of the fundamental frequency matrix.
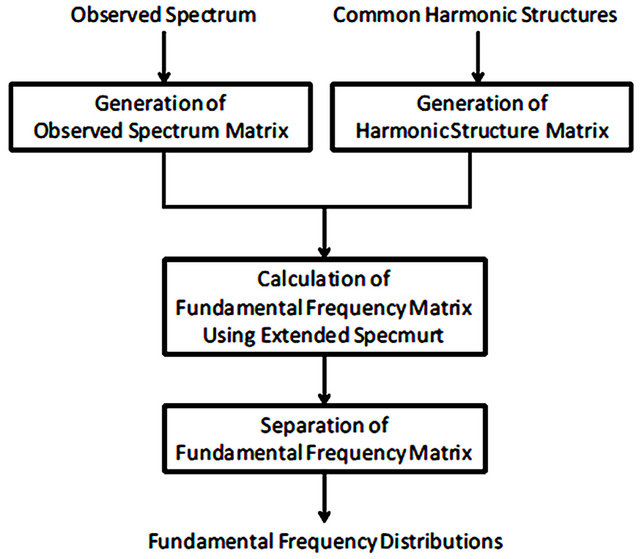
Figure 3. Flowchart of mixed music analysis with extended specmurt.
3.3. Extended Specmurt
The following is the method to extend conventional specmurt using a matrix representation in order to apply it to mixed music analysis.
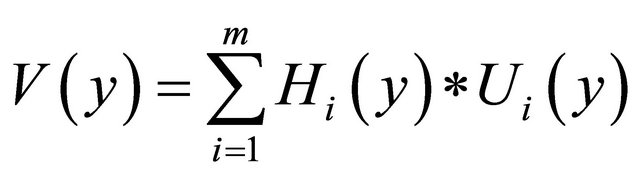
The observed spectrum  extracted from mixed music is considered as the summation of
 ![]() observed spectra
observed spectra 
 (Figure 4)
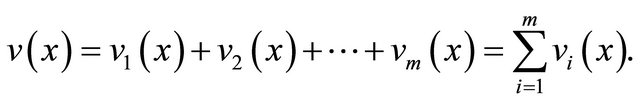 (5)
(5)
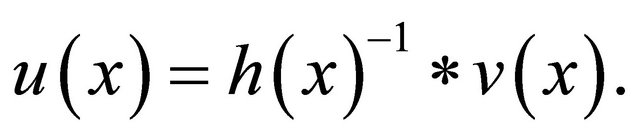
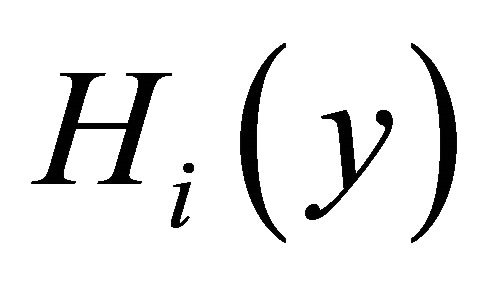
Applying Equation (1) to Equation (5), each observed spectrum  can be expressed as convolution of the harmonic structure
  and the fundamental frequency distribution
  corresponding to each instrument
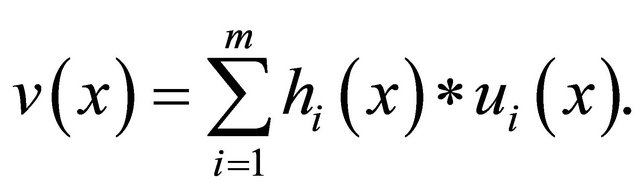 (6)
(6)
According to the convolution theorem and linearity of Fourier transform, Equation (6) can be expressed as
 (7)
(7)
where ,
, and
and 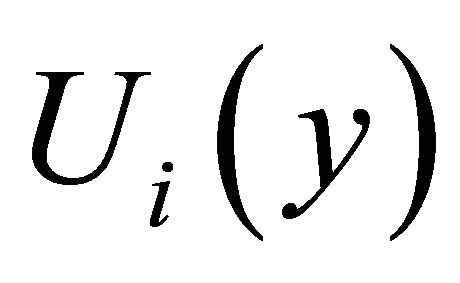 are the inverse Fourier transform of
 ,
,  and
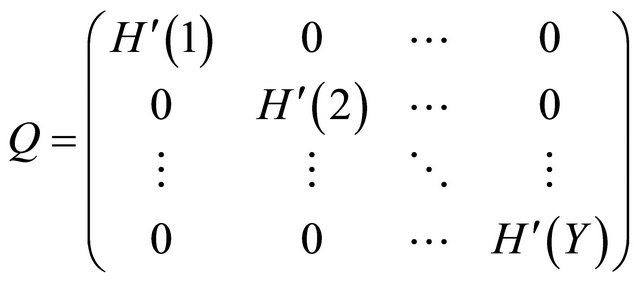
and , respectively. The observed spectrum matrix
 , the harmonic structure matrix
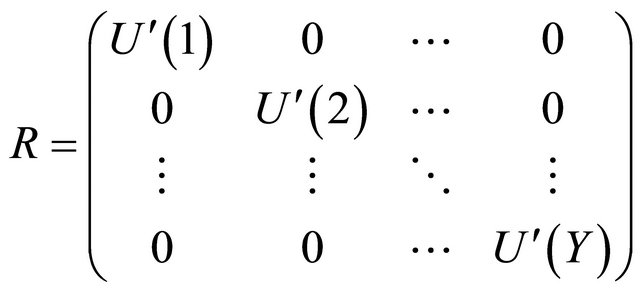
  and the fundamental frequency matrix
  are defined by using the components of
 ,
,  and
and 
 as follows:
 (8)
(8)
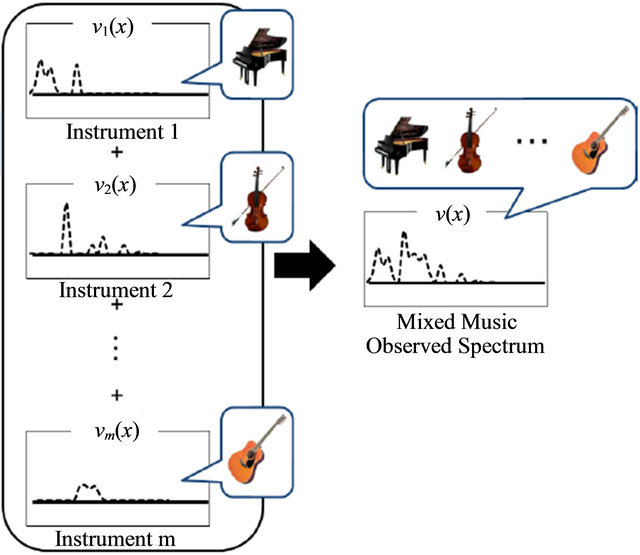
Figure 4. Observed spectra of each instrument and mixed music observed spectrum.
 (9)
(9)
 (10)
(10)
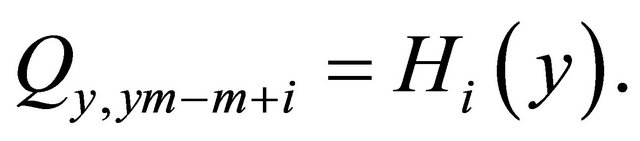
where
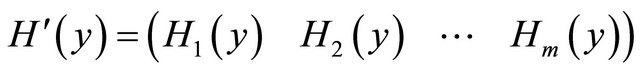 (11)
(11)
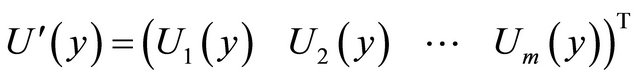 (12)
(12)
The size of ,
, and
and  are
are ,
,  and
and , respectively. Using by Equations (7)-(10) can be expressed as
 (13)
(13)
Equation (13) is called “extended specmurt” in this paper, and the purpose of mixed music analysis in our proposed method is the calculation of the fundamental frequency matrix .
.
3.4. Generation of Observed Spectrum Matrix and Harmonic Spectrum Matrix
From this section, our proposed method to analyze mixed music is described in detail along with the flowchart shown in Figure 3.
First, in the same way as conventional specmurt, the observed spectrum  in the log-frequency scale is obtained by applying wavelet transform to the target music signal.
  is calculated by applying inverse Fourier transform to
 . Arranging the components of
  in diagonal as Equation (8), the observed spectrum
  is generated.
Second, ![]() harmonic structures corresponding to
harmonic structures corresponding to ![]() instruments included in the target mixed music are prepared in advance.
instruments included in the target mixed music are prepared in advance.  is calculated by applied inverse Fourier transform to
 , respectively. The harmonic structure matrix
  is generated by arranging the components of all
  as follows:
 (14)
(14)
3.5. Calculation of Fundamental Frequency Matrix
Equation (13) is transformed as
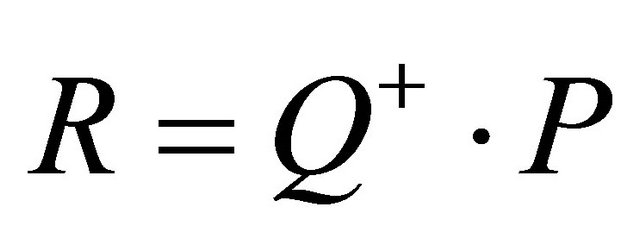 (15)
(15)
where  means the pseudo inverse matrix of
 . Substituting
  and
and  in Equation (15), the fundamental frequency matrix
  can be calculated.
3.6. Separating of Fundamental Frequency Matrix
 is generated by separating the fundamental frequency matrix R as follows:
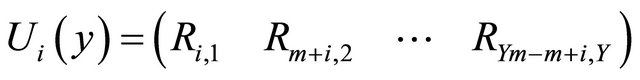 (16)
(16)
and applying Fourier transform to 
 (17)
(17)
The number of fundamental frequency distributions that can be obtained equals the number of instruments included in the target mixed music signal.
4. Experiments
4.1. Conditions
To evaluate our method, we used two songs that contain violin and piano music that is being played at the same time for about 1 second (Table 1).The signals are recorded at a 16 kHz sampling rate using MIDI instruments. Figure 5 shows the observed spectrum extracted from data A. The line observed at A3 represents the fundamental frequency of the violin, and the line observed between A3 and A4 represents the fundamental frequency of the piano. Figure 6 shows the observed spectrum extracted from data B. The line observed at A3 represents the fundamental frequency of the piano, and the line observed between A3 and A4 represents the fundamental frequency of the violin. Wavelet transform with Gabor function is applied to the experimental data
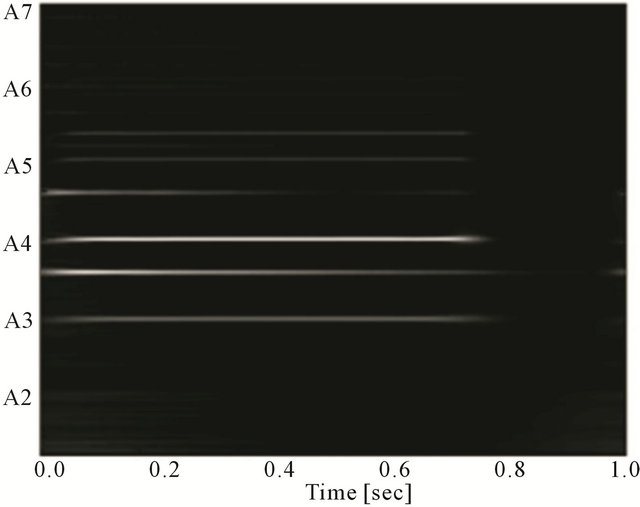
Figure 5. Observed spectrum of mixed music (data A).
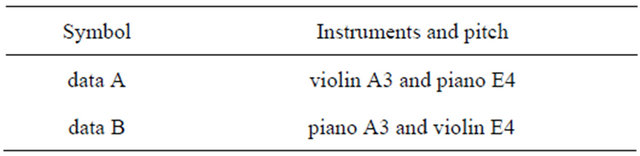
Table 1. List of experimental data.
to obtain the spectrum.
The harmonic structure matrix  is generated using a prepared harmonic structure corresponding to the instrument and pitch used in the experiment. Singular value decomposition is applied to the harmonic structure matrix
  in order to calculate the pseudo inverse matrix
 .
.
4.2. Results
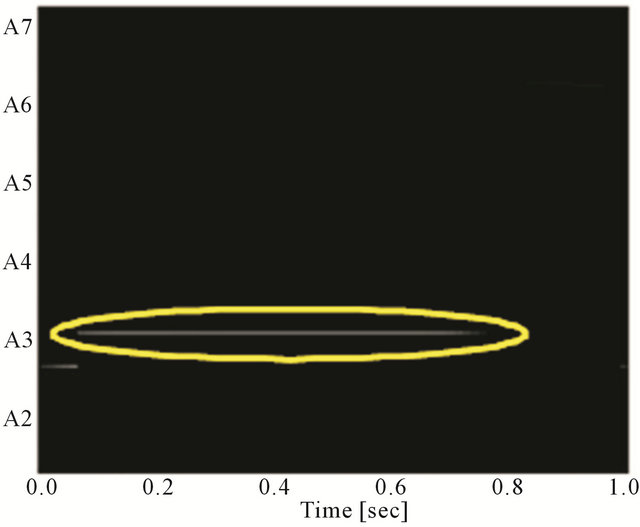
Figures 7 and 8 show the analysis results for data A
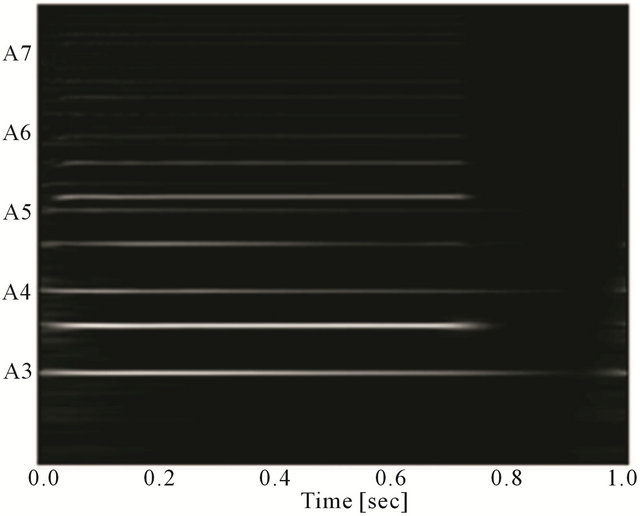
Figure 6. Observed spectrum of mixed music (data B).
 (a)
(a)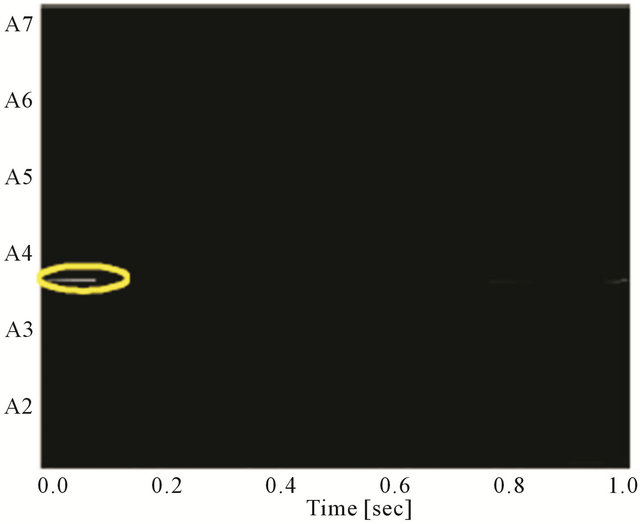 (b)
(b)
Figure 7. Analysis results of mixed music of data A. The lines circled by yellow indicate the fundamental frequency. (a) Analysis result of violin; (b) Analysis result of piano.
 (a)
(a)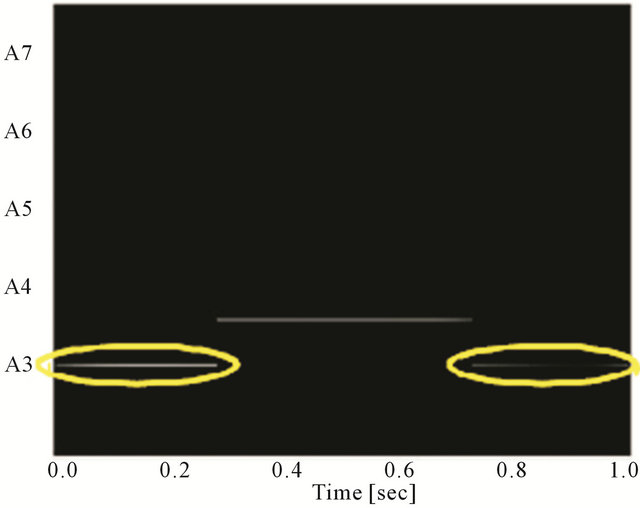 (b)
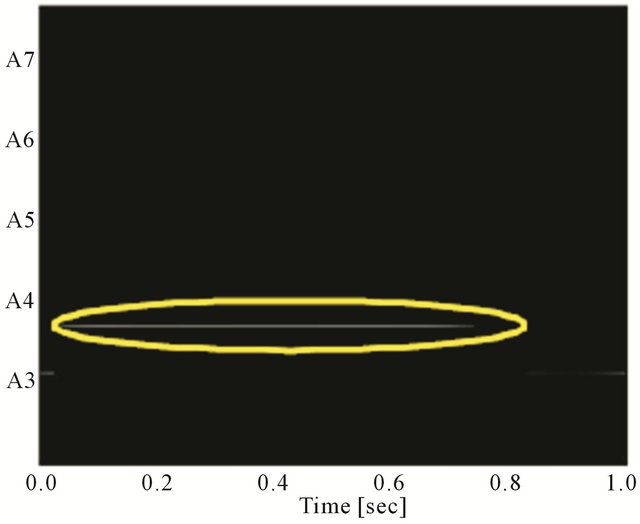
(b)
Figure 8. Analysis results of mixed music of data B. The lines circled by yellow indicate the fundamental frequency. (a) Analysis result of violin; (b) Analysis result of piano.
and data B, respectively. The yellow circles indicate the original fundamental frequencies. In data A, the violin was analyzed correctly between about 0.1 seconds and about 0.8 seconds, and the piano was analyzed correctly from the beginning to about 0.2 seconds. In data B, the violin was analyzed correctly between about 0.1 seconds and about 0.7 seconds, and the piano was analyzed correctly from beginning to about 0.3 seconds and between about 0.7 seconds and about 1.0 seconds.
Some mistaken points are considered to be caused by differences among the envelopes corresponding to each instrument. The physical length of a tone varies by the instrument since the envelope differs based on the instrument even if the same tones are played. For a piano, it is said that the sustain time is 0 seconds and the note decays as soon as it culminates. For a violin, meanwhile, the length of a note can be expressed more faithfully to the score than with a piano since the sustain time is adjustable depending on the player. Because both data A and data B were mistaken when the note sounded lower than the other instrument, it is considered that the mistakes are caused by the difference of envelopes among the instruments.
5. Conclusion
In this paper, we proposed a mixed music analysis method with extended specmurt. Our method can obtain as many fundamental frequency distributions as there are instruments included in the mixed music by applying the matrix representation to the conventional specmurt. The experiments show our method is effective for mixed music. In the future, we will study how to analyze mixed music without prepared harmonic structures, and improve the method by taking the envelope-related features into account.
REFERENCES
- L. R. Rabiner, “On the Use of Autocorrelation Analysis for Pitch Detection,” IEEE Transactions on Acoustics, Speech, and Signal Processing, Vol. 25, No. 1, 1977, pp. 24-33. doi:10.1109/TASSP.1977.1162905
- D. J. Hermes, “Measurement of Pitch by Subharmonic Summation,” Journal of ASA, Vol. 83, No, 1, 1988, pp. 257-264. doi:10.1121/1.396427
- Y. Takasawa, “Transcription with Computer,” IPSJ, Vol. 29, No. 6, 1988, pp. 593-598.
- T. Miwa, Y. Tadokoro and T. Saito, “The Pitch Estimation of Different Musical Instruments Sounds Using Comb Filters for Transcription,” IEICE Transactions (D-II), Vol. J81-D-II, No. 9, 1988, pp. 1965-1974.
- K. Kashino, K. Nakadai, T. Kinoshita and H. Tanaka, “Organization of Hierarchical Perceptual Sounds: Music Scene Analysis with Autonomous Processing Modules and a Quantitive Information Integration Mechanism,” Proceedings of International Joint Conferences on Artificial Intelligence, Vol. 1, 1995, pp. 158-164.
- K. Kashino, T. Kinoshita, K. Nakadai and H. Tanaka, “Chord Recognition Mechanisms in the OPTIMA Processing Architecture for Music Scene Analysis,” IEICE Transactions(D-II), Vol. J79-D-II, No. 11, 1996, pp. 1762- 1770.
- A. Klapuri, T. Virtanen and J. Holm, “Robust Multipitch Estimation for the Analysis and Manipulation of Polyphonic Musical Signals,” Proceedings of the COST-G6 Conference on Digital Audio Effects, Verona, 7-9 December 2000, pp. 233-236.
- T. Virtanen and A. Klapuri, “Separation of Harmonic Sounds Using Linear Models for the Overtone Series,” Proceedings of ICASSP 2002, Vol. 2, 2002, pp. 1757- 1760.
- M. Goto, “F0 Estimation of Melody and Bass Line in Musical Audio Signals,” IEICE Transactions(D-II), Vol. J84-D-II, No. 1, 2001, pp. 12-22.
- M. Goto, “A Real-Time Music Scene Description System: Predominant-F0 Estimation for Detecting Melody and Bass Lines in Real-World Audio Signals,” Speech Communication, Vol. 43, No. 4, 2004, pp. 311-329. doi:10.1016/j.specom.2004.07.001
- K. Miyamoto, H. Kameoka, T. Nishino, N. Ono and S. Sagayama, “Harmonic, Temporal and Timbral Unified Clustering for Multi-Instrumental Music Signal Analysis,” IPSJ SIG Technical Report, 2005-MUS, Vol. 82, 2005, pp. 71-78.
- H. Kameoka, J. Le Roux, N. Ono and S. Sagayama, “Harmonic Temporal Structured Clustering: A New Approach to CASA,” ASJ, Vol. 36, No. 7, 2006, pp. 575- 580.
- K. Miyamoto, H. Kameoka, T. Nishimoto, N. Ono and S. Sagayama, “Harmonic-Temporal-Timbral Clustering (HTTC) for the Analysis of Multi-Instrument Polyphonic Music Signals,” IEEE International Conference on ICASSP 2008, Las Vegas, 31 March-4 April 2008, pp. 113-116. doi:10.1109/ICASSP.2008.4517559
- K. Takahashi, T. Nishimoto and S. Sagayama, “MultiPich Analysis Using Deconvolution of Log-Frequency Spectrum,” IPSJ SIG Technical Report, 2003-MUS, Vol. 127, 2008, pp. 113-116.
- S. Sagayama, K. Takahashi, H. Kameoka and T. Nishino, “Specmurt Analysis: A Piano-Roll-Visualization of Polyphonic Music Signal by Deconvolution of Log-Frequency Spectrum” Proceedings of the ISCA Tutorial and Research Workshop on Statistical and Perceptual Audio Processing (SAPA2004), Jeju, 3 October 2004.
- H. Kameoka, S. Saito, T. Nishino and S. Sagayama, “Recursive Estimation of Quasi-Optimal Common Harmonic Structure Pattern for Specmurt Analysis: PianoRoll Visualization and MIDI Conversion of Polyphonic Music Signal,” IPSJ SIG Technical Report, 2004-MUS, Vol. 84, 2004, pp. 41-48.
- S. Saito H. Kameoka, T. Nishimoto and S. Sagayama, “Specmurt Analysis of Multi-Pitch Music Signals with Adaptive Estimation of Common Harmonic Structure,” Proceedings of the International Conference on Music Information Retrieval (ISMIR2005), London, 11-15 November 2005, pp. 84-91.
- S. Saito, H. Kameoka, K. Takahashi, T. Nishimoto and S. Sagayama, “Specmurt Analysis of Polyphonic Music Signals,” IEEE Transactions on ASLP, Vol. 16, No. 3, 2008, pp. 639-650. doi:10.1109/TASL.2007.912998