Journal of Biomedical Science and Engineering
Vol.7 No.4(2014), Article ID:43965,10 pages DOI:10.4236/jbise.2014.74025
Brain Function Diagnosis Enhanced Using Denoised fNIRS Raw Signals
Ahmad Chaddad
MD Anderson Cancer Center, University of Texas, Houston, USA
Email: ahmad8chaddad@gmail.com
Copyright © 2014 by author and Scientific Research Publishing Inc.
This work is licensed under the Creative Commons Attribution International License (CC BY).
http://creativecommons.org/licenses/by/4.0/


Received 11 February 2014; revised 12 March 2014; accepted 19 March 2014
ABSTRACT
Nowadays, brain function evaluation using Functional Near Infrared Spectroscopy (fNIRS) is one of the most potential non-invasive monitoring techniques. This paper concerns usefulness of the NIRS signals denoising using the Hemodynamic Evoked Response (HomER) as graphical user interface displays the NIRS data, fast independent component analysis (FASTICA) method to reduce data dimension and the combined Wavelet & PCA method for enhancing NIRS signals. NIRS signals include many types of noise, spread across a broad spectrum of frequencies, such as: low frequency noise from respiratory interference, 0.1 - 0.3 Hz, Mayer wave, about 0.1 Hz, cardiac interference, 0.8 - 2.0 Hz, and other artifacts from head and facial motions. Meanwhile, electronic components generate high frequency noise. Multi-resolution wavelet and PCA was applied successfully to enhance the NIRS signals. It consists of adaptively modifying the wavelet coefficients based on the degree of noise contamination of the processed NIRS signal. This is done subsequently to the signal pre-processing by reducing data dimension using the FASTICA method. We demonstrate, using signal-to-noise ratio and correlation indicators, that the technique used is superior to the wavelet and moving average filter and outperforms the proposed denoising NIRS signal.
Keywords:fNIRS; FASTICA; PCA; Wavelet

1. Introduction
NIRS is a new medical device that can be used for long term monitoring of brain activity in several diseases of the human brain. Recently several laboratories have focused on NIRS for functional imaging. Among the most common methods used in the clinical setting are the traditional methods of magnetic resonance imaging (MRI) and positron emission tomography (PET). NIRS is a new technique in the medical imaging field. NIRS is gaining recognition amongst clinicians as it has enabled functional studies of most areas of the brain. These studies focus on research for the prevention and treatment of strokes [1] [2] , the observation of the state of newborn and adult brains, and the rehabilitation [3] of the brain after strokes. Additionally, research is exploring its application to the study of certain psychiatric disorders. NIRS works primarily by sensing the oxygen variation in the blood through the absorption of red and near-infrared light [4] . In NIRS, a light with a wavelength ranging from 630 nm to 1000 nm is applied to the head and passes through the brain. The amount of light detected corresponds directly to the amount of oxygen present, which is of course a function of the oxy-deoxy hemoglobin concentration and the amount of blood present in the brain. Oxy-deoxyhemoglob based on the absorption and diffusion computation of light in the near infrared spectrum [5] ; thus, the corresponding wavelengths can be determined. In last 10 years, NIRS has become the focus of several laboratories’ research. The goal is to improve it for use in medical equipment for monitoring brain function. When using NIRS to study changes in oxy-deoxygenated hemoglobin in brain and scalp tissue, noise signals will reflect the subject (patient) movements since such motion will cause changes in scalp blood circulation. This type of noise is typically present in NIRS signals and results in significant distortion of NIRS data. Unfortunately, such noise appears quite regularly but without constant amplitude or location, meaning that it can be found anywhere in the spectrum. This noise is random and we have no prior information about such artifacts; however, several methods have been proposed for de-noising and/or removal of interference and motion artifacts from NIRS signals. Additionally, numerous methods exist to reduce global interference, which causes physiological noise effects. These methods consist of the subtraction of an average “noise” (cardiac) waveform [6] , low-pass filtering, principal components analysis and adaptive filtering using a pulse oximetry reference waveform [7] [8] . Unfortunately simple low-pass filtering is a weak method in NIRS signals de-noising, because the frequency bands of physiological noise and stimulus evoked activations are highly overlapping. Subtraction of an average “noise” method corrects one type of oscillation but does not consider the non-stationarity of the oscillation shape. Recently, adaptive filtering has been proposed as a possible method to NIRS noise removal. This latest method requires a reference signal correlated with the noise signal that should be removed [9] [10] . This method is also applicable to the removal of motion artifacts. To achieve this, we apply “Sources-Detectors”, which are co-located sources and detectors in each optode [11] . Additionally, some people suggest the application of wavelet decomposition for the detection and removal of interference from the NIRS signal [12] -[14] . All of these methods of denoising a NIRS signal are applied, but their success depends upon several factors such as “Sources-Detectors” positions, distance, and type of electronic components and the status of subjects.
In this paper, we address the task of NIRS signal denoising to enhance quality of diagnosis based on the new NIRS system. We consider the following candidate technique to obtain NIRS dataset: HomER toolbox, FASTICA, and wavelet with PCA. These techniques are the most commonly used NIRS based data. A toolbox HomER is applied to be the brain-computer interface and analyse the data in real time. We employ a FASTICA method to reduce the dimension of the data. Followed by the wavelet and PCA method to denoising the NIRS signals, performance measurements are employed to evaluate the denoising signals in terms of signal quality enhancement.
This paper is organized as follows: Section 2 briefly reviews and presents the extract NIRS signal using optical measurement via a continuous wave. Section 3 displays sources and types of noise. We describe methods and materials used in ICA for reducing data dimension, Multivariate Wavelet with PCA for denoising data, and the steps of our algorithm with performance measurements in Section 4. Experimental results and discussions based on a comparative study are presented in Section 5. Finally, conclusion is provided in Section 6.
2. Extract NIRS Signals
While many techniques exist for creating NIRS signals, in our work, we focus on optical measurement by continuous wave (CW). CW is most commonly used to evaluate brain function imaging. It consists of high temporal resolution and low cost photon detectors. Alternative types of NIRS creation are more complex. Some use light sources to measure the phase of the recovered signals (Frequency domain) or the temporal distribution of photons (Time domain). The Frequency and Time domain method is advantageous as it creates a three-dimensional (3D) image. NIRS by CW uses light sources to emit a continuous permanent beam at a specific location point in the tissue. Near infrared light can enter deep into the scalp via transfusion through the scalp layers: cranium, dura mater, arachnoids, subarachnoid space, pia mater and cerebral cortex (see Figure 1). The light penetration is a function of the separation between the source and the detector. As the distance increases the light transfuses

Figure 1. Schemas of CW-NIRS data acquisition system and the position of light sources and detectors.
deeper; however, the common limit on separation is usually interoptode distance (IOD) of 3 cm. While we have described a single source-single detector system, in actuality we used a network of sources and detectors on the subject’s head, each separated by approximately 3 cm. The measured quantity is directly related to the change in optical density ΔOD that occurs between the source and the detector. Each detector reports a voltage linearly varying with the amount of light detected. To obtain the chromophore concentration (Ci) for each detector, we often used Beer-Lambert law to convert light intensity to Ci according to the mathematical model shown in the following equation:
 (1)
(1)
where I0 is an input light intensity and I1 is an output light intensity. λ is the wavelength of source light, αi is the corresponding in tissue absorption, L is the path length between the optodes emission and detection, and c is the chromophore concentration. There are two major issues inherent to the basic form of Beer-Lambert equation. First, it does not consider diffusion, which would of course give rise to significant errors in the study. Second, the distance between the optodes does not correspond exactly to the distance traveled by light. To correct this error, a Differential path Length Factor (DPF) is added to the Beer-Lambert equation. Additionally a constant must be added to the equation for the diffusion model. This constant, however, creates a new problem in that CW-NIRS cannot evaluate this constant. In order to solve this problem, it is necessary to transform this equation to differential form. This does not obtain absolute concentrations; rather, it provides changes in concentration over time [15] . Using two different wavelengths, we construct a system of two linear equations with two unknowns:
Δ[HbO2] and Δ[HbR] as shown in the following equation:
 (2)
(2)
where Δ[HbO2] and Δ[HbR] are the chromophore concentration changes of oxyhemoglobin and de-oxyhemoglobin respectively. εHbO2(λ) and εHbR(λ) are extinction coefficients, and ΔOD(λ) is the change in optical density measured at a given wavelength.
There are several factors that influence the accuracy of the measurements such as: choice of illumination wavelength, optodes positions, noise from electrical interferences, physiology noise and environmental subjectivity. Due to this, a signal processing is a necessary step to reduce noise from the light intensity signal. Noise sources will be discussed in detail in the following section.
3. Noise Types
3.1. Physiological Noise
NIRS physiological noise is the internal noise that arises while the patient is immobile. Though we find noise on NIRS signal, we can’t delete this type of noise because we have almost no information about it. To deal with itwe use an average filter to reduce the power of the noise. Sources of this noise found in the NIRS signal is the frequency of the heartbeat, about 0.7 to 1.5 Hz, the frequency of blood pressure or Mayer wave, 0.1 Hz, and the frequency of breathing, between 0.13 and 0.33 Hz. These frequencies appear in the signal as noise. Additionally, hemodynamic fluctuation cycle is considered noise; however, this particular noise is useful in identifying normal and sick subjects.
3.2. Electronics Components and Experimental Noise
Electronic noise results from the electronic components used in the experiment and is generally found in the frequency domain. To eliminate it, we always use a low-pass filter. Interference light can be minimized by modulating the emitted light and demodulating the detected signal. Additional experimental noise is motion artifact. This noise is difficult to handle because motion artifact appears as appropriate information. This is due to optode position and weak contact between electrodes and head. Recently several methods have been proposed to reduce the impact of motion artifact using Wiener, Kalman filtering and Wavelet-based [16] -[18] , to add to the filtering proposed in the introduction. Finally, to improve the quality of our data, it’s necessary to ensure we have good coupling with the skin. With all this, if there are no physiological oscillations present, meaning there is no signal detection from our optical receiver, then it is clear that we have a problem in optode. Figure 2 presents types of signals and noises from NIRS.
4. Materials and Methods
Schematic representation of a NIRS system for brain functional evaluation is shown in Figure 1. The dataset is obtained from Polystim laboratory, Montreal, Canada. Raw data of 47 patients have a stroke disease has been analyzed to test the performance of the proposed approach. The age of the patients in the dataset ranges from 20 to 70 years. In the following, a brief description of signals extraction using the NIRS system and their enhancement signals. Here, the NIRS signals were analyzed in preprocessing to get the Δ[HbO2] and Δ[HbR].
As mentioned above, each type of filter discussed can help in de-noising NIRS signal; however, we have no filter to efficiently remove all noise types because we have a variable frequency with variable magnitude. To accommodate such variability, we need a filter with adaptability. Each recorder consists of 24 NIRS signals (12 by λ735 nm and 12 by λ850 nm). We used independent component analysis (ICA) to reduce large dimension data, and then we applied multivariate de-noising using wavelets and principal component analysis. Figure 3 presents our methodology for the signal processing to evaluate brain function based on NIRS data.
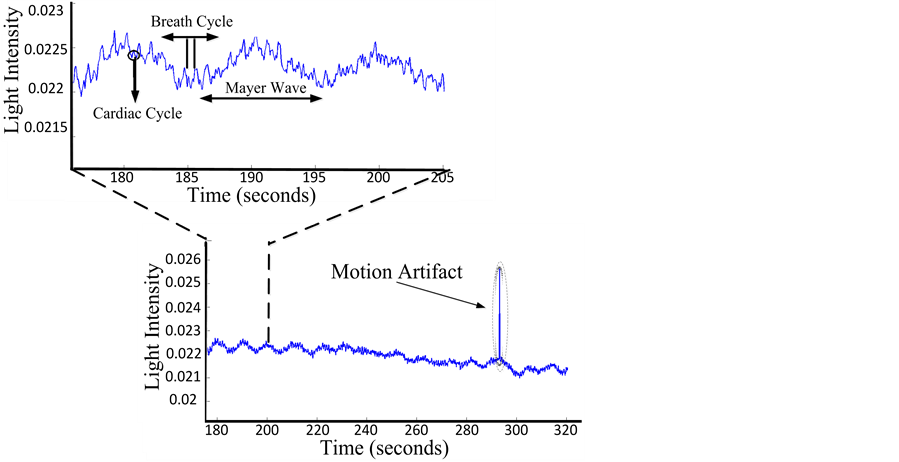
Figure 2. Schemas of physiological oscillations including the cardiac cycle, breath cycle, motion artifact (right side) and Mayer waves.
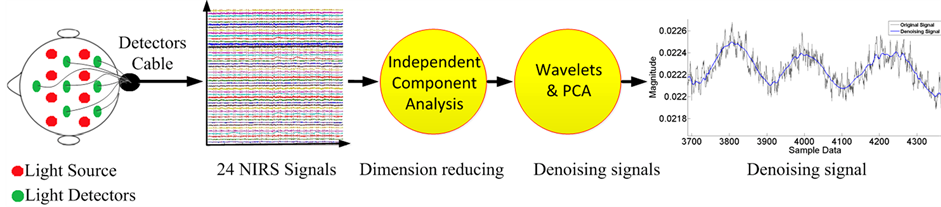
Figure 3. Schematic of the NIRS data analysis, The NIRS data from detectors, then 24 signals, is reduced by ICA method and after which de-noising by wavelets and principal component analysis occurs.
We extracted 24 NIRS signals; this refers to the coupling of source-detector (S1D1, S1D2, S1D3…S4D1…. etc.). We obtained a matrix [24*number of samples] and reduced it by ICA method. This step can reduce the global noise when it appears only in independent signals.
4.1. Independent Component Analysis Method
ICA is a multivariate data analysis that has been studied recently in the signal processing community for blind source separation. This work proposes to demonstrate the interest of ICA in a particular to reduce the dimension of the original data. The concept of ICA assumes that data is linearly mixed via a set of separate independent sources and then separates these signal sources according to their statistical independency as measured by mutual information [19] -[22] . The model for ICA can be expressed with the following mathematical equation:
![]() (3)
(3)
where x is the mixed signal source vector, A is the mixing matrix and s is the signal source. The goal of ICA method is to find a demixing matrix A‒1 that separates the signal source vector S into a set of sources that are statistically independent, meaning A‒1 is the inverse matrix to go from the source vector S to the signal vector X. The estimated independent source signals should be equal to the original independent source signals. Our computed S depends upon the following expression:
 (4)
(4)
Our algorithm is based on the FASTICA in which negentropy is utilized as it is an excellent measurement of non-Gaussianity. This method can be reduced our NIRS data (24 signals* number of samples) without negatively affecting of the appropriate information in each signal. A limiting factor of ICA methods, as with all methods, is that it cannot give the same performance with high dimensionality because it will not diffuse the internal structure of NIRS data [23] [24] . Figure 4 presents a model of the ICA method and its implementation will present in algorithm subsection.
4.2. Multivariate Wavelet Denoising NIRS Signals Using PCA
The wavelet transform method effectively applies with many different types of signals in order to detect frequencies as a function of time. Due to the aforementioned NIRS channels characteristics, multivariate wavelet denoising is a good method to reduce global noise from signals. The concept uses principal component analysis to kill insignificant principal components in order to obtain an additional denoising effect. This method does not aim to discover new variables of interest, but to simply eliminate insignificant components. A multiscale of PCA has been proposed by Bakshi in order to fine tune the limits in statistical process control and dimensionality reduction of data. Classically, we make PCA based on the symmetric covariance or correlation matrix. This matrix can be computed from the data matrix where the covariance matrix is scaled by sums of squares and cross products. We apply the same methodology for computing the correlation matrix. PCA solves the eigenvalues and eigenvectors of a square symmetric matrix with sums of squares and cross products. The eigenvector associated with the largest eigenvalue reflects the same orientation as the first principal component and the eigenvector associated with the second largest eigenvalue determines the orientation of the second principal component. The trace of this square matrix represents the sum of the eigenvalues, while the number of columns in the matrix represents the number of eigenvectors. Multiscale PCA begins with a multivariate signal, “NIRS Signals”, and

Figure 4. Model of ICA method in general case.
uses a simple representation at each resolution level. By this step, we can generalize a normal PCA of a multivariate signal represented as a matrix of different levels simultaneously. We used PCA to perform an approximation of the coefficients matrix in the wavelet, and finally we reconstructed NIRS signals by selecting the number of retained principal components [25] -[30] .
4.3. Algorithm
The Matlab algorithm we developed includes two consecutive parts. First it receives 24 to 32 channels of Near Infrared Spectroscopy from a portable NIRS device, which is data based on a HomER toolbox that records and processes in real time. Specification of the Toolbox allows the algorithm to perform the 24 or 32 signals and apply different signals and image processing techniques. In the second part, the algorithm extracts and reduces the data using FASTICA toolbox, and then applies a Multivariate Wavelet denoising with PCA in order to produce data with as minimal noise as possible. Finally, it measures several performance indicators: Signal to Noise Ratio and correlation in order to evaluate enhanced data or signals [31] . We used 24 signals including 12 signals based on λ735 and 12 signals based λ850. We reduced and observed data, with the percent of data reduction set to 33.4%. Our algorithm, shown below, is divided into the following three steps:
1) We use homer Toolbox to extract signals from our data acquisition system and perform our analysis. We save our data as NIRS format “.nirs” for independent processing. Additionally, this toolbox possesses the capability to reconstruct an image from obtained signals.
2) Next, we use FASTICA for reducing the dimension of our data using negentropy technique according to the following stages:
a) Center the data “signal” or take the mean of the data, E{signal}
b) Whiten signal to maximize non-Gaussian characteristics: “filtering”, E{xxT}, …
c) Choose an initial random vector, ||A||=1, …
d) Normalize the non-Gaussian where A=A/||A||, …
e) Iterate until convergence f) Compute the final independent component where S=[A1 A2 A3 ××× An] * X g) Separate the sources where S1 S2 S3 S4 ××× Sn are source signals.
3) Lastly, we use Multivariate Wavelet denoising with PCA to reduce the global noise because simply performing step 2 is not sufficient to enhance the quality of the NIRS signals. The technique used here is divided into the following stages:
a) Read multivariate signals (S1×××Sn)
b) Determine the level of wavelet decomposition c) Choose retained number of principal components based on Kaiser’s rule and perform multiscale of PCA.
In order to evaluate our performance algorithm for enhancing NIRS signals, we computed the signal to noise ratio SNR and correlation coefficient between signals processed and the original signals. These indicators can be expressed by the following equations:
 (5)
(5)
The SNR indicator computed represents a comparison between the original signal power and the noise signal power. SNR value reflects enhancement by signal processing.
 (6)
(6)
where σs and σx are the standard deviations of source signal and output signal respectively.
We computed the correlation coefficient as a second indicator for evaluating the relationship between source signal (s) and output signal (x), where s is the original signal and x is the signal after noises cancelation. Figure 5 illustrates in details the processing of the 3 initial steps of the general algorithm.
5. Experimental Results and Discussions
We first provide some results on natural NIRS signals in order to understand the improvements obtained using our methodology. All the experiments were done on Matlab v. 2012a, run on an Intel core i7, 3.2 GHz processor. As we mentioned above, our algorithm divides into 3 principal steps. Via empirical computation, we arrived at 33.4% reduction of data dimension. FASTICA is efficient for pre-denoising and strong for reducing data dimension. Based on this, we present results of denoising signals by Wavelet and principal component analysis as illustrated in Figure 6. Evaluation of the performance of denoising the signal is presented in Table 1. It presents
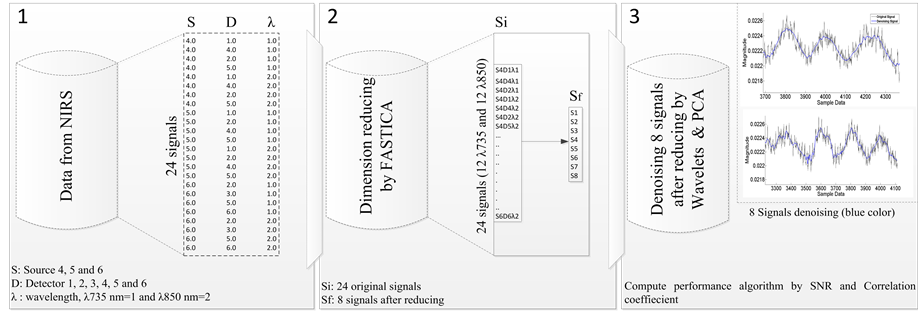
Figure 5. Scheme of general algorithm applied on NIRS system.
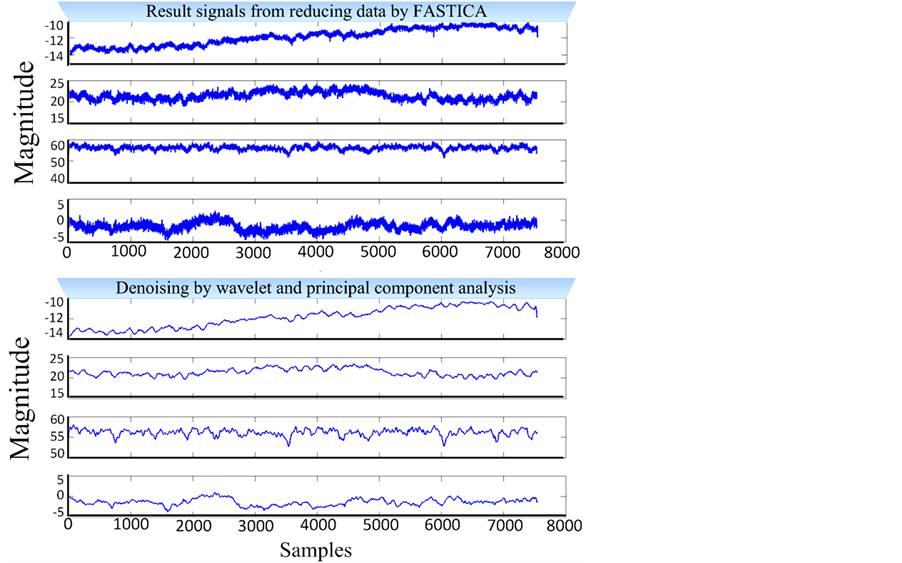
Figure 6. Result of denoising applied to NIRS signals after FASTICA reduced dimension processing.

Table 1. Results of signal to noise ratio and the correlation.
signal to noise ratio (SNR) and correlation (Corr) applied on three denoising techniques. These indicators demonstrated good average results for SNR (31.9252) and correlation (0.9005) of multivariate wavelet & PCA. It is clear from our SNR and Correlation values for wavelet and multivariate wavelet & PCA that these are, in principle, more adapted to the NIRS data. The results of Table 1 show the variation between adaptive methods (wavelet and multivariate wavelet & PCA) and a non-adaptive denoising method (moving average filter). Note, adaptive methods are not limited to the two methods applied to NIRS data. However, in the case of our NIRS device we have no ideal signal as reference to apply other adaptive methods. In addition, the noise quantity on NIRS signals reflects the type of light sources and detectors. When we have good light quantity emitted, these light detectors will give us quality information represented by high magnitude signals. We choose to do a compromise among the following constraints in order to get minimum noise and thus receive accurate medical diagnoses: miniaturized NIRS device, reduced power consumption, minimized electronic component noise [32] [33] . Miniaturized NIRS device used a low power consumption which provides weak amplitude of NIRS signals.
6. Conclusions
In this paper, we presented a new algorithm dedicated to processing NIRS signals based on HomER toolbox for extracting NIRS signals, a FASTICA method for reducing NIRS data, and Wavelet & PCA for efficiently denoising NIRS signals, while all sub-algorithms used Matlab v. 2012a.
Simulation results of the FASTICA method displayed an efficiency in data reducing at 33.4% (3 signals taken from 12 signals based on wavelength 735 nm and 3 signals taken from 12 signals based on wavelength 850 nm). Denoising achieved using multivariate wavelet & PCA. We provided a performance indicator using SNR (31.9252) and correlation (0.9005). These indicators displayed an advantage to our methods relative to conventional methods in denoising signals. Our algorithm is adaptive to several types of biomedical signals such as EEG and ECG. Furthermore, the three steps composing our algorithm are relatively simple. Multivariate wavelet & PCA uses the principle of thresholding, which makes no complicated assumptions on the structure of the signal; thus, no particular model of the NIRS signal is needed to be assumed. The denoising method should, therefore, be chosen according to the signals in hand. So, in our case, we found Multivariate wavelet & PCA is a successful, fully adaptive method for our type of NIRS signals. With this in mind, further work will focus on developing a hardware implementation of FPGA in order to achieve robustness and extract high quality information for proper medical diagnoses.
Acknowledgements
Authors would like to acknowledge financial support from CIHR, Heart & Stroke Foundation, and Canada Research Chair in Smart Medical Devices. The authors wish to thank Montreal Heart Institute, Imaginc Group, the Ste_Justine and the Geriatric Hospital Groups in Montreal.
References
- Ertelt, D., et al. (2007) Action Observation Has a Positive Impact on Rehabilitation of Motor Deficits after Stroke. NeuroImage, 36, 164-173. http://dx.doi.org/10.1016/j.neuroimage.2007.03.043
- De. Vries, S. and Mulder, T. (2007) Motor Imagery and Stroke Rehabilitation: A Critical Discussion. Journal of Rehabilitation Medicine, 37, 5-13. http://dx.doi.org/10.2340/16501977-0020
- Coyle, S., et al. (2004) On the Suitability of Near-Infrared (NIR) Systems for Next-Generation Brain-Computer Interfaces. Physiological Measurement, 25, 815-822. http://dx.doi.org/10.1088/0967-3334/25/4/003
- Jöbsis, F.F. (1977) Noninvasive, Infrared Monitoring of Cerebral and Myocardial Oxygen Sufficiency and Circulatory Parameters. Science, 198, 1264-1267. http://dx.doi.org/10.1126/science.929199
- Ferrari, M., Binzoni, T. and Quaresima, V. (1997) Oxidative Metabolism in Muscle. Philosophical Transactions of the Royal Society B, 352, 677-683. http://dx.doi.org/10.1098/rstb.1997.0049
- Gratton, G. and Corballis, P.M. (1995) Removing the Heart from the Brain: Compensation for the Pulse Artifact in the Photon Migration Signal. Psychophysiology, 32, 292-299. http://dx.doi.org/10.1111/j.1469-8986.1995.tb02958.x
- Morren, G., et al. (2004) Detection of Fast Neuronal Signals in the Motor Cortex from Functional near Infrared Spectroscopy Measurements Using Independent Component Analysis. Medical & Biological Engineering & Computing, 42, 92-99. http://dx.doi.org/10.1007/BF02351016
- Victor, S., Jonatan, L. and Miroslav, V. (2013) Adaptive Filter Support Selection for Signal Denoising Based on the Improved ICI Rule. Digital Signal Processing, 23, 65-74. http://dx.doi.org/10.1016/j.dsp.2012.06.014
- Izzetoglu, M., et al. (2005) Motion Artifact Cancellation in NIR Spectroscopy Using Wiener Filtering. IEEE Transactions on Biomedical Engineering, 52, 934-938. http://dx.doi.org/10.1109/TBME.2005.845243
- Quan, Z., et al. (2009) Adaptive Filtering to Reduce Global Interference in Non-Invasive NIRS Measures of Brain Activation: How Well and When Does It Work? Neuroimage, 45, 788-794. http://dx.doi.org/10.1016/j.neuroimage.2008.12.048
- Robertson, F.C., Douglas, T.S. and Meintjes, E.M. (2010) Motion Artifact Removal for Functional Near-Infrared Spectroscopy: A Comparison of Methods. IEEE Transactions on Biomedical Engineering, 57, 1377-1387. http://dx.doi.org/10.1109/TBME.2009.2038667
- Hiroki, S., et al. (2006) Within-Subject Reproducibility of Near-Infrared Spectroscopy Signals in Sensorimotor Activation after 6 Months. Journal of Biomedical Optics, 11, 14-21.
- Molaviet, B. and Dumont, G.A. (2012) Wavelet-Based Motion Artifact Removal for Functional Near-Infrared Spectroscopy. Physiological Measurement, 33, 259-270. http://dx.doi.org/10.1088/0967-3334/33/2/259
- Jang, K.E., et al. (2009) Wavelet Minimum Description Length Detrending for Near-Infrared Spectroscopy. Journal of Biomedical Optics, 14, 1-13. http://dx.doi.org/10.1117/1.3127204
- Strangman, G., Franceschini, M.A. and Boas, D.A. (2003) Factors Affecting the Accuracy of Near-Infrared Spectroscopy Concentration Calculations for Focal Changes in Oxygenation Parameters. Neuroimage, 18, 865-879. http://dx.doi.org/10.1016/S1053-8119(03)00021-1
- Maryam, A. and Hamidreza, A. (2013) Statistical Modeling and Denoising Wigner-Ville Distribution. Digital Signal Processing, 23, 506-513. http://dx.doi.org/10.1016/j.dsp.2012.08.016
- Izzetoglu, M., et al. (2010) Motion Artifact Cancellation in NIR Spectroscopy Using Discrete Kalman Filtering. Biomedical Engineering Online, 9, 16. http://dx.doi.org/10.1186/1475-925X-9-16
- Behnam, M. and Guy, A.D. (2012) Wavelet-Based Motion Artifact Removal for Functional Near-Infrared Spectroscopy. Physiological Measurement, 33, 259-270. http://dx.doi.org/10.1088/0967-3334/33/2/259
- Engreitz, J., et al. (2010) Independent Component Analysis: Mining Microarray Data for Fundamental Human Gene Expression Modules. Journal of Biomedical Informatics, 43, 932-944. http://dx.doi.org/10.1016/j.jbi.2010.07.001
- Hyvarinen, A. and Oja, E. (2000) Independent Component Analysis: Algorithm and Applications. Neural Networks, 13, 411-430. http://dx.doi.org/10.1016/S0893-6080(00)00026-5
- Langlois, D., Chartier, S. and Gosselin, D. (2010) An Introduction to Independent Component Analysis: InfoMax and FastICA Algorithm. Tutorials in Quantitative Methods for Psychology, 6, 31-38.
- Toivianen, M., Corona, F., Paaso, J. and Teppola, P. (2010) Blind Source Separation in Diffuse Reflectance NIR Spectroscopy Using Independent Component Analysis. Journal of Chemometrics, 24, 514-522. http://dx.doi.org/10.1002/cem.1316
- Himberg, J., Hyvärinen, A. and Esposito, F. (2010) Validating the Independent Components of Neuroimaging Time Series via Clustering and Visualization. NeuroImage, 22, 1214-1222. http://dx.doi.org/10.1016/j.neuroimage.2004.03.027
- Tomé, A.M., Teixeira, A.R., Lang, E.W., Stadlthanner, K., Rocha, A.P. and Almeida, R. (2005) dAMUSE—A New Tool for Denoising and Blind Source Separation. Digital Signal Processing, 15, 400-421. http://dx.doi.org/10.1016/j.dsp.2005.01.004
- Aminghafari, M., Cheze, N. and Poggi, J.M. (2006) Multivariate Denoising Using Wavelets and Principal Component Analysis. Computational Statistics & Data Analysis, 50, 2381-2398. http://dx.doi.org/10.1016/j.csda.2004.12.010
- Bakshi, B. (1996) Multiscale PCA with Application to MSPC Monitoring. AIChE Journal, 44, 1596-1610. http://dx.doi.org/10.1002/aic.690440712
- Elise, M., Truntzer, C., Cardot, H. and Ducoroy, P. (2010) Multivariate Denoising Methods Combining Wavelets and Principal Component Analysis for Mass Spectrometry Data. PROTEOMICS, 10, 2564-2572. http://dx.doi.org/10.1002/pmic.200900185
- Yang, R.G. and Ren, M.W. (2011) Wavelet Denoising Using Principal Component Analysis. Expert Systems with Applications-ESWA, 38, 1073-1076.
- Zima, M., Tichavský, P., Paul, K. and Krajča, V. (2012) Robust Removal of Short-Duration Artifacts in Long Neonatal EEG Recordings Using Wavelet-Enhanced ICA and Adaptive Combining of Tentative Reconstructions. Physiological Measurement, 33, N39-N49. http://dx.doi.org/10.1088/0967-3334/33/8/N39
- Rebeca, R., Vélez-Pérez, H., Ranta, R., Louis Dorr, V., Maquin, D. and Maillard, L. (2012) Blind Source Separation, Wavelet Denoising and Discriminant Analysis for EEG Artefacts and Noise Cancelling. Biomedical Signal Processing and Control, 7, 389-400. http://dx.doi.org/10.1016/j.bspc.2011.06.005
- Mathworks (2012) Matlab Software. R2012a Version.
- Chaddad, A., et al. (2012) Optical Receiver Front-End Intended for a Detector of Near Infrared Spectroscopy System. Journal of Sensor Networks, 2, 24-31.
- Chaddad, A., Kamrani, E., Le Lan, J. and Sawan, M. (2013) Denoising fNIRS Signals to Enhance Brain Imaging Diagnosis. 29th Southern Biomedical Engineering Conference, Miami, 3-5 May 2013, 33-34.