Journal of Biomedical Science and Engineering
Vol.6 No.8(2013), Article ID:35604,11 pages DOI:10.4236/jbise.2013.68100
Holographic microwave imaging for medical applications
![]()
1Institute of Biomedical Technologies, Auckland University of Technology, Auckland, New Zealand
2Callaghan Innovation, Auckland, New Zealand
Email: luwang@aut.ac.nz, ahmed.al-jumaily@aut.ac.nz, ray.simpkin@callaghaninnovation.govt.nz
Copyright © 2013 Lulu Wang et al. This is an open access article distributed under the Creative Commons Attribution License, which permits unrestricted use, distribution, and reproduction in any medium, provided the original work is properly cited.
Received 29 May 2013; revised 11 July 2013; accepted 19 July 2013
Keywords: Aperture Synthesis Imaging; Brain Imaging; Brain Stroke; Breast Imaging; Breast Cancer; Microwave Imaging; Holographic Microwave Imaging; Holographic Microwave Imaging Array
ABSTRACT
This paper presents a new 2D holographic microwave imaging array (HMIA) technique for medical imaging applications. The HMIA technique has been applied to early stage breast cancer detection and brain stroke detection. Computer models are developed to demonstrate the feasibility of detecting and localizing small brain strokes within a 2D numerical head model and breast tumours within a 3D numerical breast model using the HMIA technique. Experimental validation of the HMIA simulation model using a breast phantom has been undertaken and demonstrated a good agreement between experimental and simulated images. Simulation and experimental results showed that the proposed HMIA technique has the potential to become a powerful medical screening and diagnostic tool.
1. INTRODUCTION
Breast cancer is a major killer of women worldwide [1]. At this stage there are no clear opportunities for prevention [2]. Studies have shown that only early detection (when the tumour less than 5 mm) and timely treatment can significantly increase the survival rate [3].
X-ray mammography is currently the gold standard medical imaging tool for breast tumour detection [4]. However, it has a number of limitations, such as missing approximately 10% - 30% of breast cancers [4], discomfort and unpleasant pain to the patient during operation [5], it is can be unsuitable for young women and breast feeding women [6] and the ionizing properties of X-rays restrict the frequency of screening [7]. These limitations of X-Ray mammography motivate the development of new alternate imaging modalities.
A brain stroke is the third leading cause of death after the heart disease and cancer [8]. Brain stroke is the rapid loss of brain functions due to a disturbance in the blood supply. Ischemic strokes account for approximately 87% of all strokes. The risk factors for stroke include old age, hypertension, transient ischemic attack, diabetes, highcholesterol, cigarette smoking and atrial fibrillation [9].
Computed Tomography (CT), Magnetic resonant Imaging scanning (MRI), Positron Emission Tomography (PET) and ultrasound are the most commonly available clinical imaging diagnosis tools for stroke detection [10]. However, these tools are not suitable for continuous monitoring of a stroke’s evolution due to of high cost, time consuming imaging operations and the imaging equipment is not portable. Moreover, CT imaging uses ionizing radiation that is harmful to the patient. These circumstances motivate the interest for new technologies that can supplement currently available imagining technologies to improve the overall effectiveness of the diagnosis [11].
Microwave based imaging techniques create a map of electromagnetic wave scattering arising from the contrast in the dielectric properties of different tissues. Using electromagnetic waves of radio range for non-invasive diagnostics and imaging of human organs and tissue has been researched extensively [12-17]. The use of microwave techniques in medial and security applications has attracted the interest of many research groups [18-28].
Microwave imaging has been considered as one of the most promising alternatives to X-ray mammography for early breast cancer detection and has received significant attention over the last two decades [18-28]. Recent investigations [29-31] have indicated that microwave imaging has the potential to determine perfusion related changes in the human brain and microwave based imaging approaches could be developed as a useful new imaging modality for stroke management. The advantages of microwave imaging include a whole view of body tissue, lower cost, more comfortable and no ionizing radiation.
A microwave holography imaging near-field technique has been proposed for breast cancer detection [32-34]. The results demonstrate that microwave holographic based techniques offer high resolution breast image at significantly lower cost because these techniques do not require expensive ultra-high speed electronics as narrow-band signals can be converted to the baseband for digitalization at a slower rate.
The aim of this study is to assess the feasibility and potential performance characteristics of our currently proposed 2D holographic microwave imaging array (HMIA) technique for medical imaging applications, with a particular focus on breast cancer and brain stroke detections.
2. THEORY
Figure 1 illustrates a flowchart of the 2D holographic microwave imaging array (HMIA) system. During operation, a two-port vector network analyzer (PNA) is connected with a single transmitter to generate microwave signals to a 2D or 3D dielectric object (in far-field) and the backscattered electric field from the object is measured by an array of N microwave receivers that is connected to the PNA. The measured data that contains the phase and magnitude of the reflection coefficient is used to calculate the complex visibility data using the 2D HMIA image algorithm [35]. An object scattering intensity distribution is formed by applying an inverse Fourier transform to the complex visibility data. A 2D projection image on a 2D plane of a 3D object is subsequently generated.
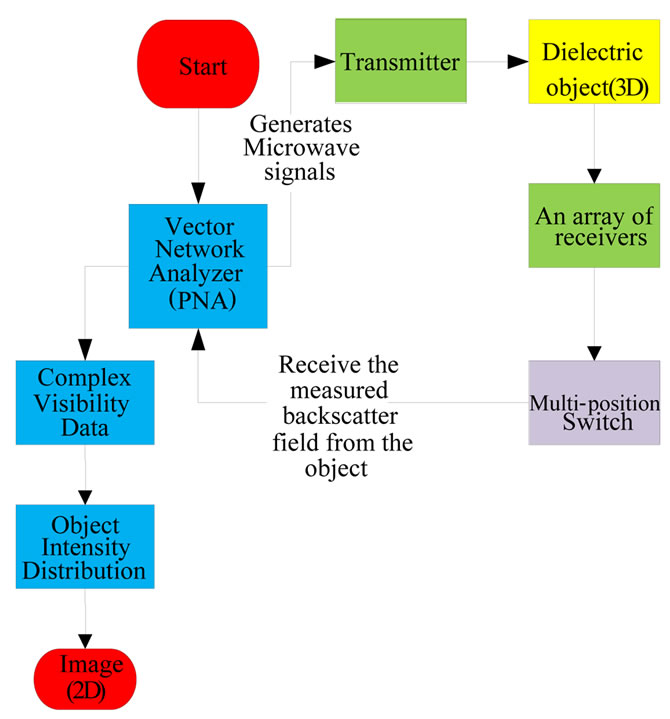
Figure 1. Flowchart of holographic microwave imaging setup.
If a point  is assumed within a dielectric object, in far-field from any two antennas located at
  and
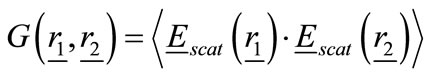
and  as shown in Figure 2. Then the visibility function of the backscattered electric field from the object for any two antennas is defined as:
 (1)
(1)
where * and <> in Eq.1 denote the complex conjugate and the expected value (time average).
The object intensity function at the position  is defined as:
 (2)
(2)
where  is the wave number in free space,
  is the wave number in the host medium,
  is the complex relative permittivity distribution of the object,
  is the complex relative permittivity of the host medium and
  is the total electric field (incident plus scattered) at a point inside the object with position vector
 .
.
Writing the Cartesian components of the baseline vector  as
as  such that:
 (3)
(3)
where  is the wavelength in host medium, if all antennas are assumed to be located on a 2D plane, then w = 0.
Figure 3 shows the spherical polar coordinate system,
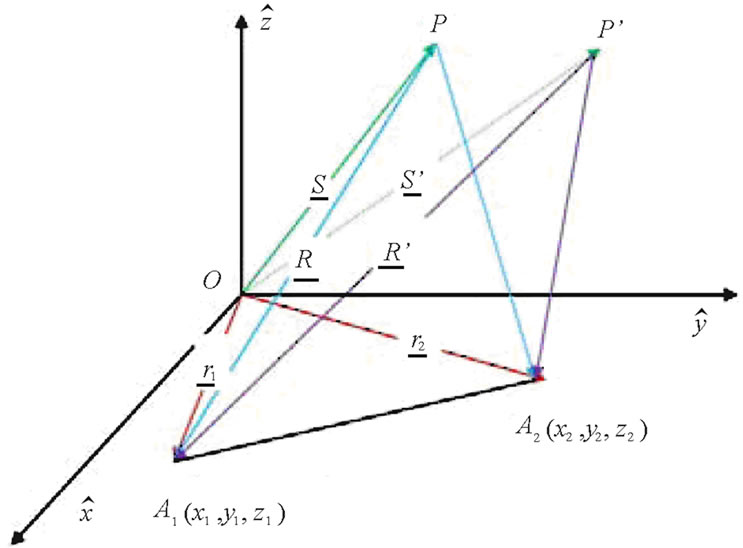
Figure 2. Geometry of HMIA measurements by a pair of antennas.

Figure 3. Spherical polar coordinate system.
defining new variables (l, m) as:
 (4)
(4)
the 2D object intensity distribution function can be expressed by using HMIA imaging algorithm [35]:
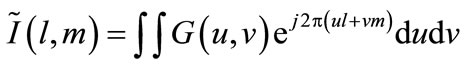 (5)
(5)
where .
.
The 2D image is the intensity function  represents the scattering intensity in the object integrated along each radial vector.
A zooming function can be applied to quantitatively asses imaging results by:
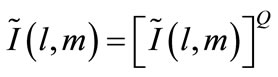 (6)
(6)
Eq.6 performs a Q:1 zoom on an image of the object. The development of 2D and 3D HMIA imaging algorithms are detailed in [35,36].
3. HMIAFOR BRAIN STROKE DETECTION
The 2D HMIA technique for brain stroke detection is designed for operating at a single frequency of 2.5 GHz. Figure 4 illustrates the HMIA system for a 2D head model [37]. The system contains an array of 16 small antennas, one is the transmitter and others are receivers which are located around the head model in far-filed distance. The space between the head model and antenna array was filled with air.
3.1. Simulation Forward Models
Figure 5 shows a 2D ellipse-shaped head model that has a major radius of 100 mm and a minor radius of 85 mm. The simulated 2D head model contains skin, fat, skull, cerebral spin fluid (CSF), grey matter, white matter and an ischemic stroke area. Colour bar plots the dielectric properties of the head. The head model was surrounded

Figure 4. Schematic HMIA system for 2D head model [37].
with air as well as the space between the head model and antenna array. The dielectric properties of the head model are summarized in Table 1 [29-30].
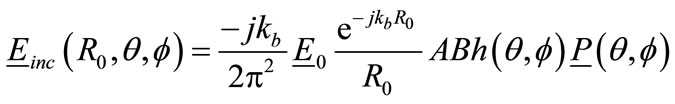
A wire antenna was simulated as the transmitter and receiver. The incident field of such antenna is given by:
 (7)
(7)
The left-hand side of Eq.7 is the incident field within the head model, which is always known. It then remains to solve for the total field  which is computed using MoM [39] to convert an integral equation into a set of linear simultaneous equations. The total electric field
  of the head at a point inside the head with position vector
  is the sum of the scattered filed
  and the incident field
 . Using the approach adopted by Richmond [40], we divide the area of the head into small area elements
  and assume that the field and the permittivity are constant with each
 . The integral in Eq.7 then becomes a sum over all the elemental areas. Eq.7 then becomes a matrix equation as follows:
 (8)
(8)
where ,
,  Identity matrix (N × N), [M] = Square matrix (N × N) with elements Mmn defined as follows (m = row index, n = column index).
The element of [M] is expressed as:
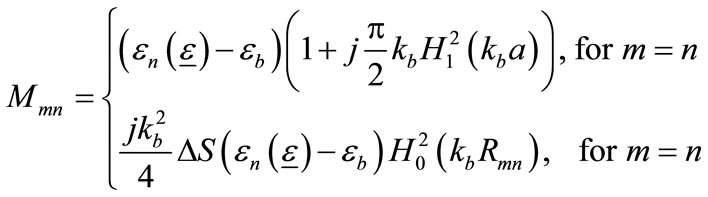
(9)
where , and
, and  is the first-order Hankel function of the second type with argument
 ,
,  , and
, and .
.
The total field can be found by matrix inversion of Eq.8:
 (10)
(10)
The backscattered electric field  from the head at any receiver can be found using the MoM approach:
 (11)
(11)
where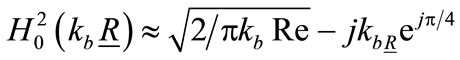 ,
,  is the position vector from a point in the head to the receiving antenna, A is head area and dA is differential area element.
An array of 16 wire antennas including one transmitter and 15 receivers (Figure 6) was placed around the head model in far-field (400 mm) distance.
A computer model was developed using MATLAB by combining Eq.11 and Eq.1 to simulate the complex visi-

Figure 5. Simulated 2D head model inside of the HMIA (1: Air, 2: Skin, 3: Fat, 4: Skull, 5: CSF, 6: Grey matter, 7: White matter, 8: Ischemic stroke).

Table 1. Dielectric properties of head at 2.5 GHz [29,30].
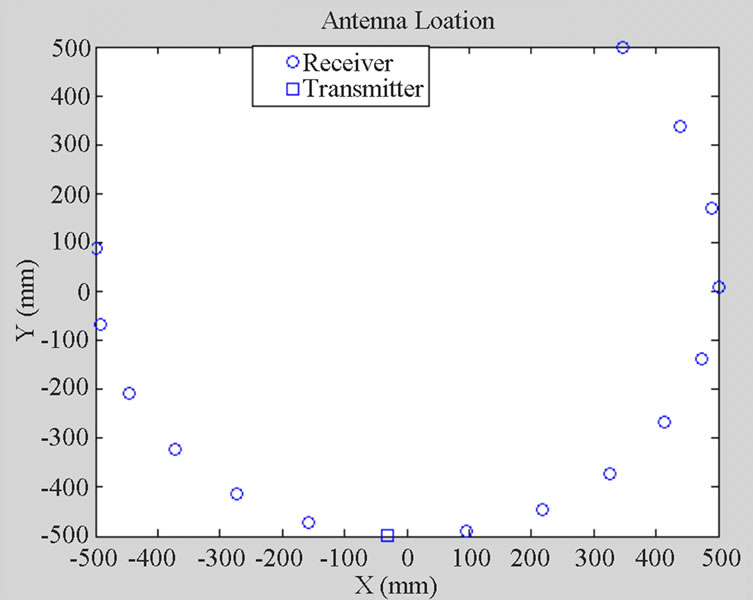
Figure 6. Schematic of antenna array configuration.
bility function that is described in Section 2. The head intensity distribution can be obtained by Eq.2 and then a 2D head image can be formed using Eq.5.
3.2. Simulation Results
Figure 7 clearly shows the simulated ischemic stroke within the reconstructed 2D head image. The stroke is located at (X = −40 mm, Y = 0 mm). Colour bar plots signal energy on a linear scale, normalised to the maximum in the 2D head area.
4. HMIAFOR BREAST CANCER DETECTION
The 3D HMIA technique for the breast cancer detection is designed for operating at a single frequency of 12.6 GHz. The system contains a 3D breast model and an array of 16 antennas with one being the transmitter and others receivers. The space between the breast and the antenna array was assumed to be filled with air ( ,
, S/m).
S/m).
4.1. Simulation Forward Models
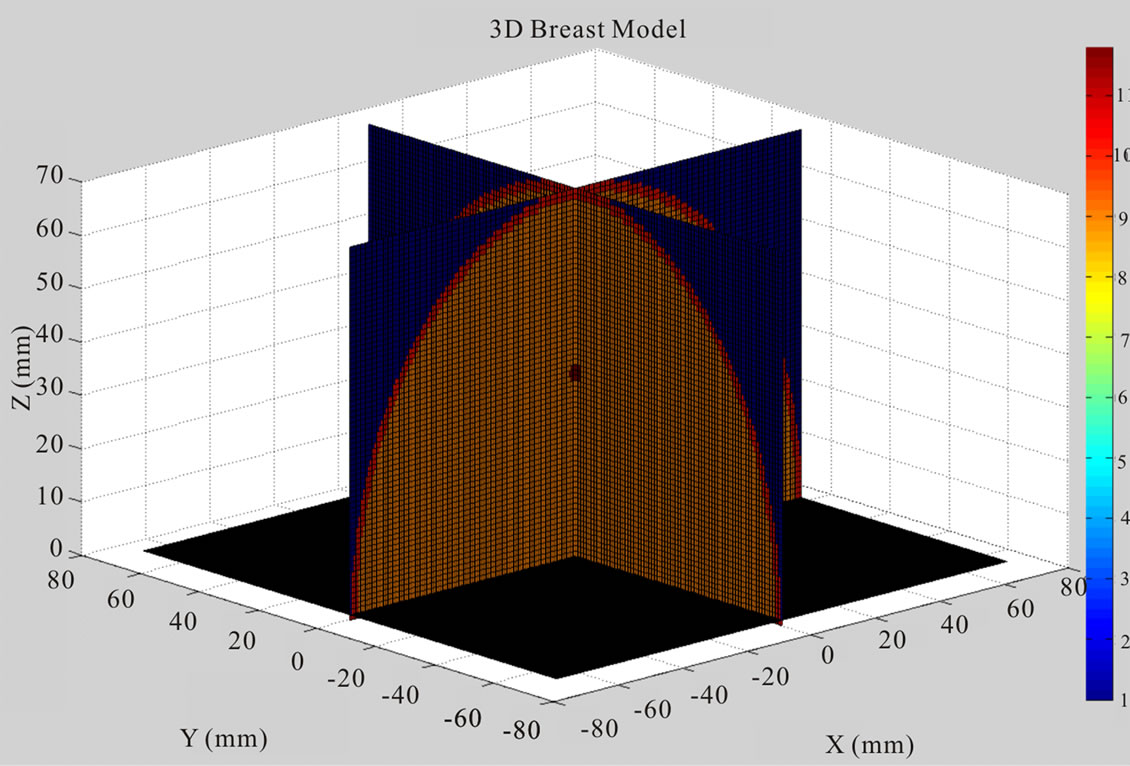
Figure 8 displays the 2D and 3D views of a simplified breast model that contains skin, fat tissue and malignant tissue. The hemispherical shaped breast model has a radius of 70 mm. A 2 mm thick skin layer surrounded the breast fat tissue. Tumours were modelled as spheres and ellipses of diameters ranging from 2 mm to 6 mm. Colour bar plots the dielectric properties of breast model. The dielectric properties of breast used in simulation model are summarized in Table 2.
A known incident field is transmitted by the transmitter and the response is measured on the 15 receivers. HMIA measures the scattered radiation of the breast, which is composed of a set of correlation interferometer pairs. The electromagnetic signals received by each pair
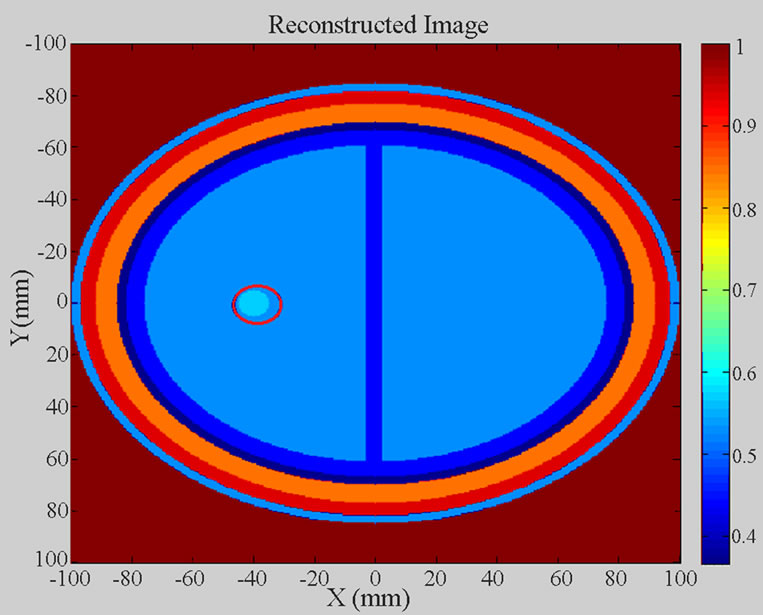
Figure 7. Reconstructed 2D head image of the simulated 2D head model.
are cross correlated to get the visibility function.
A small open-ended rectangular wave-guide was assumed to be a transmitting antenna. The broad and narrow wall dimensions of the antenna are 15.788 mm and 7.5 mm. The radiated far-field from such antenna is well represented by the following expression:
 (12)
(12)
where  = Wave amplitude of
  mode within wave-guide aperture;
 = Position vector from a point in the breast to the transmitting antenna;
A = Broad aperture dimension of antenna aperture;
B = Narrow aperture dimension of antenna aperture;
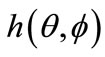 = Antenna far-field radiation pattern;
 = Polarisation vector.
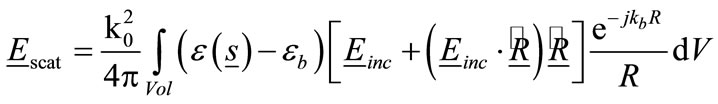
The back-scattered electric field from breast can be found by applying the Stratton & Chu formulation [41] which gives the following integral over the volume of the breast:
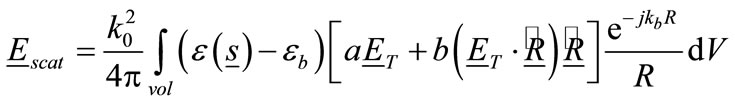 (13)
(13)
where  is the wave number in free space,
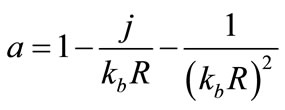 ,
,
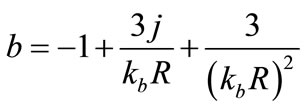 .
.
 = Unit vector parallel to the vector
 ,
,
 = Position vector from a point in the breast to the receiving antenna.
When , the above factors can be approximated by
 . Therefore, under these far-field conditions Eq.13 becomes:
 (14)
(14)
For the purposes of demonstrating the HMIA technique, it is computationally advantageous to consider a small permittivity contrast between the breast and host medium (air), that is  is assumed to be small. Thus, the backscattered far-field can be readily determined using the Born Approximation [42], which allows the total electric field,
  , to be approximated by the incident field,
  , so that we obtain:
 (15)
(15)
A computer model was developed using MATLAB by combining Eq.15 and Eq.1 to simulate the complex visibility function that is detailed in Section 2. The Fourier relationship Eq.5 was then used to generate a 2D image of a 3D breast model.
4.2. Simulation Results
In each of the simulations, the breast model was placed at z = 0 mm and the antenna array plane was placed at z = −450 mm. The 140 mm × 140 mm square image region containing the object (breast) and the background medium (air) is uniformly subdivided into 281 × 281 elementary square cells.
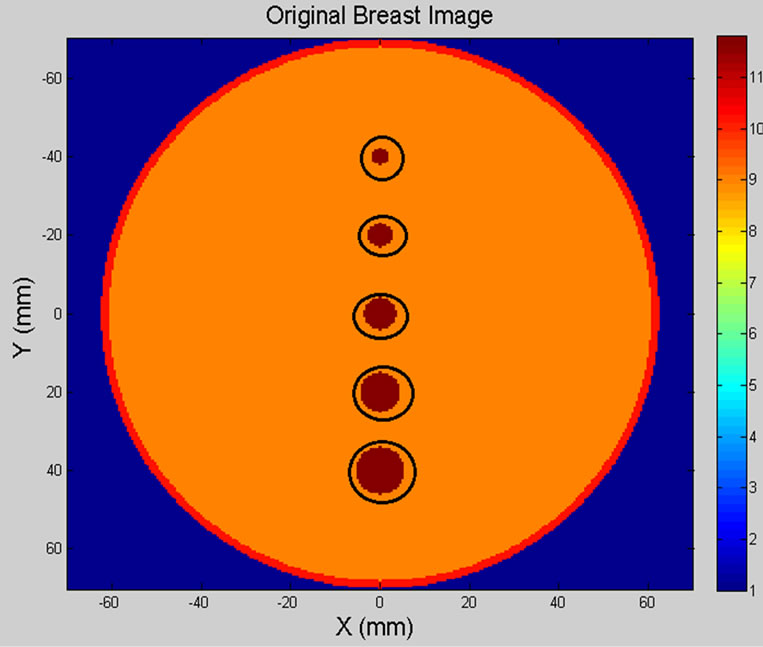
Figure 9 illustrates the original breast model and reconstructed breast image of five spherical tumours (circled in black). The location and size of spherical shaped tumours within the breast model are listed in Table 3.
Figure 10 shows the 2D view of the original 3D breast model and the reconstructed breast image off our spherical tumours (2 mm in diameter, circled in black). Table 4 shows the location and size of spherical shaped tumours within the breast model.
4.3. Experiment Setup
A simplified system to validate the implementation of the 2D HMIA technique for breast cancer detection was designed to conduct the experiments. The HMIA experimental setup is shown in Figure 11.
Sixteen open-end waveguide antennas (with 120 mm in length, 15. 8 mm and 7.5 mm in the broad and narrow wall dimensions) were embedded in a sheet of microwave absorbing material (600 mm × 600 mm) to reduce ambient reflections as shown in Figure 12. The 16-element antenna array was connected to an Agilent N 5230 A (10 MHz - 20 GHz) PNA.
 (a)
(a) (b)
(b)
Figure 8. Orignial 3D breast model with one tumour, (a) 3D view; (b) 2D view.

Table 2. Dielectric properties of breast model at 12.6 GHz.
A breast phantom (100 mm × 100 mm × 30 mm) containing skin, fat tissue and malignant tumours was used in the experiments. Breast fat tissue was made of 90% emulsifying ointment and 10% water. Small grapes and cucumbers were inserted into the breast phantoms to represent malignant tissues.
The skin layer in the phantom was modelled using a 3-mm-thick MACOR machinable glass ceramic (MGC) plate (100 mm × 100 mm).
All breast phantoms ware shaped in a rectangular plastic box and was covered by a thin plastic film. The latter has a negligible effect on the scattered electric field in
 (a)
(a)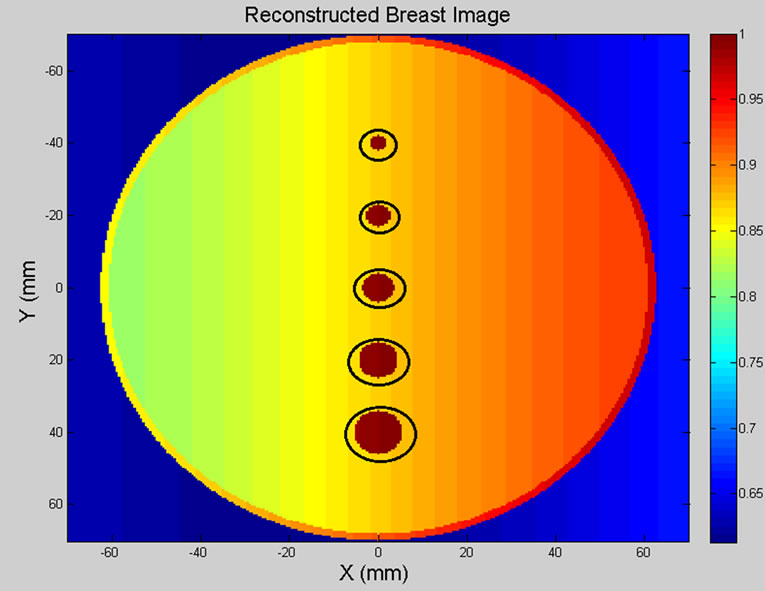 (b)
(b)
Figure 9. (a) Breast model; (b) 2D reconstructed breast image of five tumours.
 (a)
(a)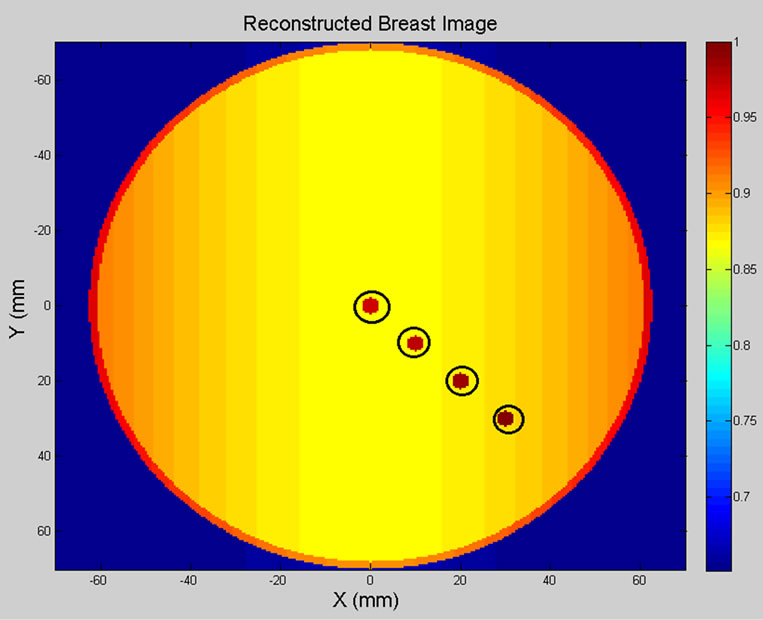 (b)
(b)
Figure 10. (a) Breast model; (b) 2D reconstructed breast image of four tumours.

Table 3. Location and size of five spherical shaped tumours.
the desired frequency range. The electric properties of the breast phantom are summarized in Table 5.
During data collection, the breast phantom was placed on the top of a polystyrene box at z = 0 mm and the antenna array was placed under breast phantom in far-field.
Air was used as the host medium between the breast phantom and antenna array plane. The breast phantom was illuminated by the transmitter and the backscattered field was measured by each receiver. To analyse the measured data, Eq.1 was applied to compute the complex visibility data of all possible pairs of antennas and then Eq.6 was used to generate a 2D breast phantom image.
4.4. Experimental Results
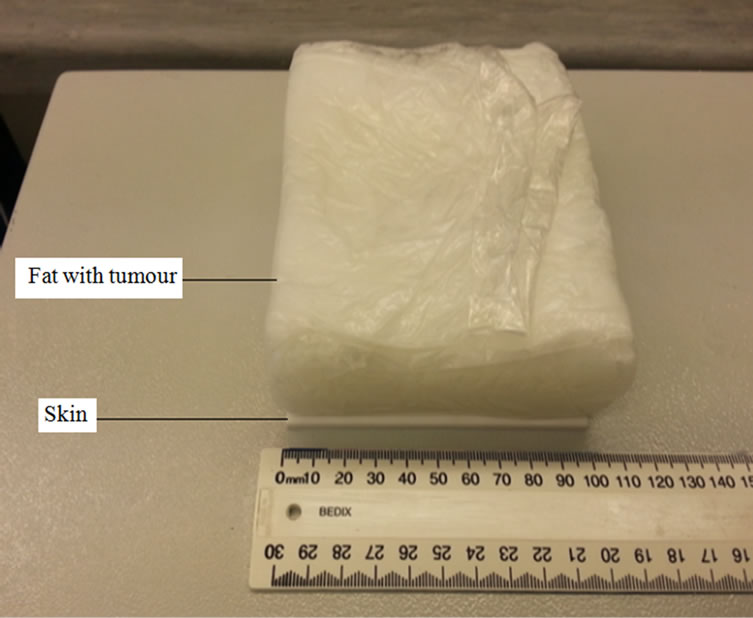
Figure 13 shows the breast phantom (100 mm × 100 mm × 30 mm) containing skin, fat and one tumour (10 mm in diameter grape), where the antenna array was placed at z = 0 mm and the breast phantom was located on the top of array plane at z = 540 mm
Figure 14 clearly displays the simulated tumour in the reconstructed 2D phantom image. The colour bar plots signal energy on a linear scale, normalised to the maximum in the 2D image space and values below 0.1 are rendered as blue. Data used to produce the image utilise a “zooming function” of power two to enhance the contrast with the background.
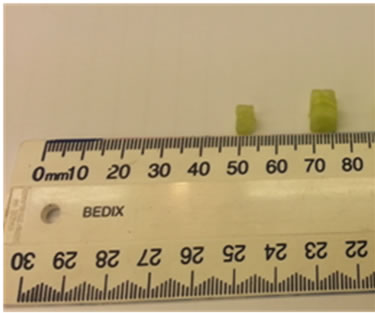
Figure 15 displays the phantom (100 mm × 100 mm × 30 mm) including skin, fat and two tumours (2.5 mm, 5 mm in diameters cucumber) located at (X = 35 mm, Y = 50 mm, Z = 25 mm) and (X = 55 mm, Y = 60 mm, Z = 25 mm). The breast phantom was placed on the top of
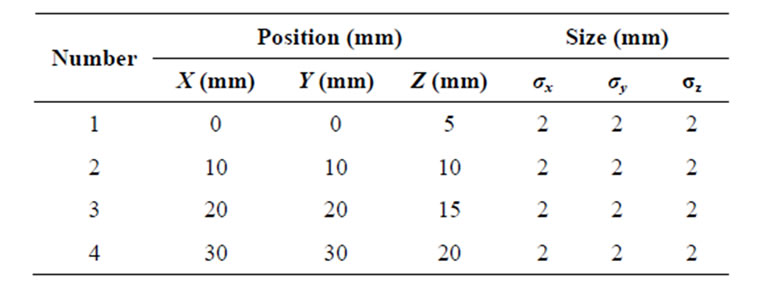
Table 4. Location and size of four spherical shaped tumours.
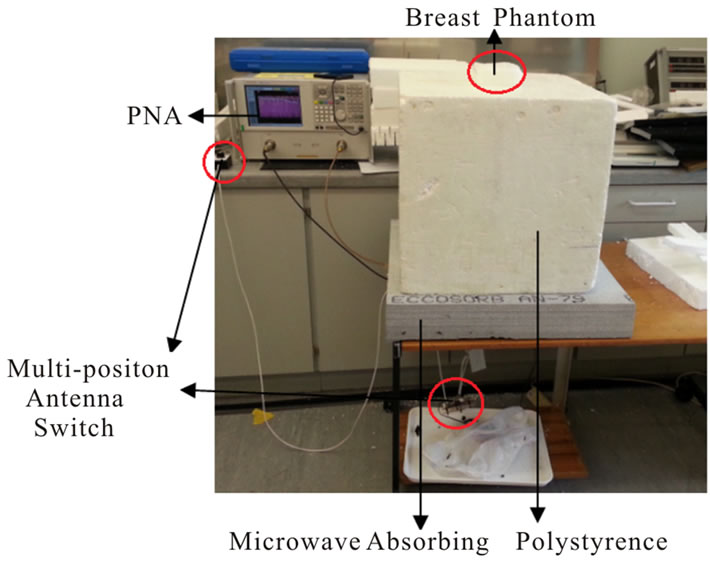
Figure 11. Experimental setup for breast cancer detection.
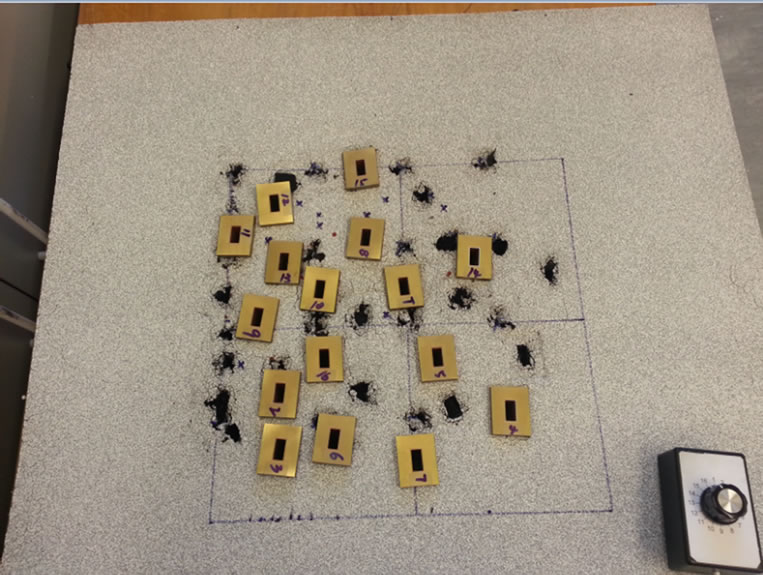
Figure 12. Photograph of antenna array configuration.
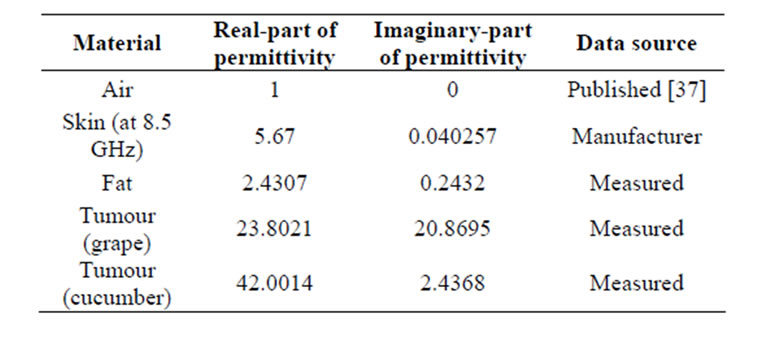
Table 5. Electric properties of object at 12.6 GHz.
 (a)
(a) (b)
(b)
Figure 13. (a) Top view and (b) inside view of the breast phantom containing skin, fat and one tumour (grape).
antenna array at Z = 490 mm.
Figure 16 demonstrates the 2D reconstructed image of the breast phantom containing two tumours. Data used to produce the reconstructed breast image utilise a “zooming function” of power three to enhance the contrast with the background.
5. CONCLUSIONS
This paper has demonstrated the HMIA technique for medical imaging applications with particular focus on breast cancer detection and brain stroke detection. Computer simulation models for a 2D numerical head model and a 3D numerical breast model were developed using MATLAB to demonstrate that the HMIA technique can produce good quality head and breast images.
The obtained simulation results of a 2D head model observed that small ischemic stroke (5 mm in diameter) inside of a high dielectric contrast shield could be successfully detected.
The achieved simulation results of a 3D breast model showed that tumours of various locations and sizes within the breast model could be successfully detected against the background.
The investigation of the HMIA technique for breast cancer detection has been performed by a simplified breast phantom. The experimental results showed that tumours of different size, shape and location could be detected against the background. An additional impedance
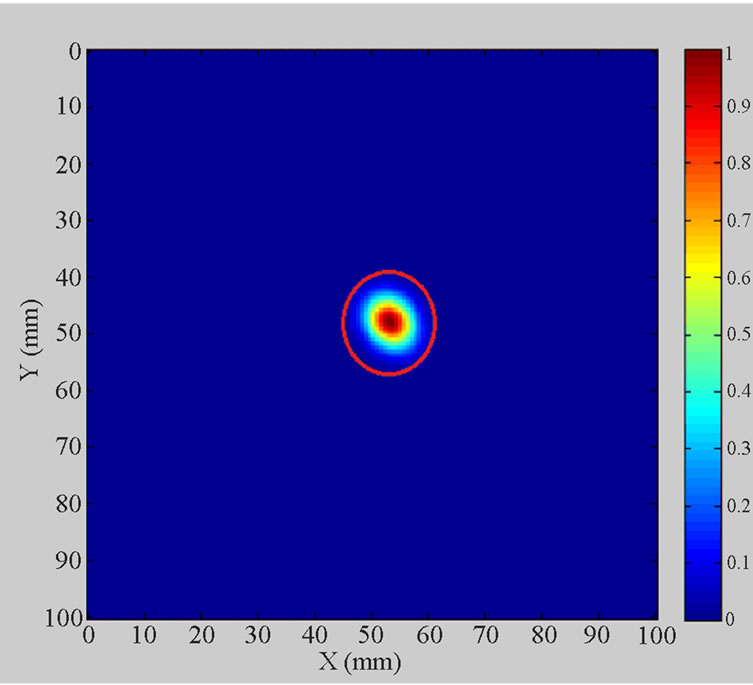
Figure 14. Simulated breast tumour within 2D breast phantom image.
 (a)
(a)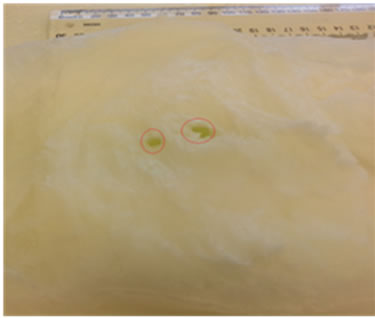 (b)
(b)
Figure 15. (a) Top view of the breast phantom containing skin, fat and two tumours (cucumbers); (b) Size of tumours.
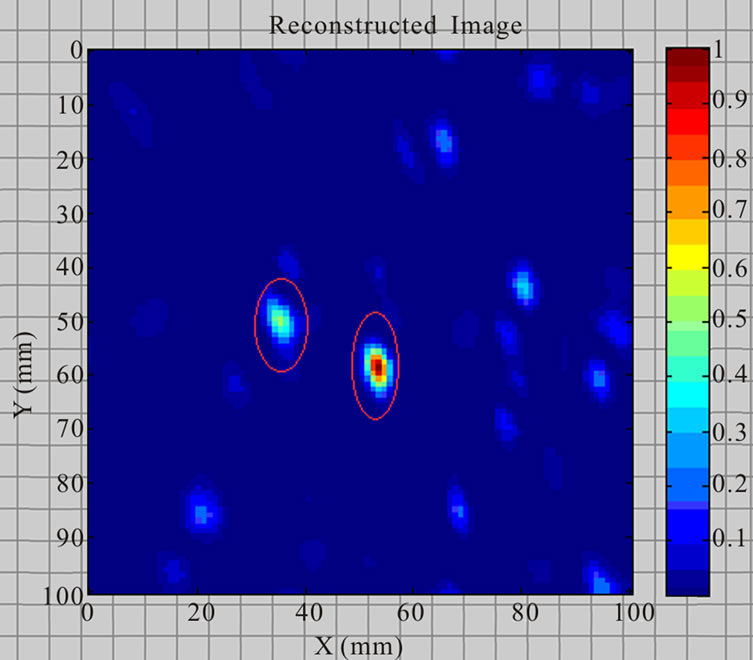
Figure 16. Reconstructed breast phantom image of two tumours.
matching medium was not necessary between the antenna array and the breast phantom, only air, which greatly simplified the practical implementation of the HMIA system.
The proposed HMIA technique has the potential to become a low-cost and easy-to-use screening and diagnostic tool for brain stroke detection and breast cancer detectionthat could supplement existing clinical methods.
6. ACKNOWLEDGEMENTS
The authors gratefully acknowledge the support of the Institute of Biomedical Technologies (IBTec) at the Auckland University of Technology (AUT), and the support of Callaghan Innovation, Auckland, New Zealand.
The authors also would like to acknowledge Mr Terry Palmer and Mr Tim Wyatt at Callaghan Innovation for manufacturing the cables, switch assembly and waveguides for the experimental setup.
REFERENCES
- American Cancer Society (2012) Cancer facts & figures 2012. American Cancer Society.
- Cheng, Z., Xiuzhen, D., Feng, F., Zhenyu, J. and Canhua, X. (2007) Breast cancer detection based on multi-frequency EIS measurement. 29th Annual International Conference of the IEEE Engineering in Medicine and Biology Society, Lyon, 23-26 August 2007, 4158-4160.
- Liu, G.D. and Zhang, Y.R. (2010) An overview of active microwave imaging for early breast cancer detection. Journal of Nanjing University of Posts and Telecommunications (Natural Science), 30.
- Brown, M.L., Houn, F., Sickles, E.A. and Kessler, L.G. (1995) Screening mammography in community practice: Positive predictive value of abnormal findings and yield of follow-up diagnostic procedures. American Journal of Roentgenology, 165, 1373-1377. doi:10.2214/ajr.165.6.7484568
- Guide, D. Breast cancer. http://www.cancer.org/Cancer/BreastCancer/DetailedGuide/breast-cancer-detection
- Jackson, V.P., Hendrick, R.E., Feig, S.A. and Kopans, D.B. (1993) Imaging of the radiographically dense breast. Radiology, 188, 297-301.
- Smith, R.A., Saslow, D., Sawyer, K.A., Burke, W., Costanza, M.E., Evans, W.P.I.I.I. and Sener, S. (2003) American Cancer Society guidelines for breast cancer screening: Update 2003. CA: A Cancer Journal for Clinicians, 53, 141-169. doi:10.3322/canjclin.53.3.141
- Go, A.S., Mozaffarian, D., Roger, V.L., Benjamin, E.J., Berry, J.D., Borden, W.B. and Turner, M.B. (2013) Heart disease and stroke statistics—2013 update a report from the American Heart Association. Circulation, 127, e6- e245. doi:10.1161/CIR.0b013e31828124ad
- Mohammed, B.A.J., Abbosh, A.M., Ireland, D. and Bialkowski, M.E. (2012) Compact wideband antenna for microwave imaging of brain. Progress in Electromagnetics Research C, 27, 27-39. doi:10.2528/PIERC11102708
- Muir, K.W., Buchan, A., von Kummer, R., Rother, J. and Baron, J.C. (2006) Imaging of acute stroke. The Lancet Neurology, 5, 755-768. doi:10.1016/S1474-4422(06)70545-2
- Scapaticci, R., Di Donato, L., Catapano, I. and Crocco, L. (2012) A feasibility study on microwave imaging for brain stroke monitoring. Progress in Electromagnetics Research B, 40, 305-324.
- Chaudhary, S.S., Mishra, R.K., Swarup, A. and Thomas, J.M. (1984) Dielectric properties of normal and malignant human breast tissues at radiowave and microwave frequencies. Indian Journal of Biochemistry & Biophysics, 21, 76-79.
- Joines, W.T., Zhang, Y., Li, C. and Jirtle, R.L. (1994) The measured electrical properties of normal and malignant human tissues from 50 to 900 MHz. Medical Physics, 21, 547. doi:10.1118/1.597312
- Surowiec, A.J., Stuchly, S.S., Barr, J.R. and Swarup, A. (1988) Dielectric properties of breast carcinoma and the surrounding tissues. IEEE Transactions on Biomedical Engineering, 35, 257-263. doi:10.1109/10.1374
- Gabriel, C. (1996) Compilation of the dielectric properties of body tissues at RF and microwave frequencies. Department of Physics, King’s College of London.
- Gabriel, C., Gabriel, S. and Corthout, E. (1999) The dielectric properties of biological tissues: I. literature survey. Physics in Medicine and Biology, 41, 2231. doi:10.1088/0031-9155/41/11/001
- Gabriel, S., Lau, R.W. and Gabriel, C. (1999) The dielectric properties of biological tissues: II. measurements in the frequency range 10 Hz to 20 GHz. Physics in Medicine and Biology, 41, 2251. doi:10.1088/0031-9155/41/11/002
- Hagness, S.C., Taflove, A. and Bridges, J.E. (1998) Twodimensional FDTD analysis of a pulsed microwave confocal system for breast cancer detection: Fixed-focus and antenna-array sensors. IEEE Transactions on Biomedical Engineering, 45, 1470-1479. doi:10.1109/10.730440
- Fear, E.C. and Stuchly, M.A. (2000) Microwave detection of breast cancer: A study of tumor response variations. Engineering in Medicine and Biology Society. Proceedings of the 22nd Annual International Conference, 1, 74-77.
- Li, X. and Hagness, S.C. (2001) A confocal microwave imaging algorithm for breast cancer detection. IEEE Transactions on Microwave and Wireless Components Letters, 11, 130-132. doi:10.1109/7260.915627
- Fear, E.C., Li, X., Hagness, S.C. and Stuchly, M.A. (2002) Confocal microwave imaging for breast cancer detection: Localization of tumors in three dimensions. IEEE Transactions on Biomedical Engineering, 49, 812-822. doi:10.1109/TBME.2002.800759
- Fear, E.C., Hagness, S.C., Meaney, P.M., Okoniewski, M. and Stuchly, M.A. (2002) Enhancing breast tumor detection with near-field imaging. IEEE Transactions on Microwave Magazine, 3, 48-56. doi:10.1109/6668.990683
- Fang, Q., Meaney, P.M., Geimer, S.D., Streltsov, A.V. and Paulsen, K.D. (2004) Microwave image reconstruction from 3-D fields coupled to 2-D parameter estimation. IEEE Transactions on Medical Imaging, 23, 475-484. doi:10.1109/TMI.2004.824152
- Kosmas, P. and Rappaport, C.M. (2005) Time reversal with the FDTD method for microwave breast cancer detection. IEEE Transactions on Microwave Theory and Techniques, 53, 2317-2323. doi:10.1109/TMTT.2005.850444
- Fear, E.C. (2005) Microwave imaging of the breast. Technology in Cancer Research & Treatment, 4, 69.
- Tipa, R. and Baltag, O. (2006) Microwave thermography for cancer detection. Romanian Journal of Physics, 51, 371.
- Rubæk, T., Kim, O.S. and Meincke, P. (2009) Computational validation of a 3-D microwave imaging system for breast-cancer screening. IEEE Transactions on Antennas and Propagation, 57, 2105-2115. doi:10.1109/TAP.2009.2021879
- Klemm, M., Leendertz, J., Gibbins, D., Craddock, I.J., Preece, A. and Benjamin, R. (2010) Microwave radarbased differential breast cancer imaging: Imaging in homogeneous breast phantoms and low contrast scenarios. IEEE Transactions on Antennas and Propagation, 58, 2337-2344. doi:10.1109/TAP.2010.2048860
- Semenov, S.Y. and Corfield, D.R. (2008) Microwave tomography for brain imaging: Feasibility assessment for stroke detection. International Journal of Antennas and Propagation. doi:10.1155/2008/254830
- Ireland, D. and Bialkowski, M. (2010) Feasibility study on microwave stroke detection using a realistic phantom and the FDTD method. Microwave Conference Proceedings (APMC) 2010 Asia-Pacific, Yokohama, 7-10 December 2010, 1360-1363.
- Trefna, H. and Persson, M. (2008) Antenna array design for brain monitoring. Antennas and Propagation Society International Symposium, 1-4.
- Smith, D., Leach, M., Elsdon, M. and Foti, S.J. (2007) Indirect holographic techniques for determining antenna radiation characteristics and imaging aperture fields. IEEE Antennas and Propagation Magazine, 49, 54-67. doi:10.1109/MAP.2007.370982
- Ravan, M., Amineh, R.K. and Nikolova, N.K. (2010) Two-dimensional near-field microwave holography. Inverse Problems, 26, 055-011.
- Amineh, R.K., Ravan, M., Khalatpour, A. and Nikolova, N.K. (2011) Three-dimensional near-field microwave holography using reflected and transmitted signals. IEEE Transactions on Antennas and Propagation, 59, 4777- 4789. doi:10.1109/TAP.2011.2165496
- Wang, L., Simpkin, R. and Al-Jumaily, A.M. (2012) Holography microwave imaging array for early breast cancer detection. Proceedings of 2012 ASME International Mechanical Engineering Congress & Exposition, Houston, IMECE2012-85910.
- Wang, L., Simpkin, R. and Al-Jumaily, A.M. (2012) 3D breast cancer imaging using holographic microwave interferometry. Proceedings of the 27th Conference on Image and Vision Computing New Zealand, Dunedin, 26-28 November 2012, 180-185.
- Wang, L., Simpkin, R. and Al-Jumaily, A.M. (2013) Holographic microwave imaging for brain stroke detection. 2013 Shanghai International Conference on Applied Science and Engineering, Shanghai, 12-14 July 2013, SICASE044.
- Hector, L.G. and Schultz, H.L. (1936) The dielectric constant of air at radiofrequencies. Physics, 7, 133-136. doi:10.1063/1.1745374
- Harrington, R.F. (1993) Field computation by moment methods. Wiley-IEEE Press. doi:10.1109/9780470544631
- Richmond, J. (1965) Scattering by a dielectric cylinder of arbitrary cross section shape. IEEE Transactions on Antennas and Propagation, 13, 334-341. doi:10.1109/TAP.1965.1138427
- Silver, S. (1949) Microwave antenna theory and design. MIT Radiation Laboratory Series, McGraw-Hill, New York.
- Born & Wolf (1980) Principles of Optics. 6th Edition, Pergamon Press, Oxford, 510.