Journal of Biomedical Science and Engineering
Vol.6 No.6(2013), Article ID:33686,8 pages DOI:10.4236/jbise.2013.66081
The electrical parameters measurement system for electrotome output based on Labview
![]()
1University of Shanghai for Science and Technology, Shanghai, China
2Chongqing University, Chongqing, China
Email: *csong@usst.edu.cn
Copyright © 2013 Shengjie Yan et al. This is an open access article distributed under the Creative Commons Attribution License, which permits unrestricted use, distribution, and reproduction in any medium, provided the original work is properly cited.
Received 5 April 2013; revised 12 May 2013; accepted 27 May 2013
Keywords: Energy Generator; High-Frequency; Electrical Parameters Measurement; Constant Power
ABSTRACT
An accurate detection of the effective values of electric voltage and current from high frequency power generators is a precondition for the development of smart electrotomes. In this light, an energy detection system based on personal computer (PC) is developed hereby. It senses voltage and current in isolation from generators with transformers, and then the measured values are amplified, filtered, transformed into singleended signals and converted to RMS. The detected signals are transformed into digital signals through Data Acquisition Card (DAQ) and the data are processed with quadratic fit in Labview. Finally, the controller completes constant power output. The experiment results indicate that the energy detection system can measure the output parameters precisely and the controller can achieve constant power control.
1. INTRODUCTION
The electrosurgical instrument is a kind of high frequency power energy generator with an output energy frequency ranging from 200 kHz to 3.3 MHz and an power from dozens to hundreds of watts [1,2]. The mechanism it functions by is that the heat effect resulted from high frequency energy is used for the vaporization in biological tissues, ionization, and the breakage of hydrogen bond, coagulation and degeneration of proteins [3, 4]. Compared with traditional surgical appliance, electrosurgical instrument can perform cutting and coagulation simultaneously so as to reduce operation bleeding, make surgical vision clear and shorten the length of operation. Yet, since the value and duration of its output energy are generally subject to the subjective judgment of doctors according to their own experience, it also brings along some side effects, such as causing thermal damage for an over releasing of energy or the failure of sealing due to the inadequacy of energy. To reduce this kind of unwanted effects caused by human factors, the development of the instrument from a single combination of cutting and sealing to intellectualization is just in flight, promising a real-time monitoring of tissue status and therefore a self-regulated output of energy. The experiment results show a close connection between biological impedance and tissue status. So the voltage and current parameters working on biological tissues can be used as feedback quantity for monitoring the states of biological tissues and determining the amount of energy output. The detection of such feedback needs to be conducted under a high-frequency power environment. In this sense, it is a matter of priority to ensure protection of the detection circuit from the possible damage to be resulted from such power energy and a timely monitoring. In addition, as the voltage and current data measured by the electrical parameters measurement system have undergone something of reduction and processing, it is one of the keys to precisely transform them into the effective values of the real voltage and current.
Based on the thoughts stated above, an electrical parameters measurement system is designed on the basis of Labview. It detects voltage and current from an energy generator in an isolated way, regulates the signals, and adjusts the measured data in Labview. The detailed design and experiment are stated below.
2. THE SYSTEM PLATFORM
The whole system is depicted in Figure 1, incorporating a high-frequency energy generator and an electrical parameters measurement system. The former is to generate on biological tissues a high-frequency energy of 450 kHz with the biggest power as high as 150 w. And the system converts the high-frequency voltage and current into measured values within the range of 0 - 2 V respectively corresponding to the real voltage and current effective values. Also it provides the controller with feedback, and the controller does a fitting and adjusting of the feedback information for the real values and on this basis realizes the control of constant power and real-time judgment of biological impedance. To determine a super fitting strategy for the controller, the detected values are acquired by DAQ data cards and delivered to Labview program for processing and display. A series of detected values are acquired in the cases of varying load and recorded as  and
and . Meanwhile, oscilloscope is applied for the measurement of the effective values of the output voltage and current from the energy generator, recorded as
  and
and . Between the detected values and real values, there exists a correspondence. Fitting these detected values by different methods can help decide an optimized scheme that can well adjust the measured values into real effective values. Finally, the controller assisted by such an optimized scheme can obtain a set of feedback data reflecting the effective values of the real-time voltage and current and then complete the controlling of constant power and an in-time judgment of impedance.
3. THE HARDWARE DESIGN
The hardware design for the electrical parameters measurement system includes isolated inductive circuits and the conditioning circuit. Below is a detailed introduction of it and its operating principle.
3.1. Isolated Inductive Circuits and the Conditioning Circuit
A transformer must be applied for isolated induction of the voltage and current from the high frequency energy generator, as displayed in Figure 2. Given that the energy to be measured is a high frequency signal of 450 kHz, ferrite functioning in high frequency environment can be chosen as the magnetic material for the transformer. To prevent it from saturation, for the voltage isolation circuit, resistors must be connected in series to divide the voltage. Then, the reduced voltage is delivered to the primary side of the voltage transformer, which is made of winding ferrite and holds a transformation ratio of 60:10. As for the current inductive transformer, there are two schemes. The first is to use self-made ferrite annular core, with a transformation ratio of 1:100, while the second is to apply the PA1005.100NL current sensor designed by Pulse Company. A narration of the differences between the two is available in the part of Experiment Design and Results.
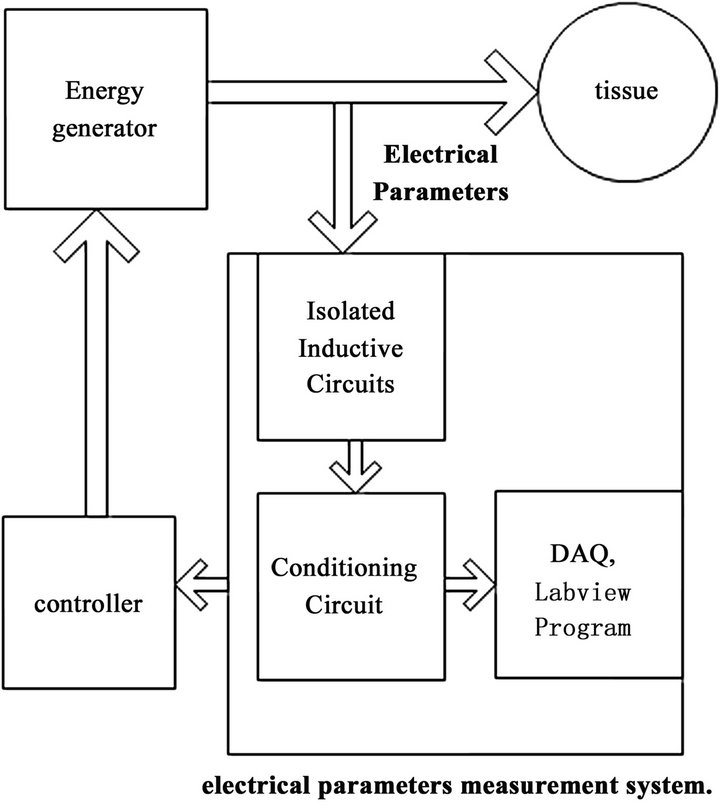
Figure 1. Structure of the electrical parameters measurement system.
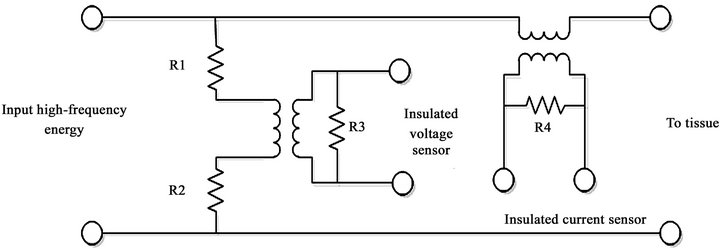
Figure 2. The schematic diagram of the isolated induction.
Here is the operating principle of the conditioning circuit: to lessen the load effect, signals detected from the voltage and current sensors first go through a voltage follower and then a low pass filter to filter out the higher harmonics. After that, the two different signals are converted into single-end signals by AD8251. Finally, the conversion chip AD637 is applied to transform them into effective values, which are 0 - 2 V direct current signals. For conditioning circuit, to get a precise effective value from the conversion, there are two key points [5]: one is to enhance the total gain of the isolated inductive and conditioning circuits so as to maintain the input signal of AD637 within the range of 1 - 2 V, because when the AD637 input signal is below 100 mV, its bandwidth will be less than 200 kHz, and in this case the high frequency output signals from the energy generator will be distorted. The second is the rational allocation of the AD637 peripheral circuit, particularly the peripheral average capacitance C. According to a lot of experimental verification, when C = 470 pF, a good result of precise effective value conversion can be achieved. Figure 3 is a display of the conversion circuit.
4. SYSTEM SOFTWARE DESIGN
The values of voltage and current measured by the electrical parameters measurement system are acquired and converted by DAQ and then transferred to PC. Then Labview program will perform oversampling, filtering, displaying and storing of them.
Oversampling technology is applied for the acquisition of the detected signals so as to improve the signal-noise ratio [6]. The data acquisition card DAQ6221 in use owns the highest sampling rate of 250kS/s and a resolution ratio of 16 bit [7]. The sampling ratio of DAQ 6221 is set to be 125kS/s, the oversampling coefficient to be 1024 times, and the equivalent sampling rate is 122 Hz [8]. The program design for Labview must include the filtering processing of the detected signals. Ideally, the detected values are only direct current voltage. Yet, since the whole system works in a high frequency and power environment, there inevitably exists some highfrequency interference. Therefore, Labview is added with the low pass filter with 100 Hz cut-off frequency.
To achieve precise controlling of constant power and real-time impedance monitoring, the detected values acquired must be adjusted to be real effective values. This study has applied three coefficient calibration methods for such adjustment, namely linear fit, quadratic fit, and cubic fit. The concrete procedures are to be stated in Experiment Design and Results. The overall flow chart of Labview is shown in Figure 4.
5. EXPERIMENT DESIGN AND RESULTS
A self-regulating power generator is used in the experiment and the output energy from it operated on the load targets after transiting through the electrical parametersmeasurement system. After converted by Data Acquisition (DAQ) Cards, detection values were transmitted to
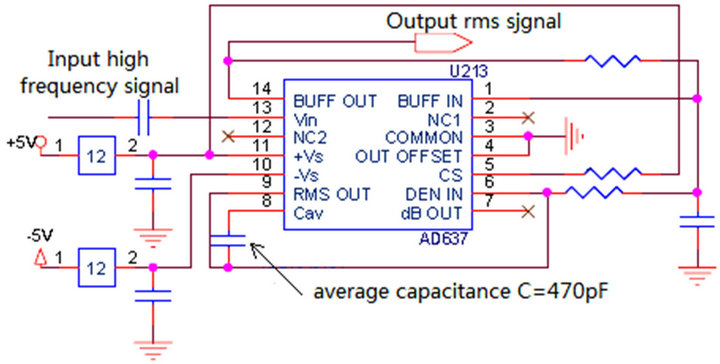
Figure 3. Effective values conversion circuit.
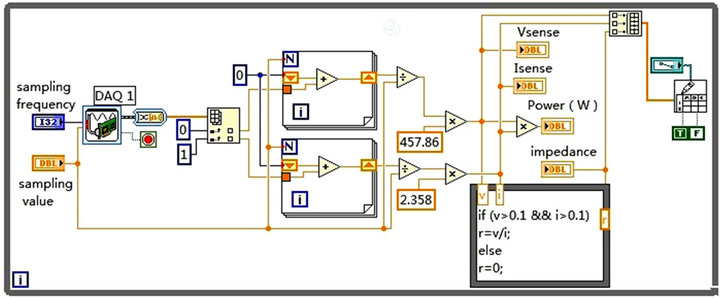
Figure 4. Labview graphical programming software.
the PC and processed in Labview. The detailed hardware structure is shown in Figure 5.
5.1. Comparison between the Coefficient Calibration Methods
The system’s performance of realizing a constant power is directly influenced by the result of coefficient calibration. Three coefficient calibration methods are used in the experiment, which is performed like this: using the power slide rheostat as the load of the energy generator and gradually increasing the resistance value from 30 Ω to 300 Ω, 10 Ω at a time. Detection values of the electrical parameters system under the varying loads are recorded and high voltage differential probe and large current detection probe are used to measure the voltage and current effective values outputted by the energy generator. And the Matlab software carries out linear, quadratic and cubic fits for the two sets of data gained. The ultimately determined voltage fitting equations are as follows:
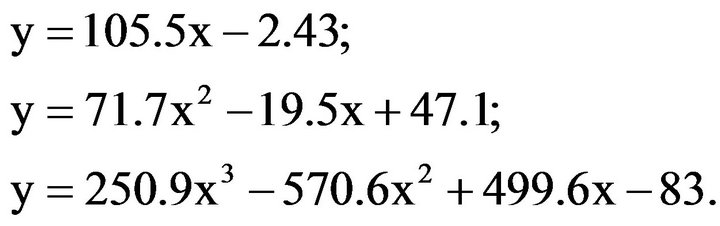
respectively for linear fit, quadratic fit and cubic fit. Figure 6 shows the three fitting curves.
Residual of the three types of fitting methods can be obtained through data processing and the data got by calculating variances and maximums of the residuals are shown in Table 1, in which the voltage unit is V and the current unit is mA.
The experimental results show that the result of cubic fit is better than that of quadratic fit, and that of linear fit
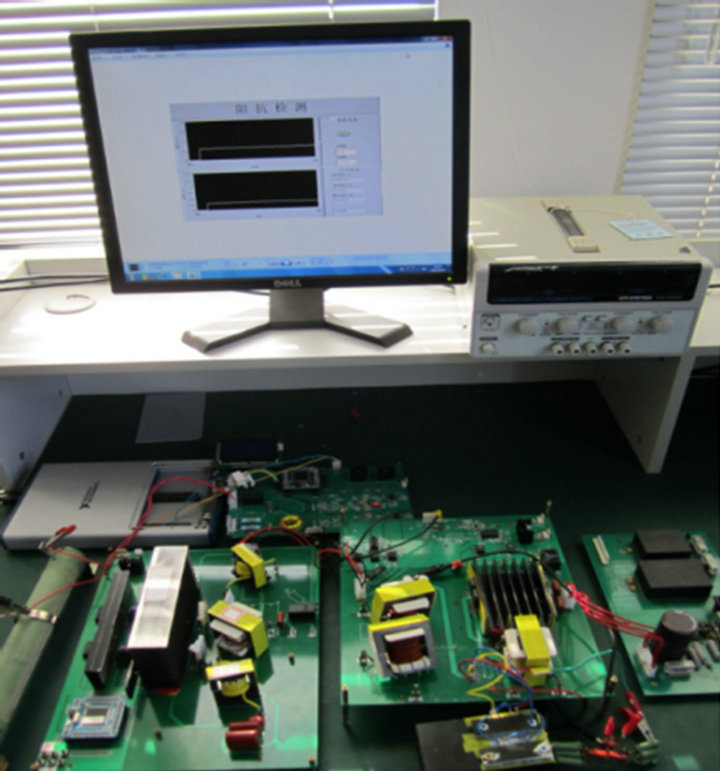
Figure 5. Experimental Installation Picture.
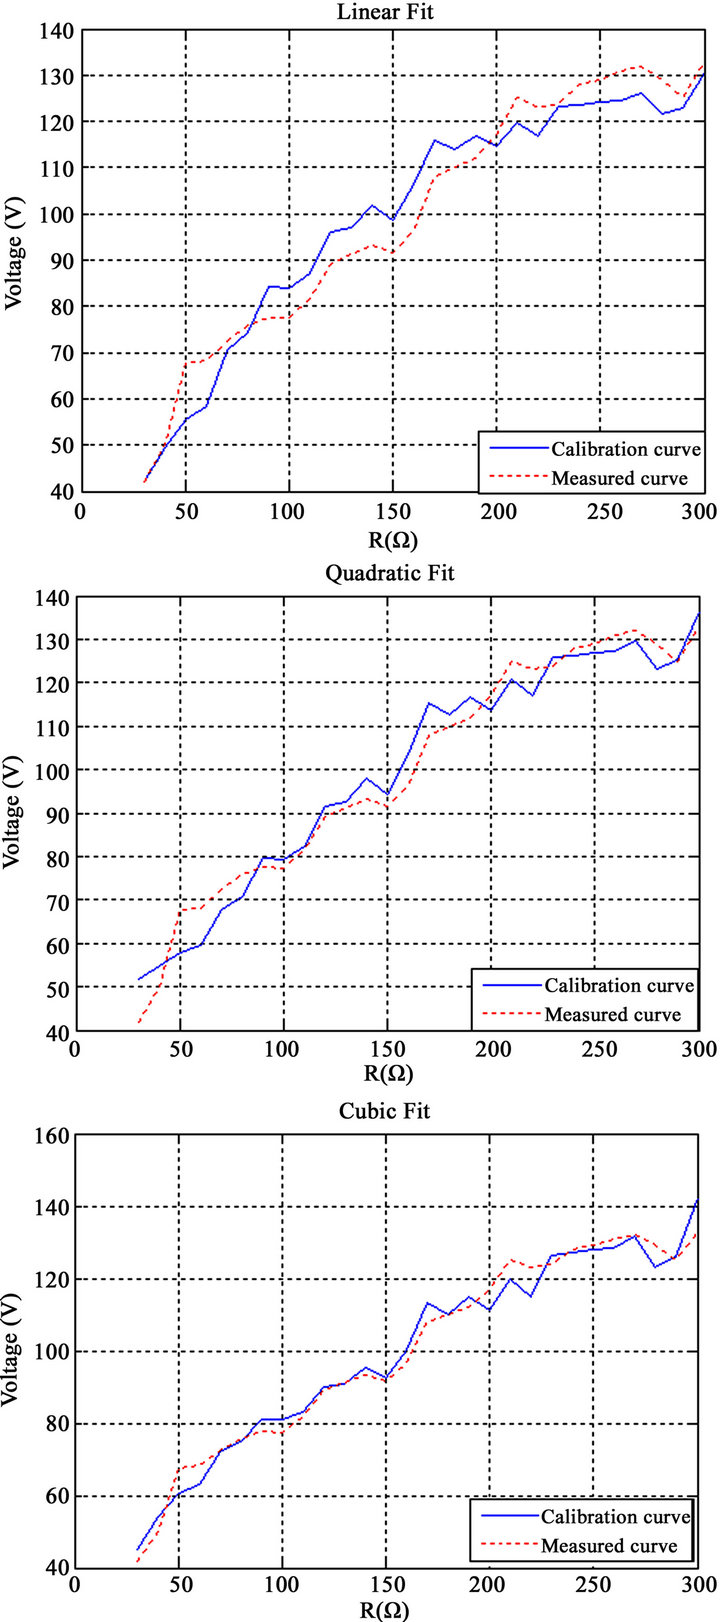
Figure 6. Voltage fitting curves.
is the worst. Although the result of cubic fit is the best, in a practical situation quadratic fit is carried out by the controller to complete coefficient calibration because that completing cubic fit will take up more space. Also, good results have been achieved.
5.2. Current Inductor Contrast Experiment
It is crucial to choose an appropriate current induction transformer for the system. Previous experiments have found that under heavy loads there are some deviations in the current detection of the electrical parameters measurement system [9,10]. Through trials, we find that the accuracy of current detection is determined primarily by the current inductor. To solve this problem, we select the high-frequency current inductor PA1005.100NL made by Pulse Company in the experiment. It is made of ferrite magnets and the maximum current it can tolerate is 20A, with an operating frequency ranging from 50 kHz to 1 MHz and a transformation ratio of 1:100. The experiment method is as follows: The load is increased from 30 Ω to 250 Ω, 20 Ω at a time. And the effective value of the output current from the power generator is detected by the oscilloscope. The Labview displays and records the current detection value measured by the system. The self-regulating current inductor and PA1005.100NL current inductor are respectively subjected to an experiment in accordance with the methods above and the data gained are used to carry out a quadratic fit. Figure 7 shows the results.
Results gained through data analysis are: the maximum residual and the residual variance of the PA1005.100NL current inductor are 20.8 and 114.2 respectively; the maximum residual and the residual variance of the selfregulating current inductor are 34.5 and 422.5. This indicates that PA1005.100NL current inductor can remarkably improve system’s accuracy for detecting highfrequency current.
5.3. Experiment of over Sampling and Low Pass Filtering
For this experiment, Labview program is applied for the oversampling and low pass filtering. The principle it works by is that output of the energy generator functions directly on power resistors, of which the voltage and current are under real-time monitoring by the electrical parameters measurement system. The output of the energy generator has a duty ratio of 50% and a period of 2 s. To filter out the superimposed upper harmonics on the detected signals and reduce the effects exerted by electromagnetic interference, the filter is designed as a threeorder Butterworth low pass one, with the cutoff frequency
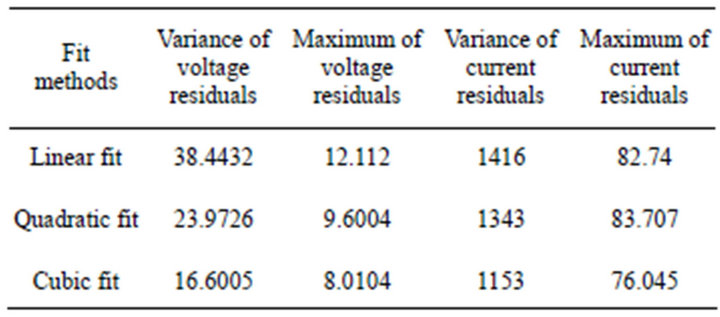
Table 1. Comparison of index between the fit methods.
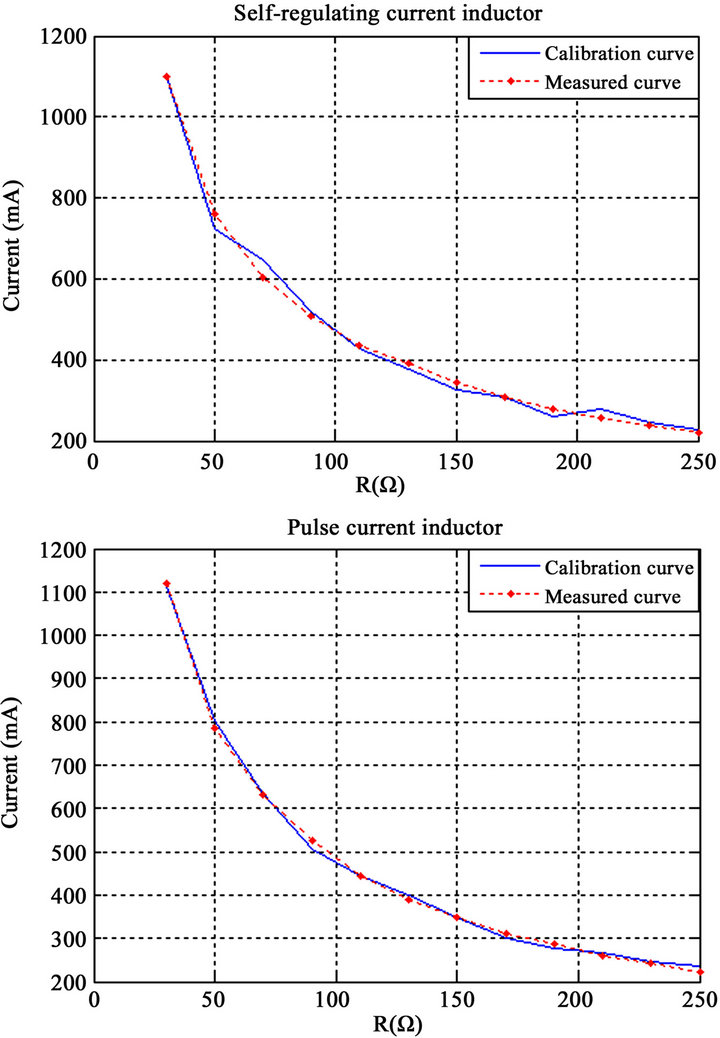
Figure 7. Quadratic fit effects of the current inductors.
being 100 Hz. The experiment shows that, after the low pass filtering and oversampling, the signal-to-noise ratio is greatly enhanced. The wave patterns are presented in Figure 8.
5.4. Application of Quadratic Fit in Labview Program
In experiment 5.1, quadratic fit is selected as the method for coefficient calibration. The voltage calibration equation is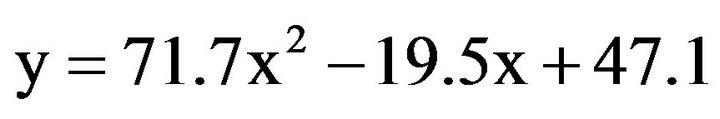 , among which x is the voltage detection value and y is the voltage regressed value. The current calibration equation is
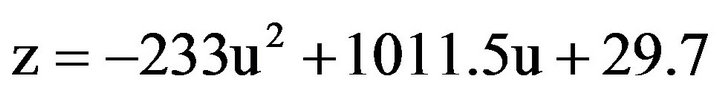 and u and z are respectively the current detection value and the current regressed value. With quadratic fit performed to the acquired effective values of the voltage and current, Labview then calculates the calibration values. The load of the energy generator starts from 30 Ω, and increases by 20 Ω each time till it goes up to 250 Ω finally. The oscilloscope is used to detect the effective values of voltage and current under the varying load. Meanwhile it displays the calibration values of the voltage and current. The comparison between them is shown in Table 2.
The experiment shows that, with the application of quadratic fit, the detected values of voltage and current can be well adjusted. The average residual error of voltage is 2.6 V and that of current is 35 mA.
5.5. Electrical Parameters Detection Experiment
The experiment material is the chicken intestinal. The high-frequency energy output is transmitted by Liga Sure Altasbiopolar closer. The system performs a realtime monitoring of the electrical parameters on the chicken intestinal and delivers the data to PC for them to be processed by Labview, which then displays on the PC screen the effective voltage value, current value and the biological impedance value. The experiment results are shown in Figure 9.
5.6. Experiment of the Control of Constant Power
According to the experiments above, this newly developed system can precisely measure the effective values of voltage and current from the energy generator. The controller receives the detected values acquired by the system as feedback quantity and, by aid of control algorithm, realizes the output of constant power from the energy generator. The constant power value is determined as 50 W, 80 W, 100 W, 120 W and 150 W with the load ranging from 30 Ω to 200 Ω. This experiment shows that the whole system can realize an output of constant power. And the power curve is depicted in Figure 10.
6. CONCLUSION
The experiment results show that in the electrical parameters measurement system, the detected values can be better adjusted to real effective voltage and current val-
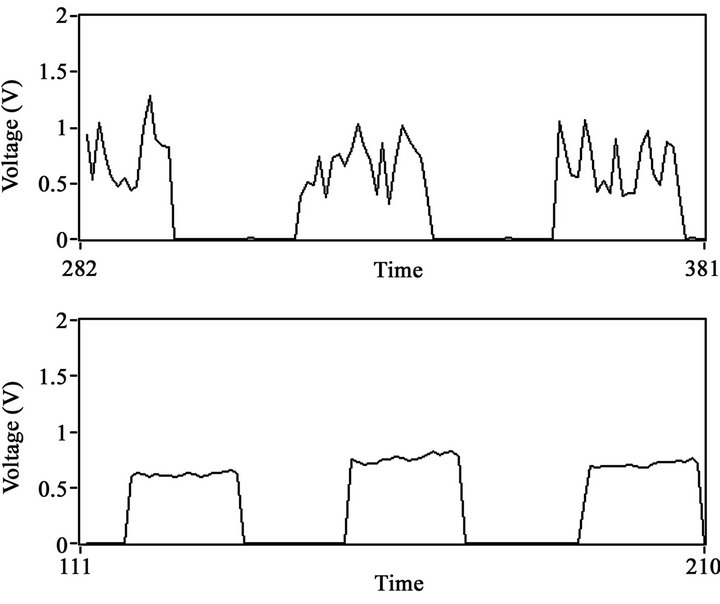
Figure 8. No-oversampling and filtering (upper); oversampling and filtering (lower).
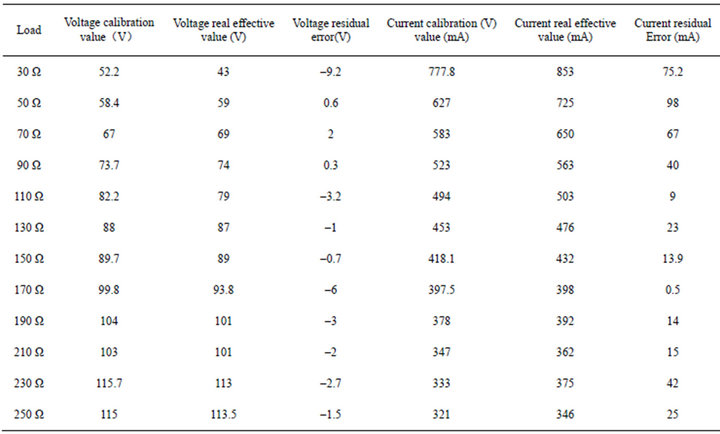
Table 2. Comparison between calibration values and real effective values.
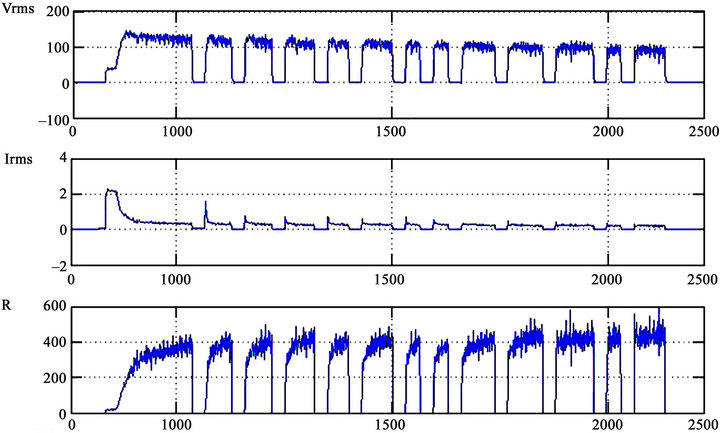
Figure 9. Wave patterns of the parameters detection experiment.
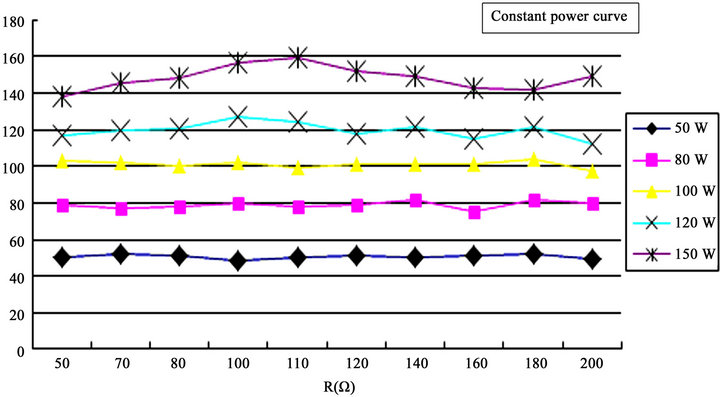
Figure 10. Constant power curve.
ues after a quadratic fit and that the application of PA 1005. 100 NL current sensor can help improve the measurement precision for the high-frequency current. In Labview, the application of oversampling and three-order Butterworth low pass filter can help increase the signal-to-noise ratio of the detected signals. The electrical parameters measurement system can precisely measure the high-frequency voltage, current and biological impedance information. The energy generator can realize feedback control and the output of constant power. Therefore, it is safe to say that the research of the electrical parameters measurement system is successful. Moreover, it lays a foundation for the development of high-frequency intelligent electrotome.
7. ACKNOWLEDGEMENTS
Shanghai Municipal Science and Technology Commission—funded project (10441900900), Shanghai Municipal Science and Technology Innovation Project (12YZ102), Shanghai excellent young teachers special fund for scientific research (slgl0020).
REFERENCES
- Friedrichs, D.A., Erickson, W. and Gilbert, J. (2012) Anew dual current-mode controller improves power regulation in electrosurgical generators. IEEE Transactions on Biomedical Circuits and Systems, 6, 39-44. doi:10.1109/TBCAS.2011.2159859
- Goble C CO. (2001) Electrosurgery system and method. Patent No. 6228081.
- Roby, K., Varjan, S. and Stascavage, K. (2011) A novel electrocautery device to increase coagulation rate and reduce thermal damage. Bioengineering Conference (NEBEC), New York, 2011, 1-2.
- Dodde, R.E., Gee, J.S. and Geiger, J.D. (2012) Monopolar electrosurgical thermal management for minimizing tissue damage. IEEE Transactions on Biomedical Engineering, 59, 167-173. doi:10.1109/TBME.2011.2168956
- ANALOG. High Precision, Wideband RMS-to-DC Converter. http://www.analog.com/
- Zhou, Y. (2010) A simple oversampling system for ECG detection based on labview. Microcomputer Information, 26, 18-22.
- National Instruments. Low-Cost M Series Multifunction Data Acquisition. http://sine.ni.com
- Li, G., Zhang, L.J. and Li, L. (2008) Research of bioelectricity signal detection based on oversampling. Acta Electronica Sinica, 36, 1467
- Zhou, Y., Xu, W.D., Cui, X.X., Yan, S.J. and Song, C.L. (2011) A new high-frequency electrotome output detection system. IEEE Biomedical Engineering and Informatics, Shanghai, 2011, 1019-1022.
- Belik, D.V. (2001) Principal of design of an impedance electrosurgical apparatus for reliable ablation of malignnant tumors and pathological biological tissue. Biomedical Engineering, 35, 23-25.
NOTES
*Corresponding author.