Intelligent Information Management
Vol.6 No.3(2014), Article ID:46412,7 pages DOI:10.4236/iim.2014.63015
Forecasting Budget Estimated Using Time-Series
—Case Study on College of Computer Science and Informationwang#:br Technology
Foriaa Ahmed Elbasheer1, Samani A. Talab2
1Department of Information System, King Abdulaziz University, Khulais, Saudi Arabia
2Department of Computer Science, Neelain University, Khartoum, Sudan
Email: Foriaa1985@gmail.com
Copyright © 2014 by authors and Scientific Research Publishing Inc.
This work is licensed under the Creative Commons Attribution International License (CC BY).
http://creativecommons.org/licenses/by/4.0/


Received 12 February 2014; revised 15 March 2014; accepted 14 April 2014
ABSTRACT
The need for information systems in organizations and economic units increases as there is a great deal of data that arise from doing many of the processes in order to be addressed to provide information that can bring interest to multi-users, the new and distinctive management accounting systems which meet in a manner easily all the needs of institutions and individuals from financial business, accounting and management, which take into account the accuracy, speed and confidentiality of the information for which the system is designed. The paper aims to describe a computerized system that is able to predict the budget for the new year based on past budgets by using time series analysis, which gives results with errors to a minimum and controls the budget during the year, through the ability to control exchange, compared to the scheme with the investigator and calculating the deviation, measurement of performance ratio and the expense of a number of indicators relating to budgets, such as the rate of condensation of capital, the growth rate and profitability ratio and gives a clear indication whether these ratios are good or not. There is a positive impact on information systems through this system for its ability to accomplish complex calculations and process paperwork, which is faster than it was previously and there is also a high flexibility, where the system can do any adjustments required in helping relevant parties to control the financial matters of the decision-making appropriate action thereon.
Keywords:Budgets, Information, Accounting, Predict, Time Series Analysis

1. Introduction
Are the accounting information systems and relatively modern administrative concepts in the world of information technology? This paper is to develop a database to predict the budget for the new year based on the budgets of previous years, and follow this new budget to draw the plans and preparation of budgets, using a personal appreciation of the implementers, and the lack of specialized administrative judge ruled on the facts properly displays the budget for failure. We find that the Sudanese universities have more lack and more considerable need for information, as it is so far keeping more accurate, orderly and documented information budgets than universities. So you have this study that dealt with one of the colleges, the most importantly, as it has proposed methodology for processing based on the principle of data processing budgets of previous years using time series analysis to predict the new year with a budget and following this new budget year to get good control on the budget.
2. The Data Source
Data of this paper is based mainly on fieldwork sessions hold by the author in Faculty of Computer Science and Information Technology. The data is provided by department of General Budget. The collection of this data comes as a result of an ongoing research on the use of time-series in the budget preparation and control to minimize distractions and reduce errors in Neelain University, Department of Information System.
3. Mathematical and statistical methods to predict
There are many mathematical and statistical methods in which they can demand forecasting is the most important of these methods.
3.1. The Method of Time Series Analysis
Time series is a collection of observations ranked according to their occurrence in time such as the years or seasons or months or days or any unit of time. It is thus a historical record to be adopted for the construction of future expectations [1] .
The time series analysis of the methods commonly used to predict the values of future variable specific [2] , where they are studying and analyzing the behavior of the phenomenon that is here the budget during the previous time, and rely on this analysis to predict the budget in the future, in the sense that the time series analysis is based on the analysis of the relationship between the budget and the time during a given time series to reflect the relationship of the extent of change that has occurred in the budget for a time.
There are several types of changes associated with a time series [3] :
a) Changes in the general direction: They reflect changes in the behavior of the phenomenon in a relatively long-term and take either downward or upward trend.
b) Seasonal variations: The changes that are repeated throughout the year, such as changes in the amount of demand for a commodity during festive seasons and occasions, where increasing quantities required during those seasons and then cut in the rest of the year.
c) Cyclic changes: Changes which occur regularly in the phenomenon under study, but at intervals spaced relative to periods of seasonal changes.
d) Changes irregularly: It changes the occasional occur for emergency reasons are difficult to control, such changes are difficult to predict, such as: random changes or changes pure coincidence resulting from the natural conditions in general and climate in particular, and some are unpredictable , such as: changes offs resulting from wars and revolutions, etc.
The focus here will be on the measurement and analysis of changes in the general direction, where there are several ways to measure the general direction of any phenomenon, and most important of these roads method of least squares, which will be taken up and clarify how to use it through practical cases.
The Least Squares Method [3]
The idea of micro-squares method on the basis of reaching a straight line or curve passes between all the dots, which represent the actual views, so that when the square deviations of those points are as little as possible, in the sense that the difference between the estimated values, and actual values are as low as possible.
The method of least squares assumes that the best-fit curve of a given type is the curve that has the minimal sum of the deviation squared (least square error) from a given set of data [4] .
This method is the standard method to adjust the best straight line to sample views x, y where this technique include minimized sum of squares of deviations of actual points on the line reconciled to the lowest possible [5] .
Use this method because it gives the mistakes to a minimum and is the most important methods used in the analysis of the general trend, also because the budget is changing at a constant rate over the years, and is used the least squares method to predict the budget through the following steps:
a) Knowledge of the actual budgets is under study through a series of time-related (for several years in a row).
b) Is derived equation trend line which takes the straight-line equation (1) (see Example 1) [6] .
 (1)
(1)
where:
x: Time, which represents a year after forecasting for the base year.
y: Represents the expected budget in the coming year.
a: The amount of the budget is fixed and when x = zero.
b: Mel trend line represents the change in the budget as a result of the change in the value of x one unit.
n: The number of views.
And is calculated by the value of each of (a, b) n through the following relationships:
 (2)
(2)
 (3)
(3)
c) Compensation in the equation is the general trend for the value of x, which represents a year after forecasting for the base year and then infers the value of y, which represents the expected budget in the year to predict.
Example 1:
Table 1 is the data that could be collected from the budgets of an item for the period expenses of electricity in the period 2005-2011:
Required: Projected budget estimation for the year 2012 by using time series analysis.
Solution:
Select one year and consider the base year and then the value of x = zero, then the conclusion is the x values to the rest of the years (for years after the base year) and perform calculations as in the following table, see Table 2:
Find the value of b is through compensation in Equation (2) as follows:

Find the value of a is through compensation in equation (3) as follows

The equation for the overall direction of the budget as follows: ![]() (when the year 2005 is the base year).
(when the year 2005 is the base year).
The projected budget for 2012, where x = 7 (after the year 2012 for the year 2005)

4. Implementation of the System
The system processes the data in Table 1 in electronic and calculates all the equations mentioned above in electronic hidden from the end user.
First, it is the introduction of previous budgets: Select the year you want to put this budget (see Figure 1).
After selecting the year, show previous years automatically we enter previous budgets and system able through this data to predict the new budget year (are hidden from the user) using time series (least squares method) (see Figure 2).
After the introduction of previous budgets, the system processed equations needed to produce the new budget (see Figure 3).
After the prediction of the new budget that can be handled during the year and it keeps track of expenditure and control to minimize distractio (see Figure 4).

Table 1. Previous budgets for electricity expenses.

Table 2. Conclusion values of x, x2 and x * y.

Figure 1. Screen to choose the year you want to put its budget.
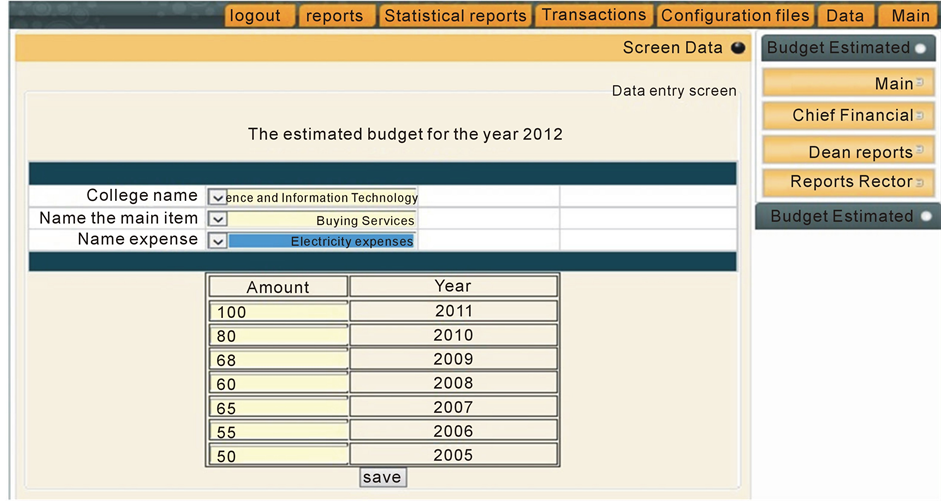
Figure 2. Screen insert expenses amounts of electricity for years.

Figure 3. Screen budget expected after treatment expenses for electricity (97.2857142857).
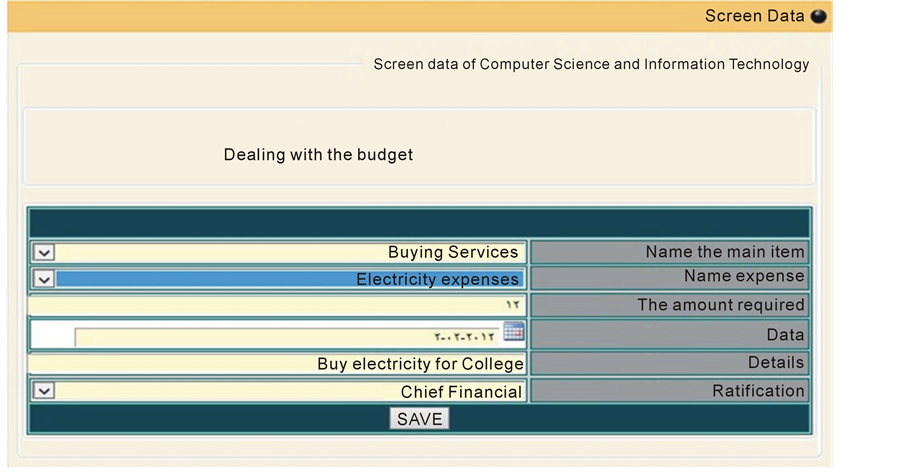
Figure 4. Screen dealing with(disbursement from) the budget predicted.
The system can be compared to the plan with actual results (expenditures made during the year, see Figure 4) and then calculates deviations and measure the rate of performance (see Figure 5).
The system is able to generate a number of reports in the form of graphs, such as statistical report expenses by class (see Figure 6) and total budget of the previous years(such as electricity expenses) (see Figure 7).
Figure 7 shows the budgets of previous years (electricity expenses) in the form of graphs.
Were generated using (Fusion Chart Evaluation—An InfoSoft Global Creation).
5. Results
1) Provide administrative time spent in the preparation of the budget and account deviations.
2) File Protection budget through stored in the database instead of using the traditional file system.
3) The system works on solving all the problems of the old system of manual such as slowness and lack of precision.
4) Budget forecasting and monitoring during year and extract reports relating thereto budget, based on previous budgets using scientific equations.
5) The system is designed so that it works to provide all the required reports and projected easily.
6) This system helps to support management decisions to speed the extraction reports of it in a timely manner.
7) Help the administration take the necessary precautions for possible conditions and adapt to them.
8) Helping to anticipate problems and obstacles before they occur and avoid them in the light of the realistic goals set.
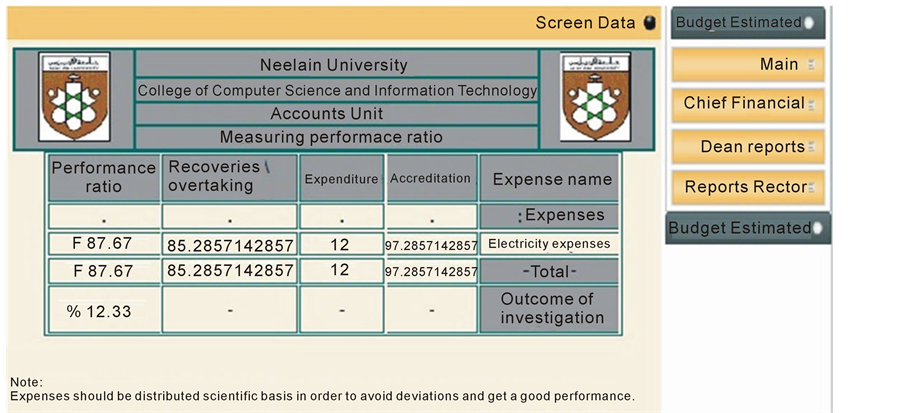
Figure 5. Compared with the projected budget, actual expenditures and identify deviations and measure performance ratio.
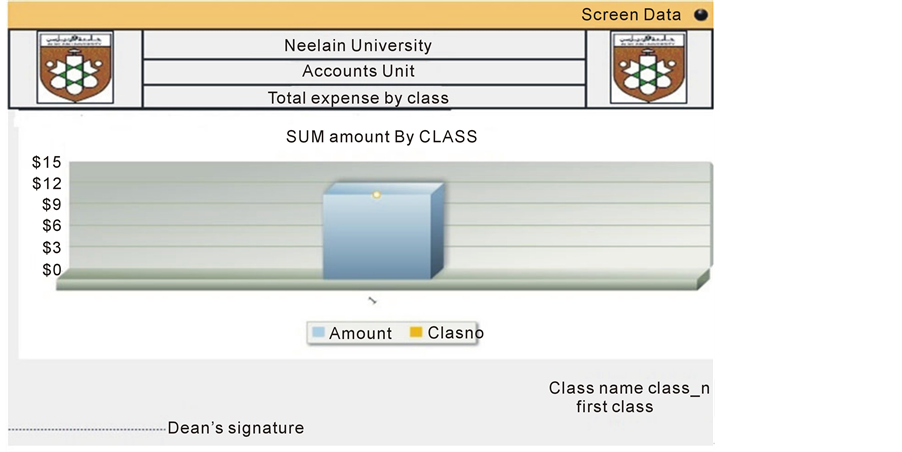
Figure 6. Report a multi-dimensional total expense account during a specified period.
9) To use the least squares method gives better results because the total square errors are less.
10) The system can extract statistical reports in the form of graphs (see Figure 6 and Figure 7).
11) The system can compare the plan with the results achieved (see Figure 5).
6. Conclusions
As a result of the spread of information technology, technology was necessary to keep up the interest-oriented frameworks, and human was capable of accommodating the largest amount of useful information across the extended efforts of scientific and educational specialist continuously and gave it a new dimension that was added to human civilization about technical dimension information, eating this research of information systems accounting management, which solved the problem of the budget in the form of traditional, through good analysis of taking all aspects covered by the budget process in its traditional form to ensure that the analysis of all inputs and giving outputs minute support decision-making process, using time series analysis—the least squares method because it
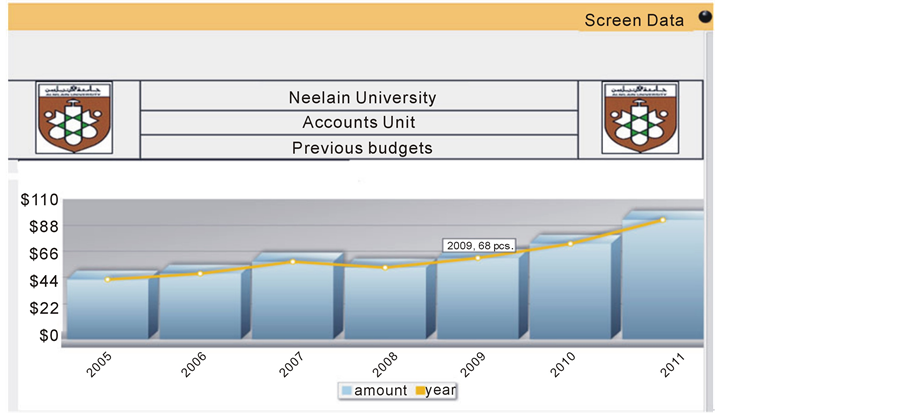
Figure 7. Report a multi-dimensional than the total budget of the previous years(such as electricity expenses).
reduces the total errors squared, as well as the broad search that budget preparation methods modern statistical gives the results of a logical and appropriate, did not match the results with the plans that give results with errors to a minimum, and the focus was on the stage of the programming on PHP, CSS, HTML, AJAX, JavaScript and Dreamweaver and databases MySQL due to its features.
Creator system uses the concept of time series and can be developed to a number of concepts using modern tools such as data mining and the concept of the Online Analytical Processing (OLAP).
References
- (2014) Time-Series-SPSS. http://faculty.ksu.edu.sa/72604/Publications/Forms/AllItems.aspx
- Samani, A. Talab, S. and Abdalla, M. (2012) Taqdiir Al-Muqbudaat wal Madfua’aat Biwasitat Al Salasil Al Zamaniya. Arab Informatics, 1, 15-22.
- (2011) Least Square Method. http://www.jmasi.com/ehsa/regression/regression1.html.
- (2014) Least Square. http://www.efunda.com/math/leastsquares/leastsquares.cfm.
- Yanis, I.B., Ameen, A. and Yonis, A. (2002) Econometric. Azza for Publication and Distribution, Khartoum.
- (2014) Marketing Feasibility Study. http://site.iugaza.edu.ps/bkofa/files/2011/02/333.ppt.