Journal of Geographic Information System
Vol.06 No.05(2014), Article ID:50474,33 pages
10.4236/jgis.2014.65042
Method of Searching for Earthquake Disaster Evacuation Routes Using Multi-Objective GA and GIS
Yuichiro Shimura, Kayoko Yamamoto*
Graduate School of Information Systems, University of Electro-Communications, Tokyo, Japan
Email: *k-yamamoto@is.uec.ac.jp
Copyright © 2014 by authors and Scientific Research Publishing Inc.
This work is licensed under the Creative Commons Attribution International License (CC BY).


Received 10 August 2014; revised 5 September 2014; accepted 1 October 2014

ABSTRACT
This study treats the determination of routes for evacuation on foot in earthquake disasters as a multi-objective optimization problem, and aims to propose a method for quantitatively searching for evacuation routes using a multi-objective genetic algorithm (multi-objective GA) and GIS. The conclusions can be summarized in the following three points. 1) A GA was used to design and create an evacuation route search algorithm which solves the problem of the optimization of earthquake disaster evacuation routes by treating it as an optimization problem with multiple objectives, such as evacuation distance and evacuation time. 2) In this method, goodness of fit is set by using a Pareto ranking method to determine the ranking of individuals based on their relative superiorities and inferiorities. 3) In this method, searching for evacuation routes based on the information on present conditions allows evacuation routes to be derived based on present building and road locations. Further, this method is based on publicly available information; therefore, obtaining geographic information similar to that of this study enables this method to be effective regardless of what region it is applied to, or whether the data regards the past or the future. Therefore, this method has high degree of spatial and temporal reproducibility.
Keywords:
Evacuation Route, Evacuation Site, Earthquake Disaster, Multi-Objective Optimization Problem, Multi-Objective GA (Multi-Objective Genetic Algorithm), Pareto Ranking Method, GIS

1. Introduction
Based on experiences in the Great Hanshin Earthquake (1995) and the Great East Japan Earthquake (2011), in recent years in Japan, reduction of the effects of natural disasters through self-help and mutual help is being emphasized, and effort is being put into the formulation of evacuation plans by independent disaster prevention organizations and the like. In 2011, in “Towards Reconstruction” [1] , the Reconstruction Design Council in Response to the Great East Japan Earthquake offered the opinion that self-help which takes the form of the idea of “escape” from disaster should be made the basis of the approach to reducing the effects of natural disasters, and in order to enable this, measures concerning more intangible aspects should be emphasized. These measures include thorough disaster prevention education conducted using mutual aid and the provision of hazard maps by public bodies. In order to “escape” quickly and safely from disaster, it is necessary to formulate a clear-cut evacuation plan-specifically, to create evacuation routes. Examples of existing efforts to formulate evacuation plans through self-help and mutual help are bousai machi-aruki activities (disaster prevention activities that involve walking around a neighborhood to check which places are safe to evacuate to in the event of a disaster, and which are dangerous), disaster simulation exercises and so on. A representative example of the latter is DIG (Disaster Imagination Game), developed by Komura et al. (1997) [2] . However, a common feature in the creation of evacuation routes through these efforts is that since the main objectives are inspiring disaster prevention awareness and educating people about disaster prevention, the routes are not evaluated quantitatively. Therefore, the evacuation plans formulated are influenced by the subjective points of view of the creators, and uncertainty remains as to whether they would be of practical use in a disaster.
Based on the above-mentioned background, this study treats the determination of routes for evacuation on foot in earthquake disasters as a multi-objective optimization problem, and aims to propose a method for quantitatively searching for evacuation routes using a multi-objective genetic algorithm (multi-objective GA). Further, the method of this study is applied to the region studied, and multiple evacuation route candidates that are derived are visualized on a digital map using GIS and evaluated. This study aims to use the method to derive routes in order to efficiently provide information for natural disaster reduction efforts carried out through self- help and mutual help—that is, to efficiently provide information for the formulation of evacuation plans by individuals and independent disaster prevention organizations.
2. Related Work
This study is related to 1) Evacuation routes; 2) Optimal solution searches using GA; 3) Spatial analysis using GIS; and 4) Multi-objective optimization problems. The study by Liu et al. (2006) [3] is an example of research related to (1). Liu et al. used flood damage simulation by a spatiotemporal geographic information system (DiMSIS) and the Dijkstra method, which is a method for finding the shortest route, and developed an algorithm for deriving evacuation routes that can respond to changes in the situation over time in a flood disaster. Further, Takeuchi et al. (2002) [4] imagined evacuation from a tsunami in an earthquake disaster and analyzed evacuation routes which took into account road blockage caused by the collapse of buildings and overall evacuation distance. Ichikawa et al. (2001) [5] took into account the fact that blockage of roads by collapsed buildings makes evacuation difficult, and estimated the danger on routes to evacuation areas for each road. They then used a Monte Carlo simulation to generate the road blockage situation, and considered the location of evacuation areas based on the road blockage situation on the shortest routes.
As examples of research related to (2), Inoue et al. (2013) [6] derived the optimal location of tourism-related facilities in urban tourist areas, and Asou et al. (2007) [7] derived the optimal location of evacuation sites in disasters. These studies demonstrated the superiority of the multipoint search feature of GA in the combinational optimization problem of facility location evaluation. As an example of research concerning (3), Koarai et al. (2007) [8] superposed a map showing the physical characteristics of an area of land with information about building damage caused by past earthquakes on a GIS, and analyzed the superposed map and information in order to examine the relationship between earthquake-induced ground disaster and the physical characteristics of land. They demonstrated the effectiveness of spatial analysis which employs GIS.
4) In the area of research regarding multi-objective optimization problems, there are many studies which have conducted optimal solution searches using a multi-objective GA. These searches apply the GA multipoint search feature. Hara et al. (2006) [9] viewed route searching by car navigation systems as a multi-objective optimization problem. They proposed a method in which a multi-objective GA was used to optimize independent objective functions for route length, estimated journey time, and degree of driving comfort. They demonstrated the effectiveness of the method by comparing it with existing methods. Kinoshita et al. (2008) [10] used a multi- objective GA to generate sightseeing routes which took into account the preferences of each member in a group, and demonstrated the superiority of searching by multi-objective GA in the case of optimizing multiple conflicting objective functions.
Based on the results of the above-mentioned related research, this study demonstrates uniqueness and value in the field of disaster research in that it aims to use a multi-objective GA to quantitatively search for evacuation routes, in order to provide effective information for evacuation plan formulation carried out using self-help and mutual help methods, which are more direct forms of natural disaster reduction help; that is, it aims to use a multi-objective GA to quantitatively search for evacuation routes in order to provide effective information for evacuation plan formulation by individual evacuees and regional disaster prevention organizations.
3. Framework and Method
In Section 4, the challenges of avoiding each of the various causes of obstruction of evacuation are set as the objectives in the evacuation route optimization, and in order to solve the multi-objective optimization problem of optimizing these objectives, an evacuation route search algorithm which employs a GA is designed and created. In Section 5, road network data for the district studied is created using GIS, and information about obstructions which occur during evacuation is added to this data for each road. In Section 6, an evacuation route search algorithm is applied to the road network that was created, evacuation starting points and destinations are set, and an evaluation experiment is performed. Further, the convergence of evaluation values for each objective is examined, and whether or not an effective search is being conducted or not is investigated. In Section 7, the parameters which resulted in the most effective search in Section 6 are applied to the GA, and an evacuation route search is conducted again. Further, the routes derived are visualized in GIS, and superposed with information for each road, such as information on blockage probability. This allows a visual evaluation to be performed, and superior routes are proposed. Additionally, Esri Inc.’s ArcGIS Ver. 10.1 is used as the GIS. The GIS is used to create road network data, perform spatial analysis, and visualize evacuation route search results.
The district chosen for study was the northern part of Sumida City (Figure 1), which is the Tokyo Metropolitan district that would be the most vulnerable in the event of a disaster, according to the “District-based assessment of vulnerability to earthquake disaster (No. 7)” [11] , published by the Tokyo Metropolitan Government. This district has a high concentration of wooden dwellings, and many roads with a narrow width; therefore, it is thought that there are many factors which would hinder evacuation in the event of a disaster. Thus, the effectiveness of the method of this study can be demonstrated well in this district.
4. Evacuation Route Search Method Employing Multi-Objective GA
4.1. Design of Evacuation Route Search Algorithm
Python 2.7 was used as the programming language for the design of the evacuation route search algorithm. Figure 2 shows the flow of the evacuation route search algorithm, and an outline of each operation is given below.
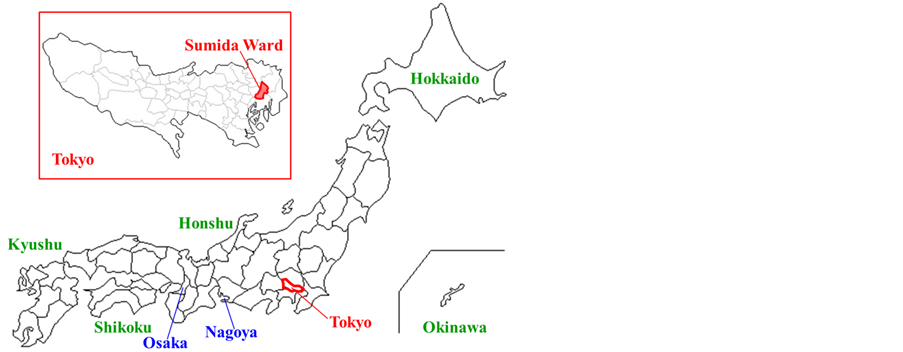
Figure 1. Location of district studied.

Figure 2. Flow of evacuation route search algorithm.
1) Acquisition of internodal adjacent information and road link information
Change the CSV data of the node-related adjacent information and the CSV data of the road link information into list form, and input the data into the GA.
2) Genetic coding
Determine how each of the routes, which are individuals, will be expressed in the GA.
3) Generation of initial population
Randomly generate a number of routes equal to the population size (the number of individuals which are to be in the population) and form the initial population.
4) Goodness-of-fit evaluation employing the Pareto ranking method
Using the evaluation values for each objective (road information), calculate goodness-of-fit of each route based on the Pareto ranking method.
5) Sharing
To the goodness-of-fit calculated in (4), add revisions which take into account similarities between individuals, and create a new goodness-of-fit.
6) Selection/Culling
Based on the goodness-of-fit to which revisions were added in (5), determine which routes to preserve for the next generation. As a selection method, use a combination of roulette-wheel selection and the preservation of Pareto strategy (elite preservation strategy in a single-objective optimization GA).
7) Crossover
Select two routes from the population to be parents, and by crossing these over at a crossover point, generate two routes which are children.
8) Mutation
Select one route from the population, and once again randomly generate routes at and after the mutation point, in order to generate new routes.
4.2. Creation of Evacuation Route Search Algorithm
4.2.1. Acquisition of Internodal Adjacent Information and Road Link Information
1) Creation of adjacency list
Transform CSV data which contains the internodal adjacency relationships into adjacency list form, and input it into the GA. Concerning the adjacency list, it is given a triple structure, node numbers are made to correspond with the adjacency list index, and adjacency information is stored. As adjacency information, node numbers adjacent to each node and link numbers which link nodes are stored.
2) Creation of road link information list
A link list, formed by transforming CSV data containing road link information into a list, is input into the GA. When this is done, link numbers are made to correspond with the link list index, and road information is stored.
4.2.2. Genetic Coding
This study deals with routes; therefore, the order of node numbers, which forms routes, is an issue. Therefore, in this study, genetic coding is performed using path expression. Path expression is a method in which genes are node numbers, and routes are expressed by lists arranged in the order in which node numbers are passed through. Path expression can be said to be the most natural method. Further, since lists express routes as is, path expression is characterized by the fact that decoding from genotype to phenotype is not necessary. Gene length varies with the number of nodes passed through; therefore, it is variable.
4.2.3. Generation of Initial Population
A number of the individuals coded in the previous section that is equal to the population size number N is randomly generated to form the initial population. The population is represented as a list with a dual structure. In order to prevent routes from looping, nodes which have already been passed through are not used. Further, individuals are generated based on the adjacency list created in Section 4.2.1, and this ensures that only feasible solutions—that is, only routes that are connected—are generated. In this method, the genetic operations of selection/culling, crossing, and mutation are performed on the population generated in the manner described above.
4.2.4. Evaluation of Goodness-of-Fit, Using the Pareto Ranking Method
1) Determination of evaluation values regarding each objective
In this study, the four objectives of reduction of evacuation distance increase in the probability of arriving at the destination which takes road blockages into account, avoidance of hazard caused by fire, and reduction of evacuation time were taken into account in evacuation route optimization. Therefore, firstly, for all individuals, evaluation values for each objective (distance, arrival probability, degree of fire hazard in roads, and estimated evacuation time) were defined using the undermentioned Equations (1) to (3) and (6).
a) Evaluation value for distance
The evaluation value for distance was found as the total evacuation distance to the destination, using the following Equation (1).
 (1)
(1)
 : Total distance for individual Xi [m];
 : Distance for the j-th link which individual Xi passes through [m];
 : Total number of links which individual Xi passes through;
b) Evaluation value for arrival probability
Concerning the evaluation value for arrival probability: For each link, the probability of being able to pass through the link was calculated based on the probability of road blockage for the link. The probability that it would be possible to pass through all road links in the route was the arrival probability. The evaluation value for arrival probability was found as an evaluation value for these probabilities.
 (2)
(2)
 : Arrival probability for individual Xi;
 : Probability of blockage for j-th link that individual Xi passes through;
 : Probability that j-th link that individual Xi passes through will be passable;
 : Total number of links that individual Xi passes through.
c) Evaluation value for degree of fire hazard in roads
The evaluation value for the degree of fire hazard in roads is the sum total of the degree of fire hazard in roads for each link, and is found using Equation (3).
 (3)
(3)
 : Total degree of fire hazard in roads for individual Xi;
 : Degree of fire hazard in roads for j-th link that individual Xi passes through;
 : Total number of links that individual Xi passes through.
d) Evaluation value for estimated evacuation time
The evaluation value for estimated evacuation time is the sum total of the periods of time an evacuee spends passing through links, and is calculated based on the distance, road width, and estimated evacuation population in the road for each link. Based on material from the Urban Disaster Prevention Office of the City Bureau of the Ministry of Construction (1997) [12] and the Director-General for Disaster Management in the Cabinet Office (2005) [13] , an equation for deriving the road width that allows a certain number of evacuees to pass through in an hour is given below.
 (4)
(4)
Here, the evacuation population density indicates the number of people that can evacuate per 1 m2. Generally, one person per square meter is used as the evacuation population density during a disaster. That is equivalent to the density on a crowded train station platform. Further, usually 2 km/h is used as the walking speed during a disaster. This is based on the opinion that it is advisable for designated large-area evacuation sites to be located such that the time it takes to evacuate to them is within an hour and the evacuation distance is within 2 km. With reference to the above-mentioned equation for deriving road width, in the present method, the transit time tj for link j is defined by Equation (5), given below.
 (5)
(5)
 : Time required to pass through link j [h];
 : Distance for link j [m];
 : Estimated evacuation population in road for link j [P];
 : Sum total of estimated evacuation population in roads for links passed through before reaching link j [P];
 : Walking speed [m/h] (=2000 m/h);
 : Evacuation population density [P/m2] (=1 P/m2);
 : Road width for link j [m].
Here, the second term on the right side of Equation (5) expresses the evacuation time, found based on the equation for deriving road width. Further, concerning the estimated evacuation population, when a link is passed through, the estimated evacuation population at that link increases cumulatively. Based on the above, the total evacuation time for individual Xi is defined by the Equation (6), given below, and is an evaluation value.
 (6)
(6)
 : Total evacuation time for individual Xi [h];
 : Total number of links that individual Xi passes through.
The Pareto ranking method is used based on the evaluation values for each of these objectives, to determine objective functions for calculating the goodness of fit of individuals.
2) Goodness of fit evaluation employing the Pareto ranking method
By using the Pareto ranking method based on evaluation values for each objective defined in (1), a rank which expresses the superiority or inferiority of each individual is determined. In the case below, the individual Xi is defined as being “dominated by” Xi.
 (7)
(7)
 : Total evacuation distance;
 : Probability of arriving at destination;
 : Sum total of degree of fire hazard in roads;
 : Total evacuation time.
That is, in the case where individual Xi has a longer distance, a lower probability of arriving, a higher degree of fire hazard in roads, and a longer total evacuation time than individual Xi, individual Xi is defined as being “dominated by” individual Xi. Based on this definition, the rank of individual Xi (expressed by “ ”) when individual Xi is dominated by a number of individuals equal to ni is determined by Equation (8), given below.
 (8)
(8)
An individual for which R = 1 holds true indicates a Pareto optimal solution, which is a solution that is not inferior to any other solution. This rank is used to set objective functions, as in Equation (9) below. Equation (9) is set such that the higher the rank (the closer to 1), the better the goodness of fit.
 (9)
(9)
Thus, objective functions are set based on ranks found using the Pareto ranking method.
4.2.5. Sharing
In the method of this study, sharing in the representational space is conducted. If sharing in the objective space was applied to the method, and routes with similar evaluation values for each objective existed within the population, those routes would be regarded as being similar. However, because routes are focused on in this study, even if evaluation values are similar, it is possible that in the representational space the nodes which form the routes may be completely different; therefore, the routes cannot be regarded as being similar. Due to this reason, in the method of this study, similarity as routes is taken into account, and unique sharing in the representational space is applied. The specific method of sharing in this study is outlined below.
1) The number of nodes which overlap between individuals Xi and Xj are counted. However, the evacuation starting point and destination are not counted.
2) The total number of nodes which form Xi and Xj is counted. However, the evacuation starting point and destination are not counted.
3) The proportion of nodes that overlap between Xi and Xj (expressed as “ ”) is found. The proportion of overlapping nodes is equivalent to the distance d between individuals in sharing in the objective space.
4) Steps (1) to (3) are conducted between all individuals in the population, and the proportion of nodes which overlap between individuals is found for every individual in relation to every other individual.
5) For each individual, a niche number, which is the number of individuals which are similar to that individual, is calculated. The niche number
 of individual Xi is defined by Equation (10), given below.
 (10)
(10)
 : Sharing function;
 : Proportion of nodes that overlap between individuals Xi and Xj;
 : Population size.
The sharing function
 is defined by Equation (11), given below.
 (11)
(11)
 : Sharing rate,
 .
.
In this study, the sharing rate rshare is equivalent to the sharing radius
 of sharing in the objective space. Arbitrary values of from 0 to 1 are given to rshare. That is, in the case where the proportion of nodes which overlap between individuals is equal to or greater than the sharing rate, those individuals are regarded as being similar, and their niche numbers are counted.
6) By dividing the goodness of fit F of each individual by the niche number found for each individual, a new goodness of fit shareF which takes into account similarity between individuals is created. The goodness of fit of the individual Xi, indicated by shareFi, is expressed by Equation (12), given.
 (12)
(12)
By conducting selection and culling based on the value for the goodness of fit shareFi for which the sharing described above has been conducted, the diversity of individuals in the population is maintained, and a more global search, which is important in seeking a set of Pareto optimal solutions, can be conducted. Concerning the effectiveness of the sharing conducted in the method of this study, in Section 6.1 an evaluation experiment is conducted, and the dispersion of individuals within the population is checked to verify whether or not sharing has been conducted effectively.
4.2.6. Selection and Culling
In the method of this study, the strategy of preserving Pareto optimal solutions and roulette-wheel selection are used in combinationas selection and culling operations. Each operation is described below. Selection other than that for individuals whose preservation for the next generation has been determined using the strategy of preserving Pareto optimal solutions is performed using roulette-wheel selection. The probability of selection for individuals in roulette-wheel selection is indicated by pselect. It is based on the goodness of fit for which sharing has been conducted, which is indicated by shareF, and is determined by Equation (13), given below.
 (13)
(13)
Based on the probability of selection for each individual, which is determined by Equation (13), roulette- wheel selection is repeated until the number of next-generation individuals reaches the population size N. By determining probability selection based on goodness of fit which, through the use of sharing, takes into account similarity between individuals, as in Equation (13), a next generation population in which individuals are dispersed evenly and there is no prevalence of similar individuals is generated.
4.2.7. Crossover
The crossover method of this study is described below. As the crossover method, one-point crossover is used.
1) Two individuals are randomly selected from the population to be parent individuals. In the case that the two individuals are formed using exactly the same nodes, the individual generated will be the same as the parent individuals; therefore, crossover is not performed with such individuals.
2) From nodes which overlap between the two individuals (not including the evacuation starting points and destination points), one point is randomly selected as a crossover point. If there are no overlapping nodes, crossover is not conducted.
3) Nodes at and after the crossover point of the parent individuals are swapped, and two child individuals are generated.
4) If a route loops in a child individual, the loop is removed.
The above-described operations are performed based on the crossover probability C, and generated child individuals are added to the population.
4.2.8. Mutation
The mutation method used in the method of this study is described below.
1) One individual is randomly selected from the population.
2) One point is randomly selected from nodes which form the selected individual, and used as a mutation point. However, evacuation starting point and destination points are not selected as mutation points.
3) From the mutation point node, a route which links to the destination point is randomly generated. Route generation is performed based on adjacency lists, similarly to initial population generation, and only feasible solutions, or unbroken routes, are generated.
4) The part of the individual selected in (1) that is at and beyond the mutation point is replaced by the randomly generated route, resulting in the generation of a new route.
5) If a route generated in (4) loops, the loop is removed.
The above-described operations are performed based on the mutation rate M, and generated individuals are added to the population.
5. Creation of Road Information for District Studied
5.1. Evacuation Rules
5.1.1. Evacuation Procedure
The Tokyo Metropolitan Government [14] has two-stage evacuation as a fundamental rule for evacuation in times of disaster, and Sumida City [15] [16] also follows this system. In two-stage evacuation, as the first stage of evacuation after the outbreak of a disaster, people evacuate to a temporary gathering place, and ascertain the damage. As temporary gathering places, elementary schools, junior high schools, parks and so on are designated by each neighborhood association/residents’ association. In the case where the damage is ascertained and the temporary gathering place is judged to be dangerous, as the second stage of evacuation, evacuees evacuate to a designated large-area evacuation site. The Tokyo Metropolitan Government designates places which are roughly 10 ha or more in area as large-area evacuation sites [14] . It is thought that places with an area of 10 ha or more are not affected by radiant heat from fires. Meanwhile, in cases where damage from fire spreads on a large scale after the outbreak of a disaster, and it is judged dangerous to evacuate to a temporary evacuation place, evacuees evacuate directly to a large-area evacuation site. This is referred to as direct evacuation. This study focuses on two-stage evacuation and direct evacuation, and attempts to optimize evacuation routes for each of these methods.
5.1.2. Allocation of Designated Large-Area Evacuation Sites
Each district is assigned a set large-area evacuation site. In the district studied, the 3-chome Kyoujima area has the highest total degree of danger, according to Sumida City [16] . The total degree of danger (the sum of the building collapse risk and the degree of fire hazard) takes into account the degree of difficulty in carrying out activities during a disaster. The Tokyo Metropolitan Government [14] has designated that the large-area evacuation site for the 3-chome Kyoujima area is the Tokyo Metropolitan Bunka 1-chome residential zone (Toei Bunka 1-chome jūtaku ittai). Therefore, the 3-chome Kyoujima area was selected from northern Sumida City as a focus of this study, and this study conducts searches for evacuation routes whose destination is the Tokyo Metropolitan Bunka 1-chome residential zone.
5.2. Creation of Road Information Using GIS
5.2.1. Collection and Processing of Data Used
Table 1 shows the data used in this study and how the data was processed. Information on the probability of total building collapse, sorted by ground area and building type, from “District-based assessment of vulnerability to earthquake disaster (No. 7)” [11] published by the Tokyo Metropolitan Government was used in calculating the road blockage probability and adding it to the road network. However, data on the year each building was constructed is fixed asset tax roll data which falls into the category of personal information, and it is difficult for individuals to obtain. Therefore, in this study, the case of the worst damage possible was imagined, and it was assumed that all wooden buildings were constructed prior to 1970. Further, based on “District-based assessment of vulnerability to earthquake disaster (No. 7)” [11] , a uniform total building collapse rate of 50.99% was used. Further, in this study, crowding on roads due to population concentration is taken into account as a chief cause of obstacles to evacuation. The night and day populations sorted by administrative address units such as block, subdivision and aza (the smallest administrative unit in Japan)were considered (Table 1), and it was found that in the 3-chome Kyoujima area the nighttime population was greater than the daytime population; therefore, the nighttime population was used to calculate the estimated population in roads.
5.2.2. Creation of Road Network Data
In this study, the road blockage probability was calculated based on the positional relationship between the debris width buffer caused by roadside wooden buildings, and the road centerline located in front of that. Therefore, the road centerline was extracted from land use data, and was used to create node data which showed intersections and crossroads, and link data which showed roads which connected the intersections and crossroads. Road network data was created by further integrating these sets of data. Figure 3 shows the road network

Table 1. Data used and data processing method.

Figure 3. Road network.
created as described above, and road information was added to this data.
5.2.3. Road Blockage Probability Calculation and Its Addition to the Road Network
Road blockage probability was added to the road network data in Figure 3 as an attribute. This study takes into account two types of blockage: 1) Single blockage, defined as being when a road is blocked by the collapse of a wooden building on only one side of a road, and 2) Combined blockage, defined as being when a road is blocked by the collapse of wooden buildings on both sides of a road. Here, in the case of (1) single blockage, when the debris width produced by a collapsed building intersects with a building shape located on the other side of the road, the road located between these buildings is regarded as being blocked. Further, in the case of (2) combined blockage, when the debris widths produced by collapsed buildings on both sides of the road intersect, the road located between these collapsed buildings is regarded as being blocked. Concerning road blockage probability for the case of (1) single blockage, since the road will be blocked by the collapse of one wooden building on one side of the road, the blockage probability is regarded as being the same as the probability that a wooden building will collapse. Meanwhile, in the case of (2) combined blockage, since the road is blocked when buildings on both the left and right sides of the road collapse, the blockage probability is found by multiplying the collapse probabilities for buildings on the left and right sides of the road. Below, methods for calculating road blockage probability and adding it to the road network are described.
1) Roadside building extraction and classification
Roadside buildings, which are a primary factor in road blockage, were extracted. First, a buffer from the road centerline was created on the right side only, and the spatial search function of the GIS was used to extract buildings which intersected with the buffer. Similarly, next a buffer from the road centerline was created on the left side only, and buildings which intersected with the buffer were extracted. By following these steps, buildings were classified into those located on the right side of the road and those located on the left side of the road.
2) Extraction of roadside wooden buildings and addition of probability of collapse
Using the GIS attribute search function, wooden buildings were extracted from both the buildings on the right side and the buildings on the left side. Further, probability of collapse was added as an attribute to each of the wooden buildings.
3) Extraction of pairs of buildings which would cause blockage
a) Case of single blockage
A buffer with a radius equal to the width of debris which would be produced from a wooden building on the right side of the road if it collapsed was created, and the GIS spatial search function was used to extract any building on the left side of the road which intersected with the buffer. The same was done for the left side of the road, and pairs of buildings which would cause single blockage were extracted. Concerning the outflow of debris that occurs when a building collapses, the case of maximum damage was imagined, and it was assumed that debris would flow out evenly in all directions. Further, concerning the debris width, with reference to Ichikawa et al. (2001) [5] , the debris width was found using Equation (14), given below. Concerning the number of floors in buildings, reference was made to data on the present building use situation. As the average floor height, a uniform average floor height of three meters was used.
 (14)
(14)
b) Case of combined blockage
Debris width buffers were created for wooden buildings on both the left and right sides of the road. The GIS spatial search function was used to extract left-side debris buffers which intersected with right-side debris buffers and right-side debris buffers which intersected with left-side debris buffers. These steps were performed to extract buildings on the right side and buildings on the left side which would cause combined blockage.
4) Generation of road section lines
With reference to Yoshikawa et al. (2003) [17] , section lines (lines which connected the center points of buildings which would cause road blockage) were created. Using the GIS XY To Line tool, line data was generated for lines which connected the center points of buildings which would cause road blockage (which were extracted in (3) above), and this data was used as section lines. XY coordinates which were the center points of buildings were found using the GIS geometry arithmetic function. Section lines were generated to suit three types of case—the case of single blockage caused by the collapse of wooden buildings on the right side of the road, the case of single blockage caused by the collapse of wooden buildings on the left side of the road, and the case of combined blockage. Further, blockage probability which suited the type of blockage was added for each case.
5) Addition of blockage probability to road network
Using the GIS spatial coupling tool, to each road link which intersected with the three types of section line generated in (4), blockage probability (indicated by pk) for each of the points on section lines (indicated by k) was added.
6) Calculation of road blockage probability
Through the above operations, to each road link, blockage probabilities (indicated by pk) for points on section lines (these points were indicated by k) were added. The probability Ps that all points k on the section lines of each road link would be passable was calculated using the blockage probability pk, and is expressed by Equation (15) (Takeuchi et al. (2002) [4] ).
 (15)
(15)
Therefore, the road link blockage probability Pb was found using the Equation (16) below:
 (16)
(16)
Using the GIS field arithmetic function, the above-described calculations were performed on a road link data attribute table, and blockage probability was calculated for each road link. Figure 4 shows the road network to which road probability blockage for each link, calculated using the above operations, was added. From Figure 4, it can be seen that blockage probability is high in the northeastern part.
5.2.4. Measurements of Road Width
Road width was measured based on road edge line data and road centerlines (road links) created in Section 5.2.1. Road width is necessary when calculating fire hazard and evacuation time. The method for measuring road width is described below.
1) Based on road edge line data, buffers with a radius of 0.5 m were generated, and road links which intersected with the buffers were extracted using the GIS spatial search function. This enabled roads with a width of less than 1 m to be extracted.
2) A width of 1 m (the case where the buffer radius is 0.5 m) was given to the extracted road links as an attribute.
3) Road links extracted in (2) were excluded from the overall body of road link data.
4) Once again, buffers were generated from road edge line data. When performing this step, the buffer radius was a value obtained by adding 0.5 m to the buffer radius set in (1). Further, using the GIS spatial search function, the group of road links which did not include roads with a width of less than 1 m (which was created in (3)) was superposed with the buffers, and road links which intersected with the buffers were extracted. This step enabled roads with a width greater than or equal to 1 m and less than 2 m to be extracted.
Steps (1) to (4) were repeated, increasing the buffer radius by 0.5 m each time. Through this, road link data was extracted for widths every meter up to a maximum width. Finally, the road link data extracted for widths every meter was integrated using the GIS merge function to create one set of road link data containing the addition of width information for every road link. Figure 5 shows a road network to which road width measured as
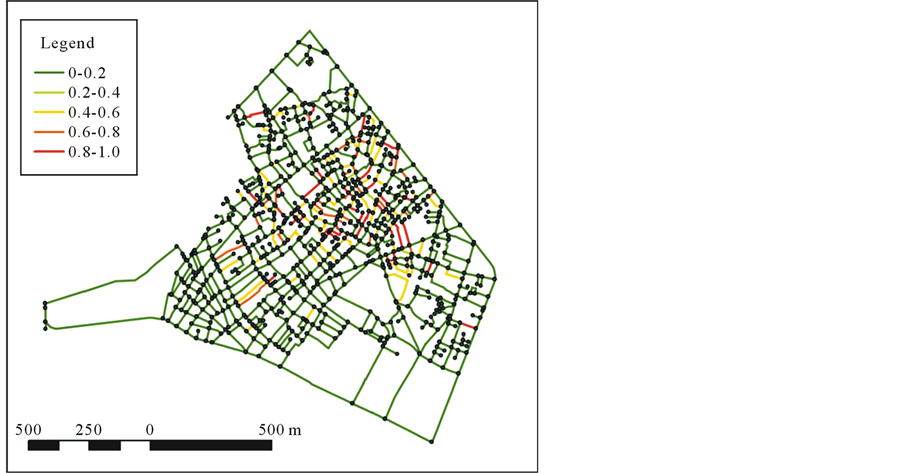
Figure 4. Road network to which road probability blockage has been added.

Figure 5. Road network to which road width has been added.
described above has been added.
5.2.5. Addition of Degree of Fire Hazard to Road Network
The degree of fire hazard for each block and chome* (* a numbered subdivision of an area in an address) from “District-based assessment of vulnerability to earthquake disaster (No. 7)” [11] was added as the hazard due to fire for each road link. The method for doing so is described below.
1) The degree of fire hazard for each block and chome was added as an attribute to block and chome polygon data taken from data on the present land use situation.
2) Using a GIS spatial coupling tool, degree of fire hazard was added to road links which intersected with each block and chome polygon. The Great Hanshin Earthquake clearly showed that roads with a width equal to or greater than twelve meters have the effect of interrupting the spread of fire. Therefore, roads with a width of twelve meters or more were assigned a fire hazard degree of zero. Concerning road width data, the values measured in Section 5.2.3 were used.
3) The degrees of fire hazard added to road links in step (2) were constant within each block/chome. Therefore, the degree of fire hazard did not differ between the road links in a block/chome. This meant that no matter what road in the block/chome was passed through, the degree of fire hazard would be the same. However, for evacuation in the case where a fire has broken out, speedy evacuation to roads with a wide width which will not suffer damage from fire or the spread of fire is important; therefore, evacuation distance is thought to be closely related. Here, based on the idea that “The longer the evacuation distance travelled in a block/chome with a high degree of fire hazard, the more likely it is that fire hazard will be encountered”, as a new indicator showing the degree of hazard due to fire in a road, a value found by multiplying the degree of fire hazard with the road link distance was used as the degree of fire hazard in a road. Further, the degree of fire hazard in roads for each road was calculated using the GIS field arithmetic function in a road link attribute table. Doing this enabled the degree of fire hazard in roads within a block/chome to be varied.
Figure 6 shows the road network to which the degree of fire hazard in roads created in the above manner was added.
5.2.6. Calculation of Estimated Evacuation Population within Road and Its Addition to the Road Network
The estimated population of evacuees which would occur in each road at the time of a disaster outbreak was calculated, and was added to road links as an attribute. Estimated population is used in the GA when calculating evacuation time for a route. Below, methods for calculating the estimated population within a road and adding it to the road network are described
1) Using the GIS spatial search function, based on data on present use of buildings which intersected with block/chome polygon data taken from data on the present land use situation, for each block/chome, the buildings in the block/chome were extracted.
2) Using the GIS attribute search function, from the data on buildings extracted in step (1), only the single or detached houses and apartment buildings or housing complexes with many nighttime evacuees were extracted.
3) Using Equation (17), estimated populations which matched the total floor space of each residence were assigned. Calculation for Equation (17) was performed using the GIS field arithmetic function in attribute fields for building data. Figure 7 shows the estimated evacuation population for each residence, calculated as described above.

Figure 6. Road network to which degree of fire hazard in roads has been added.

Figure 7. Estimated evacuation population for each residence.
 (17)
(17)
4) Using the GIS spatial coupling tool, the estimated evacuation population of each residence was assigned to the road link closest to the residence.
Figure 8 shows a road network to which estimated evacuation population in the road calculated as described above was added.
5.2.7. Output of Road Link Data
All road information for the road network created in Sections 5.2.1 to 5.2.6 was integrated into a single GIS attribute table and output. The method of doing so is described below.
1) Using the GIS dissolve function, all road information was summarized based on road link IDs. This enabled the distance (Figure 3), road blockage probability (Figure 4), road width (Figure 5), degree of hazard due to fire in road (Figure 6), and estimated evacuation population in road (Figure 8) for each road link to be summarized into a single GIS attribute table.
2) The GIS tool for exporting feature attributes to ASCII was used to output the road information in step (1) to a CSV file.
Road link data output as described above is input to the GA as road information when route search is performed.
6. Evaluation of Evacuation Route Search Algorithm
In this section, an evaluation experiment conducted in order to demonstrate the validity of the method of this study is described. In Section 6.1, in order to demonstrate the validity of the unique sharing method of the method of this study, whether or not effective sharing was conducted is verified. This is done by checking the distribution of solutions. At the same time, by considering the change in solutions derived that occurs when the sharing rate rshare is changed, an appropriate rshare value is clarified. In Section 6.2, by considering the change in solutions in the case where the number of objectives is changed, and the convergence of solutions, whether or not multi-objective optimization was conducted appropriately is examined. Further, at the same time, GIS is

Figure 8. Road network to which estimated evacuation population in roads has been added.
used to visualize derived routes, and a visual evaluation is conducted.
In the evaluation experiment in this section, in order to compare derived routes, the same evacuation starting point and the same evacuation destination point were used throughout the experiment. Specifically, as shown in, Figure 9 in the evaluation experiment, the evacuation starting point was Point A, and the destination was Point B, which is a node adjacent to the large-area evacuation site.
6.1. Sharing Evaluation Experiment
In this section, in order to examine the effects of the unique sharing of this study, the distribution of individuals within the population for the case where sharing is not conducted and the case where sharing is conducted and the sharing rate rshare is changed are compared. Doing this enables verification of whether or not the objective of sharing, which is “the maintenance of diversity in solutions within the population”, was achieved successfully. In this section, optimization is conducted using two objectives for which distribution of individuals is easy to grasp visually (evacuation distance and arrival probability).
6.1.1. GA Parameters
Table 2 shows GA parameters for the evaluation experiment concerning sharing. In order to enable comparison of the effects of sharing in each case from (1) to (6), derivation of solutions was carried out with all parameters except for rshare being the same for every case.
6.1.2. Sharing Evaluation Experiment Results and Discussion
Table 3 shows evaluation values for the Pareto optimal solutions derived from individuals in the population of

Figure 9. Evacuation starting point and destination in evaluation experiment.
Table 2. GA parameters in sharing evaluation experiment.
Table 3. Evaluation values for Pareto optimal solutions derived from distribution of individuals in the population of the final generation.
the final generation for each of Cases (1) to (6) in Table 2. It can be seen that in the case where sharing was not conducted, the population is dominated by individuals which are similar. Therefore, a global search was not conducted, and the search for Pareto optimal solutions was also not conducted sufficiently. The smallest number of Pareto optimal solutions was derived in this case-five. In Case (2), where rshare = 0.2, because sharing was conducted, compared to Case (1) there are more types of individual in the population, and further, six Pareto optimal solutions were derived. This is thought to be due to the fact that because individuals in the population were diverse, the number of types of parent individual in the genetic operations of crossover and mutation increased. That is, due to the number of types of parent individual increasing, child individuals generated based on those parent individuals also became diverse, and therefore a more global search was possible. This is also thought to be the reason why more Pareto optimal solutions were derived in Cases (3) to (6), with seven being derived in each of Cases (3) to (5), and eight being derived in Case (6). Further, comparing Cases (3) to (6), it can be seen that individuals in the population are most diverse in Case (6), for which rshare = 1.0.
rshare = 1.0 indicates the case where sharing which lowers the goodness of fit of individuals formed with exactly the same nodes is performed in the population. In the method of this study, when the two individuals that are parents are formed with exactly the same nodes, crossover operations are not performed. This is because even if the parents were crossed, child individuals which were exactly the same as the parents would be generated. By lowering the goodness of fit of individuals with exactly the same structure through sharing for which rshare = 1.0, more diverse individuals are selected in the population through selection and culling, and therefore crossover can be performed effectively. Through this, since crossover allows a greater variety of child individuals to be generated, a greater variety of individuals exists within the population. Due to the above-mentioned reasons, it is thought that in the method of this study, sharing for which rshare = 1.0 was the most effective sharing.
Due to these reasons, it was confirmed that the sharing in this study had the effect of maintaining the diversity of individuals within the population, and consequently a global search is possible; therefore, it is likely that a greater number of Pareto optimal solutions will be found. Further, it was confirmed that in the method of this study, sharing is most effective when rshare = 1.0. Therefore, rshare = 1.0 is used in this method, as it is considered to be the best sharing rate.
6.1.3. Experiment to Evaluate Multi-Objective Optimization
This section describes an evaluation experiment which was carried out in order to verify whether or not multi- objective optimization of evacuation routes was carried out appropriately by the method of this study. The GA parameters in the evaluation experiment were as follows. Sharing rate: rshare = 1.0; Population size: N = 100; Number of trial generations: G = 1000; Crossover rate: C [%] = 100; and Mutation rate: M [%] = 1. Table 4
Table 4. Evaluation values for routes optimized for evacuation distance, arrival probability, degree of hazard due to fire in the road, evacuation time and total evacuation population.
summarizes evaluation values for each objective for routes derived, for which evacuation distance, arrival probability, degree of hazard due to fire in the road, and evacuation time were optimized. Twenty routes were derived as Pareto optimal solutions. Of these, Routes 1, 11, 19 and 20 are shown in Figure 10. Further, Figure 11 and Figure 12 show results for derived routes superposed with road width and estimated evacuation population for each residence, and derived routes superimposed with the estimated evacuation populations in roads and for each residence, respectively.
Concerning the derived routes, including Routes 1, 18, 19 and 20, the routes are almost the same as in the case when evacuation distance, arrival probability, and degree of hazard due to fire in the road were optimized; however, a new route, Route 11, which minimizes evacuation time, was derived. Route 11 does not have the shortest evacuation distance, but it has the shortest evacuation time. Route 1, the shortest route, has a total evacuation population of 150 people, while Route 11 has a total evacuation population of 81 people. Further, Figure 12 clearly shows that while Route 1 passes through roads with a large estimated evacuation population, Route 11 passes through roads with a relatively small estimated evacuation population. Further, Figure 11 clearly shows that while Route 1 mainly passes through roads with a width of three to four meters, Route 11 mainly passes through roads with a width of seven to nine meters. Therefore, it is thought that evacuation time for Route 1 is prolonged due to crowding in the roads that is a result of a large evacuation population, and furthermore, roads with a narrow width. In contrast, Route 11 has a small estimated evacuation population, and wide roads were selected for it; therefore, it is considered that there is hardly any prolongation of evacuation time due to crowding in the roads for Route 11. Thus, it was confirmed that by adding evacuation time as an objective in this manner, new routes which take evacuation time into account can be generated.
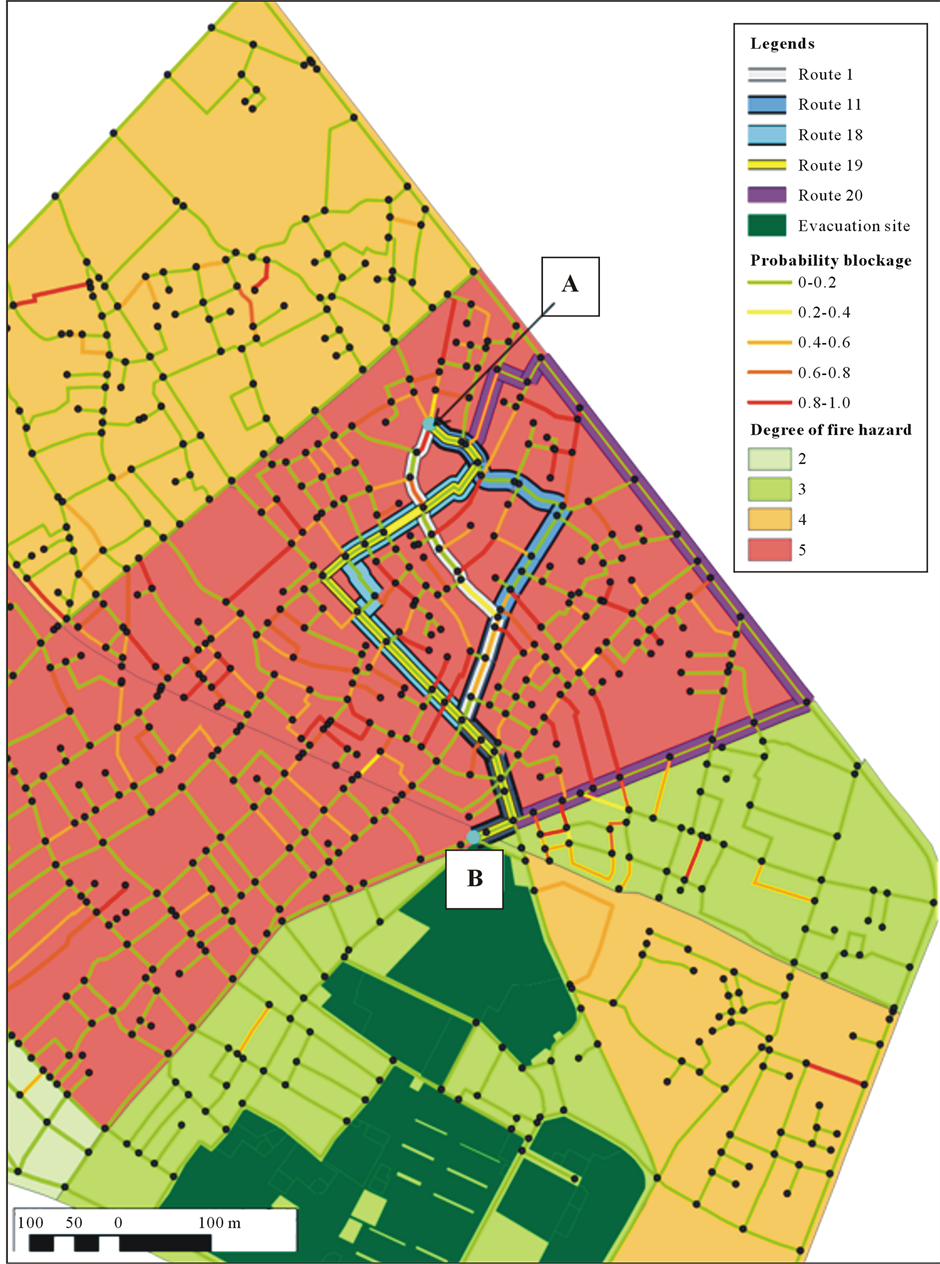
Figure 10. Routes optimized for evacuation distance, arrival probability, degree of hazard due to fire in the road and evacuation time.

Figure 11. Derived routes, road width and estimated evacuation population for each residence.
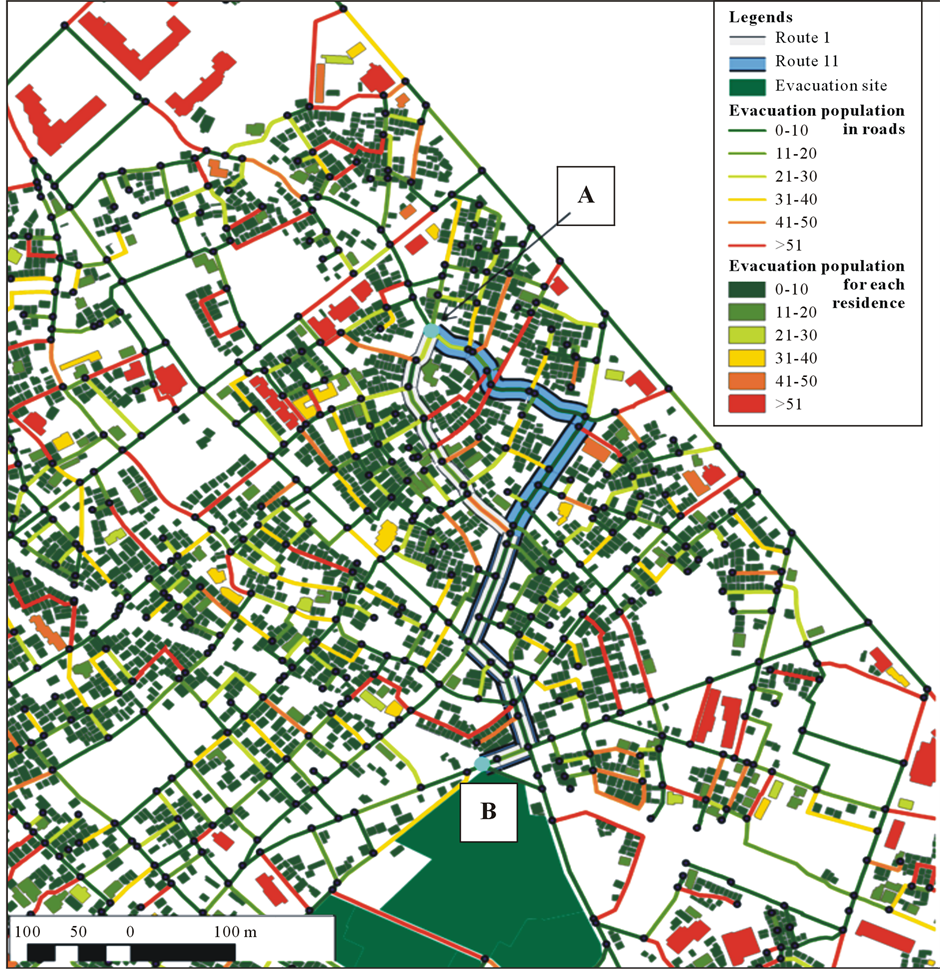
Figure 12. Derived routes, estimated evacuation populations in roads and for each residence.
The result that is clear from above is that as the number of objectives was increased, multiple routes whose evaluation values for each objective were intrade-off relationships with each other were obtained. These routes were Pareto optimal solutions, meaning that in order to improve an evaluation value for one of the objectives, an evaluation value for one of the other objectives would have to be degraded. Therefore, it is considered that multi-objective optimization was carried out appropriately. Thus, in the method of this study, multiple evacuation route candidates are derived in a single search as Pareto optimal solutions; therefore, from these candidates, multiple evacuation routes which envisage what will happen in a time of disaster can be selected.
6.2. Convergence of Evaluation Values for Each Objective
In order to verify whether or not multi-objective simultaneous optimization was effectively carried out, convergence of evaluation values for each objective in a four-objective optimization was examined. The GA parameters in the evaluation experiment were as follows. Sharing rate: rshare = 1.0; Population size: N = 100; Number of trial generations: G = 1000; Crossover rate: C [%] = 100; and Mutation rate: M [%] = 1. Figure 13 shows the convergence of evaluation values for each generation derived. From Figure 13 it can be seen that average values in the populations converged in the 600 meter region for evacuation distance, in the 2000 region for degree of hazard due to fire in the road, and in the 0.5 hour region for evacuation time.
However, concerning arrival probability, it can be seen that while the average value for arrival probability of individuals within the population improved overall compared to the initial generation with the repeated creation of generations, a clear convergence could not be confirmed, compared with the other three objectives. The fact that evacuation distance is intimately connected with all three of the other objectives is considered a reason for this. Evacuation distance itself is an evaluation value that is determined by distance, and degree of hazard due to fire in the road is an evaluation value obtained by multiplying the degree of hazard due to fire per block/chome by the distance of each road. Further, evacuation time is an evaluation value obtained by using evacuation distance and walking speed to find the regular transit time, and then adding extra time to that due to crowding. In the case where there is only a small influence from crowding, evacuation time is strongly dependent on evacuation distance. Due to this, it is thought that the more the evacuation distance for individuals in the population converges on a small value, the more evacuation distance, degree of hazard due to fire in the road, and evacuation time will improve. Meanwhile, since arrival probability is not dependent on evacuation distance, it will not improve if the evacuation distance for individuals in the population becomes shorter. Nevertheless, it can be seen that evaluation values for each objective for individuals in the population improved with the addition of each generation, and it is considered that multi-objective simultaneous optimization was carried out adequately.
7. Proposal of Evacuation Route Candidates in the District Studied
7.1. Selection of Representative Evacuation Starting Points and Evacuation Destination Points for Each District
Points in each area for which evacuation was considered to be most difficult based on the total degree of hazard (which takes into account the degree of difficulty of conducting activities in times of disaster) were selected as representative evacuation starting points. Further, evacuation routes are proposed for two types of evacuation
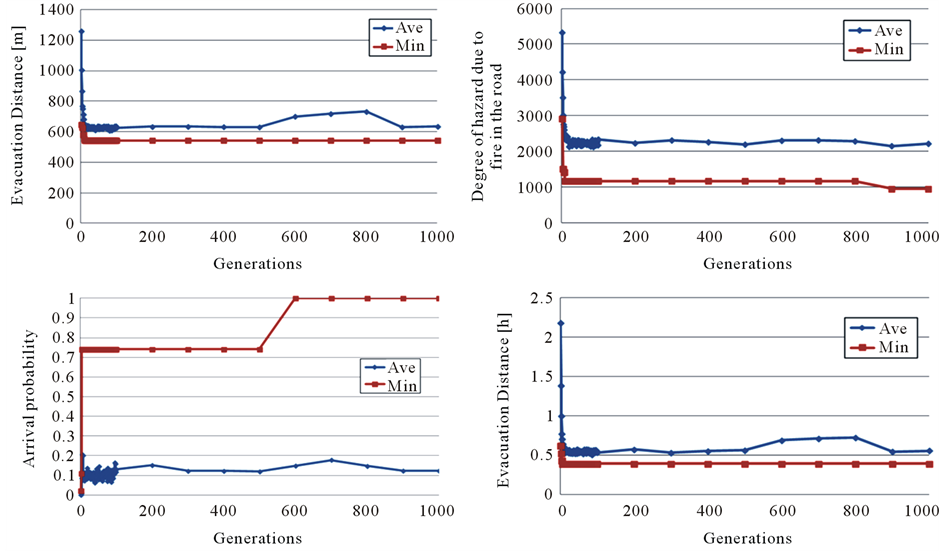
Figure 13. Convergence of each evaluation value with each generation derived.
method in this study—the case of two-stage evacuation, and the case of direct evacuation. Therefore, two points were selected as evacuation destination points—a temporary gathering place, which is the first destination point, and a large-area evacuation site, which is the second destination point. The temporary gathering place is a place designated by Sumida City [16] , the location of the evacuation starting point, and the large-area evacuation site is a place designated by the Tokyo Metropolitan Government [14] . Specifically, as shown in Figure 14, Point A was used as the evacuation starting point. Point A is located in 3-chome Kyoujima, an area for which the total degree of hazard (which takes into account the degree of difficulty of conducting activities in times of disaster) is high. Further, the temporary gathering place for the residents of Point A is Karatachi Children’s Playground; therefore, Point B, a point adjacent to the playground, was used as the first destination. Point C was used as the second destination. Point C is adjacent to the Tokyo Metropolitan Bunka 1-chome residential zone (Toei Bunka 1-chome jūtaku ittai), which is a large-area evacuation site.
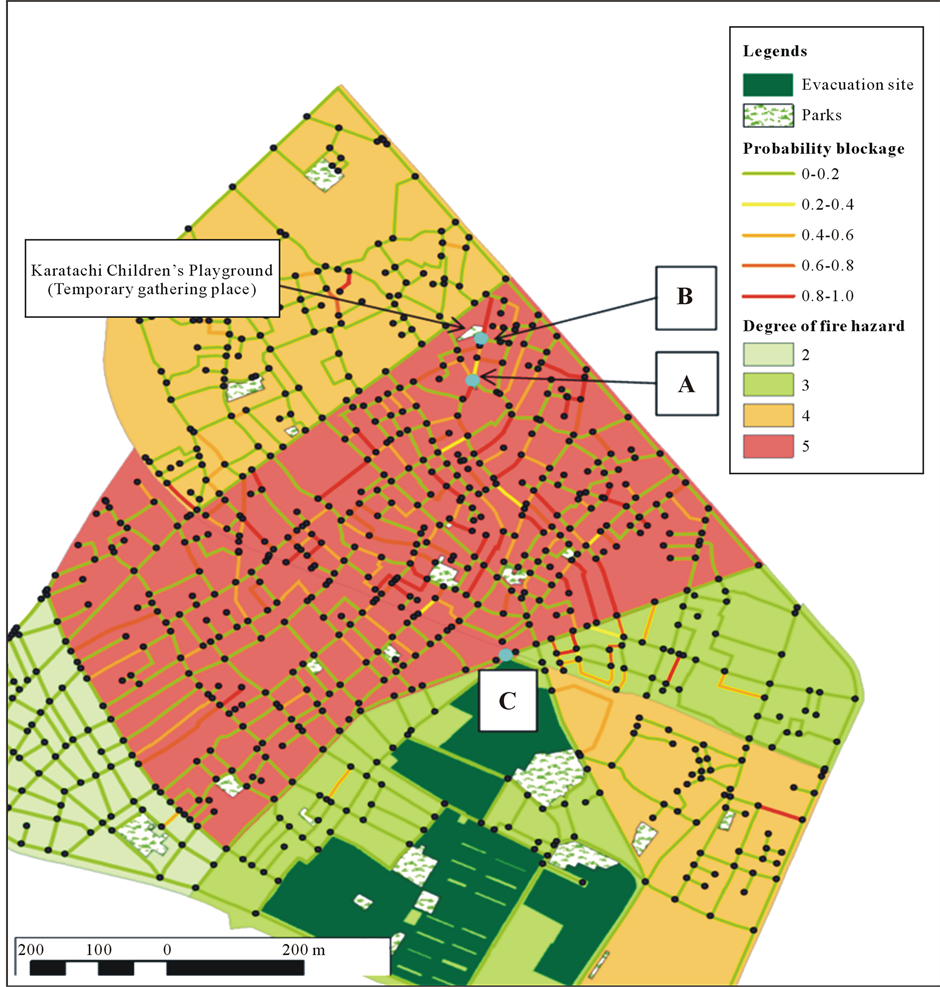
Figure 14. Evacuation starting point and destinations.
7.2. GA Parameters
The GA parameters set for route search were as follows. Sharing rate: rshare = 1.0; Population size: N = 150; Number of trial generations: G = 1000; Crossover rate: C [%] = 100; and Mutation rate: M [%] = 2.
7.3. Examples of Evacuation
7.3.1. Evacuation Routes in the Case of Two-Stage Evacuation
1) Routes from evacuation starting point to temporary gathering place
As routes from Point A, the evacuation starting point, to Point B, the neighborhood of the temporary gathering place, only the two routes shown in Table 5 and Figure 15 were derived as Pareto optimal solutions.
Route 2 has the shortest distance; however, because it involves passing through roads with a high probability of blockage, it has a low arrival probability of 36%. In contrast to this, Route 1 detours to avoid roads with a high blockage probability, and has an arrival probability of 100%. Further, because Route 1 is not an unnecessarily indirect route, no large differences can be observed between Route 1 and Route 2 for evacuation distance,

Figure 15. Evacuation routes from evacuation starting point to temporary gathering place.
Table 5. Evaluation values for evacuation routes from evacuation starting point to temporary gathering place.
degree of hazard in the road due to fire, and evacuation time. Accordingly, Route 1, which has a high arrival probability, is thought to be suitable as an evacuation route, and therefore was chosen as a preference solution.
2) Route from temporary gathering place to large-area evacuation site
As routes from Point B, the neighborhood of the temporary gathering place, to Point C, the neighborhood of the large-area evacuation site, thirty-two routes were derived as Pareto optimal solutions. Table 6 shows evaluation values for the derived routes. Of the derived routes, Routes 27 and 30 are shown in Figure 16. Further, Figure 17 and Figure 18 show results for preference routes superposed with the estimated evacuation populations in roads and for each residence, and derived routes superposed with road width, respectively.
Table 6. Evaluation values for derived routes.
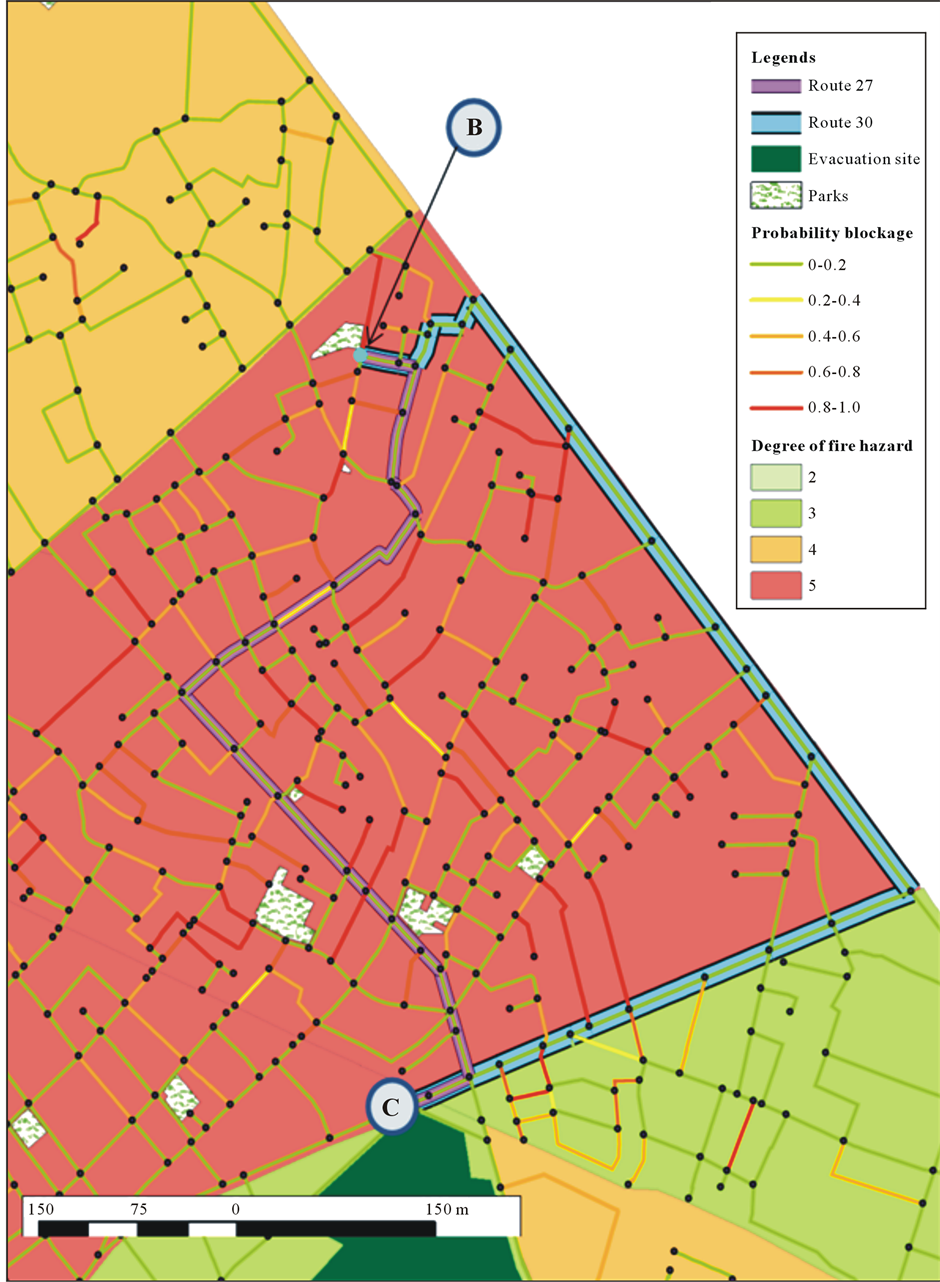
Figure 16. Preference routes from temporary gathering place to large-area evacuation site.

Figure 17. Preferences routes from temporary gathering place to large-area evacuation site, shown with the estimated evacuation populations in roads and for each residence.

Figure 18. Preferences routes from temporary gathering place to large-area evacuation site, shown with road widths.
Concerning the derived routes, the maximum evacuation distance, which belongs to Route 32, is only 1106.7 m. Therefore, even if the length of either of the routes in Case (1) described above (routes from Point A, the evacuation starting point, to the neighborhood of the temporary gathering place) is added to the length of any of the derived routes in Table 6, the combined distance will still fall within two kilometers. Similarly, concerning evacuation time, even if the evacuation time of either of the routes in Case (1) is added to that of any of the derived routes in Table 6, the combined evacuation time will still be within an hour. Concerning arrival probability, routes which fulfilled the preference condition of greater than or equal to 70% were Routes 26, 27, 30 and 31. Of these four routes, Routes 27 and 30 (Figure 16), which have a relatively low degree of hazard due to fire in the road and whose characteristics differ from each other, were chosen as preference solutions. Route 27 has a short evacuation distance, and also, compared to the other derived routes, a relatively high arrival probability. However, from Figure 17 and Figure 18, it can be seen that for this route, the distance passing through roads in blocks/chome with a narrow width is long, and the degree of hazard due to fire is relatively high. Route 30 has a relatively long evacuation distance; however, it has a high arrival probability and also a low degree of hazard due to fire. From Figure 16 it can be seen that roads in this route are unlikely to be crowded, because this route avoids roads with a high blockage probability, and evacuees who take this route will come out at a road with a wide width after going only a short distance; further, the route passes through roads with wide widths. Therefore, this route has a shorter evacuation time than Route 27, which has a short route distance.
7.3.2. Evacuation Routes in the Case of Direct Evacuation
Twenty-one routes were derived as Pareto optimal solutions for direct evacuation routes from Point A, the evacuation starting point, to Point C, near the large-area evacuation site. Table 7 shows each of the evaluation values for the derived routes, and Routes 19 and 20 were selected for illustration in Figure 19. Further, Figure 20 and Figure 21 show results for preference routes superposed with the estimated evacuation populations in roads and for each residence, and derived routes superposed with road width, respectively.
Table 7. Evaluation values for routes in case of direct evacuation.
The derived routes all had an evacuation distance of within two kilometers and an evacuation time of within one hour. Of the derived routes, only three had an arrival probability of over 70%—Routes 18, 19 and 20. Near the evacuation starting point, there are many roads with a high road blockage probability, so it is considered that evacuation is difficult. However, it was possible to find routes such as these three—routes with a high arrival probability and a low fire hazard. Of these three routes, Routes 19 and 20 (Figure 19) have a relatively low risk due to fire compared to the other derived routes, because they enable speedy evacuation to roads with a wide width. These routes were selected as preference solutions. Further, Routes 19 and 20 also have a high arrival probability; therefore, fast and safe evacuation is possible along these routes.

Figure 19. Preference routes for case of direct evacuation.

Figure 20. Preference routes for case of direct evacuation, shown with the estimated evacuation populations in roads and for each residence.
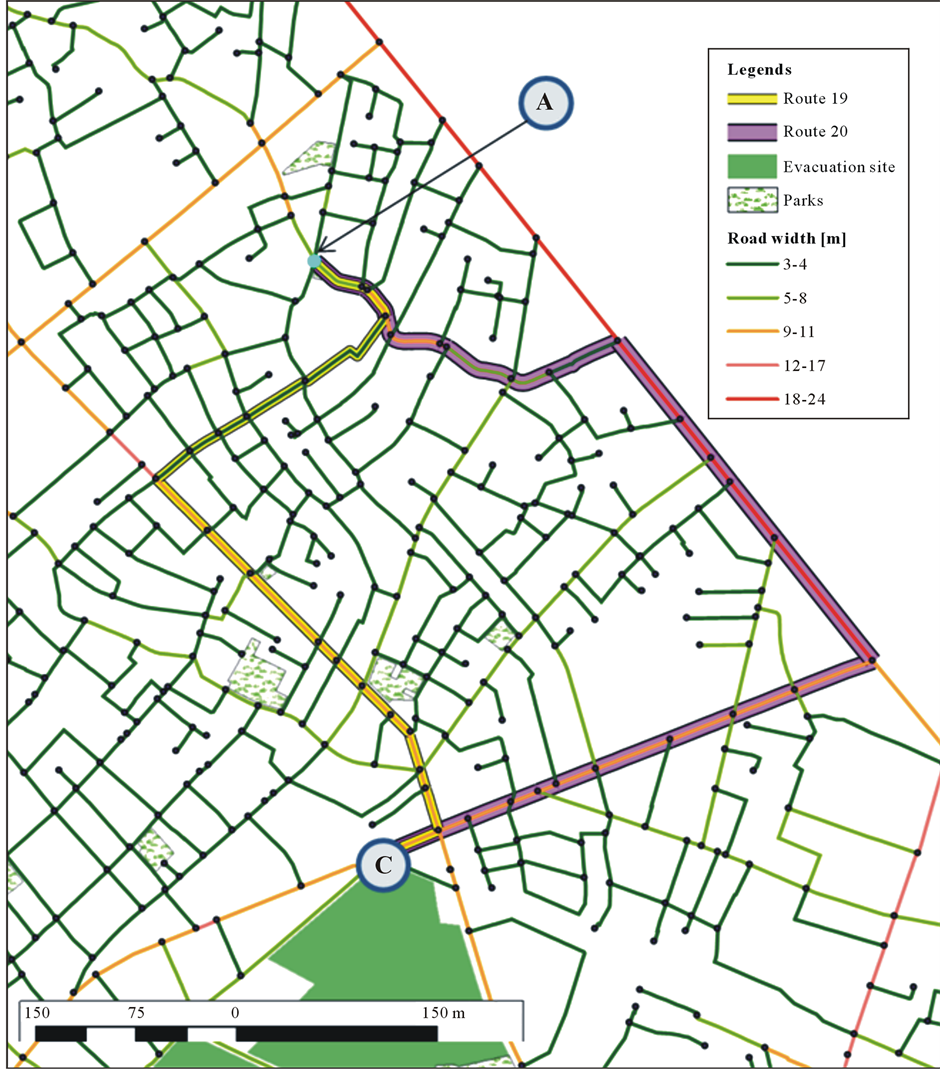
Figure 21. Preference routes for case of direct evacuation, shown with road width.
8. Conclusion and Future Research Topics
The conclusion of this study can be summarized into the following three points:
1) A GA was used to design and create an evacuation route search algorithm which solves the problem of the optimization of earthquake disaster evacuation routes by treating it as an optimization problem with multiple objectives, such as evacuation distance and evacuation time. By using this method, it is possible to find multiple evacuation route candidates whose objectives are in a trade-off relationship with each other in a single search. Further, selecting preference solutions from among the evacuation route candidates derived enables the determination of multiple evacuation routes in preparation for disaster.
2) In this method, goodness of fit is set by using a Pareto ranking method to determine the ranking of individuals based on their relative superiorities and inferiorities. This enables objective functions to be set without taking into account weightings or orders of priority between each objective. Therefore, the number of objectives can be freely increased, and various objectives which disaster evacuation routes are required to meet can be taken into account. Further, because this method performs searches based on road blockage probability and evacuation distance, which are quantified data, derived routes are routes that have been quantitatively evaluated, and they can be highly effective indicators for determining evacuation routes.
3) In the method, road information concerning obstacles to disaster evacuation was created based on data regarding present conditions, such as building and land use data. In this method, searching for evacuation routes based on the information on present conditions allows evacuation routes to be derived based on present building and road locations. Therefore, this method has a high degree of spatial reproducibility. Further, this method is based on publicly available information; therefore, obtaining geographic information similar to that of this study enables this method to be effective regardless of what region it is applied to, or whether the data regards the past or the future. Therefore, in addition to spatial reproducibility, this method also has a high degree of temporal reproducibility.
Examples of future topics for research are improvement of search accuracy, GIS visualization of trade-off relationships of derived solutions, and further refinement of road information.
References
- The Reconstruction Design Council in Response to the Great East Japan Earthquake (2011) Towards Reconstruction. “Hope beyond the Disaster”. Bureau of Task Force for Reconstruction in Response to the Great East Japan Earthquake, 84.
- Komura, T. and Hirano, A. (1997) Disaster Imagination Game (DIG), A Drill Using Maps. The Annual Conference of the Institute of Social Safety Science, 7, 136-139.
- Liu, Y., Hatayama, M. and Okada, N. (2006) Development of an Adaptive Evacuation Route Algorithm under Flood Disaster. Annuals of the Disaster Prevention Research Institute, 49B, 189-195.
- Takeuchi, T. and Kondou, A. (2002) An Analysis of Evacuation Routes Taking into Consideration Road Sections Blocked by Earthquake—A Case Study of Sazaki City. The 26th Infrastructure Planning and Management Research Presentation Meeting, Presentation No. 332(CD-ROM).
- Ichikawa, F., Sakata, T. and Yoshikawa, T. (2001) Study on the Placement of Evacuation Areas, Taking into Account the Danger of Blocked Roads on Evacuation Routes. Summaries of Technical Papers of Annual Meeting Architectural Institute of Japan, 489-490.
- Inoue, M. and Yamamoto, K. (2013) Method for Evaluating the Location of Tourist-Related Public Facilities Using Genetic Algorithms and GIS. Journal of Communication and Computer, 10, 496-512.
- Asou, T., Matsumoto, Y. and Morishita, K. (2007) A Study on the Optimal Location of Disaster Shelters Using Genetic Algorithm. Research Report of Faculty of Engineering, 58, 522-533.
- Koarai, M., Satou, H. and Une, H. (2007) GIS Analysis of the Relationship between Earthquake-Induced Ground Disaster and the Physical Characteristics of Land. Bulletin of the Geospatial Information Authority of Japan, 112, 115- 123.
- Hara, K., Tsukahara, S., Kanou, H., Sota, T. and Kurokawa, H. (2006) Predictive Route Searching for Car Navigation Systems Using Multi-Objective Genetic Algorithm. Society for the Study of Intelligent Transport Systems, Information Processing Society of Japan, ITS-24, 31-38.
- Kinoshita, Y. and Yokokishizawa, H. (2008) Proposal for a Tourist Route Planning Support System Using Sensitivity Evaluation and Multi-Objective GAs. Japan Society for Fuzzy Theory and Intelligent Informatics, 24th Fuzzy System Symposium, FC2-1, 864-869.
- Bureau of Urban Development, Tokyo Metropolitan Government (2013) District-Based Assessment of Vulnerability to Earthquake Disaster (No. 7). 300.
- Urban Disaster Prevention Office of the City Bureau of the Ministry of Construction (1997) Practical Handbook of Urban Disaster Prevention. Earthquake Disaster Prevention, 249.
- Director-General for Disaster Management in the Cabinet Office (2005) Report on Investigation into Wide-Area Disaster Prevention Measures in the “S.K.Y Kouikiken”* Area (*ALarge Area Centering on the Fuji, Hakone and Izu Areas). 167.
- Tokyo Metropolitan Government. Disaster Prevention Facilities, Sheltersand Evacuation Areas. http://www.bousai.metro.tokyo.jp/bousai/1000029/index.html
- Sumida City. Sumida City Disaster Prevention Map. http://www.city.sumida.lg.jp/kurasi_guide/katei_tiikinobousai/sumidakubousaitizu.html
- Sumida City. Your Evacuation Site. http://www.city.sumida.lg.jp/kurasi_guide/katei_tiikinobousai/hinanbasyo.html
- Yoshikawa, T., Yokota, K. and Sakata, T. (2003) A Stochastic Model Basis for Simulation of Road Blockage Which Takes into Account Individual Collapsed Buildings in Actual Urban Areas in Great Earthquakes. Summaries of Technical Papers of Annual Meeting Architectural Institute of Japan, 991-992.

*Corresponding author.