Journal of Geographic Information System
Vol.6 No.3(2014), Article ID:46926,17 pages
DOI:10.4236/jgis.2014.63024
On the Development of Spatial/Temporal Solar Radiation Maps: A Minas Gerais (Brazilian) Case Study
C. Tiba1, R. Reis e Reis2, J. C. E. da Costa3, J. F. Abreu2, Melina Amoni2, D. P. Guimarães4, M. A. D. Porto3
1Nuclear Energy Department, Federal University of Pernambuco, Recife, Brazil
2Programa de Pós-Graduação em Geografia, PUC, Belo Horizonte, Brazil
3Companhia Energética de Minas Gerais, Belo Horizonte, Brazil
4Embrapa Milho e Sorgo, Sete Lagoas, Brazil
Email: tiba@ufpe.br
Copyright © 2014 by authors and Scientific Research Publishing Inc.
This work is licensed under the Creative Commons Attribution International License (CC BY).
http://creativecommons.org/licenses/by/4.0/


Received 2 May 2014; revised 28 May 2014; accepted 5 June 2014
ABSTRACT
Appropriate information on solar resources is very important for a variety of technological areas, such as agriculture, meteorology, forestry engineering, and water resources, particularly for an innovative technology such as solar energy. In the market entry process of an innovative technology such as solar energy, the increased and sustained deployment of this energy technology strongly depends on the economy and reliability of the solar systems installed. The economy and reliability of a system are the consequences of a well-prepared project, resulting from an accurate knowledge of the solar resource available. Therefore, knowing the potential of the solar resource accurately is not only a need but also an imperative for the larger diffusion and use of the solar energy. The existing sources of the information on radiation in MG are quite varied, both at the institutional level and in different types of publications. The publications containing this information are project reports, internal reports of institutions, and several magazines. Thus, the quality of the data varies considerably, the information presents spatial and temporal discontinuity; moreover, the instruments and the measurement units are not standardised. The general objective of this paper is to recover, to qualify, to standardize, and to make available the best information from the current existing solar resource in MG, Brazil, either in the form of isoline charts of solar radiation or a numerical database. In this paper, the procedure to elaborate the maps of daily solar radiation and insolation, along with the monthly and annual averages, is described. We present one map with the localisation of the recording stations in addition to one annual and 12 monthly contour maps. The map of the daily global solar irradiation and the annual average determined in this project show that solar radiation on the state of Minas Gerais ranges from 4.5 to 6.5 kWh/m2. The maximum values occur in the northern region of Minas Gerais, and the minimum values occur in the southeast region, where there are areas of higher altitude (Mantiqueira and Serra do Caparaó) and the rainfall is more intense, with total annual rainfall greater than 1400 mm. The North and Northeast Regions of MG, where the largest annual irradiation of 6.5 kWh/m2 occurs, are characterised by a semiarid climate with annual rainfall between 600 - 800 mm and altitudes between 400 - 600 m. The maritime tropical air mass that acts between Brazil and Africa is the main climatic factor that inhibits cloud formation and, consequently, the rainfall in this region. Finally, the map of annual insolation reveals a consistent correlation between the daily rainfall and the solar radiation annual average.
Keywords:Solar Energy, Solar Irradiation Map, Solar Resource Assessment, Methodology for Mapping

1. Introduction
The knowledge of the solar resource is important for increasing the production and promoting the widespread use of solar energy for energy purposes. The accuracy of spatial or temporal solar irradiation knowledge enables us to add reliability (lower risk) and quality to the solar systems, which are reflected in the costs of the energy generated. The solar resource is required for the project of solar systems in three main aspects: 1) Sitting study of the solar power plants (sitting); 2) Prediction of the annual, monthly, or daily production of the energy generated; and 3) Solar irradiation forecasting and operational strategies.
In the sitting studies of large solar power plants, amongst others, the following variables are considered: solar resource (direct or global, depending on the solar technology used: fixed or with concentration), availability of land that can be utilised in a non-confrontational way (agricultural land, reserves or national parks, Indian reservations are excluded), proximity of access routes for transporting delicate or large equipment (mirrors), local availability of good-quality water, and the proximity of transmission lines. Individually, the knowledge of the solar resource is the major variable in the uncertainties associated with a solar energy system project.
The prediction of the annual energy production, which is made considering the inter-annual stochastic variability of solar radiation, is crucial for calculating the cost of the energy generated and directly affects the economic viability of the enterprise. The seasonal calculations are important to trace the operational and integration strategies of the energy system, e.g., the complementarily of wind energy and solar energy with hydropower of the San Francisco River Basin. On a shorter time scale (hours), wind energy and hydropower subsidize strategies of storage systems. After the construction of the solar plant, the stage of commissioning and acceptance of the plant requires operational testing (at least of short duration) to verify that the plant is within the specifications and parameters of the project and to infer the annual energy production. During the lifetime of the plant, the solar radiation should be monitored continuously and its performance should be calculated simultaneously to detect possible performance drops due to component aging (loss of reflectivity in the reflecting mirrors, vacuum in the collecting ducts, or the depletion of the protective layer of photovoltaic cells) or the need for cleaning (washing the mirror surface or PV module).
Minas Gerais is the fourth unit of the federation in territorial extension, with an area of 586,528 km2, which corresponds to 7% of the territory of the country. The state is located between the parallels 14˚13'58'' and 22˚54'00'' south latitude and the meridians 39˚51'32'' and 51˚02'35'' west of Greenwich. Its positioning in relation to Brazil is shown in Figure 1.
Data from the Demographic Census [1] reveal that the population of Minas Gerais in 2010 was 19,597,330, of which 16,715,216 people lived in the urban area and 2,882,114 in the countryside. Thus, the degree of urbanization of Minas Gerais was 85.29% in 2010. The state population consisted of 9,641,877 men and 9,955,453 women.
Currently, Minas Gerais has 318 enterprises of electricity generation in operation, generating 19,221,480 kW of power. In the coming years, the state will have an additional 1,435,795 kW in generation capacity as a result of 12 projects currently under construction, and 72 more projects have been granted. Table 1 and Table 2 shows the number and power, respectively, of the CGH (Central Hydroelectric Generator), SHP (Small Hydro), HPP (Hydro Power Plant), and TPP (Thermal Power Plant) in operation and under construction in the state of Minas
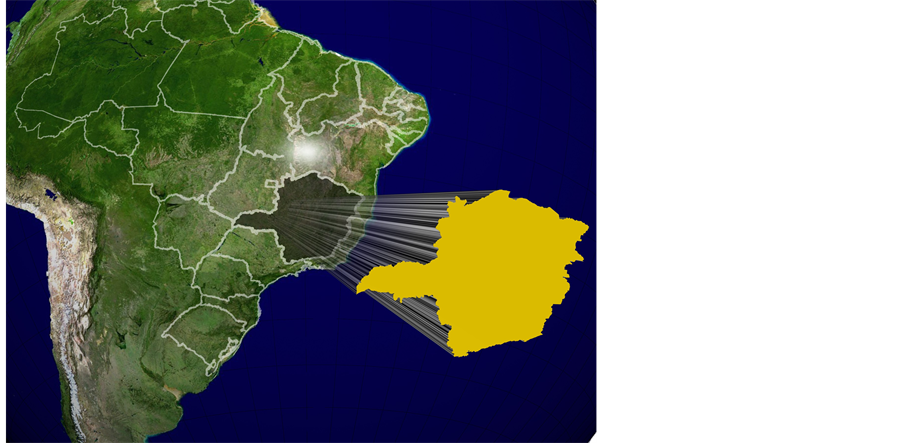
Figure 1 . Location of the state of Minas Gerais in Brazil. Source: Landsat 7
Itemized MRI cost.
aSource: ANEEL, 2011.
Gerais. Moreover, the state has a wind and a solar power plant that will be installed in Sete Lagoas.
CEMIG, as the main state concessionaire, distributes power to 805 of the 853 Minas Gerais Municipalities, which represents managing a distribution network larger than 400 thousand km in length that is considered the largest in Latin America.
2. Methodology
2.1. Mapping Process
The flowchart for the preparation of solar irradiation and insolation maps for the state of Minas Gerais are shown in Figure 2.
The phases of data collection and search and data analysis and systematization were the most arduous of the project. The work consisted of the collection, location, and search for publications containing radiation data, insolation solarimetric maps, climatological maps, and phytogeographic information of Minas Gerais and neigh-
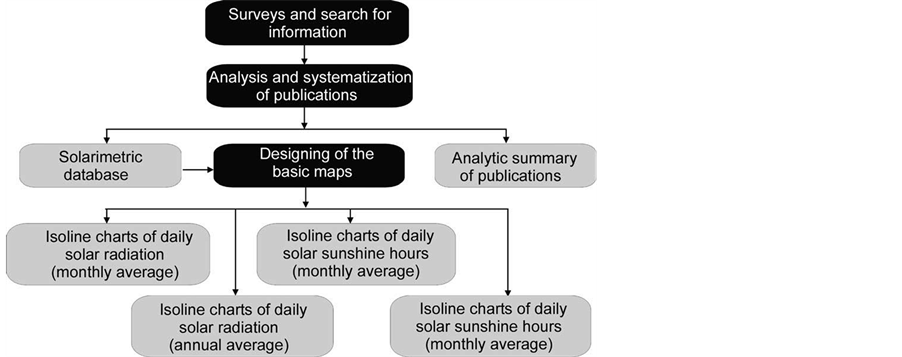
Figure 2. Flowchart for the elaboration of maps of solar radiation and insolation. Source: Solarimetric Atlas of Brazil (2001).
bouring states. Such information was dispersed geographically, temporally, and institutionally in places such as the Department of Agriculture, Meteorological Districts, Universities, and Energy institutions, amongst others. Because of the need of the greatest spatial and temporal coverage, databases with information obtained from sensors of different accuracy classes of different spatial coverage and different measurement periods were considered, analysed, and made consistent. Such information was organised to form a database.
Then, information about the insolation maps, the global solar radiation and other meteorological variables were spatially interpolated and visualised through maps. Twelve monthly maps, an annual map, and another map with the location of the measurement stations were created.
2.2. Collection and Assessment of the Solarimetric Data
The main criteria for the assessment of solarimetric data were: the quality of the sensors, the measurement periods, and the spatial distribution of the measurements.
2.2.1. Qualification of the Sensors
The Campbell - Stokes type heliographs, Figure 3, produce information about the daily insolation. In these devices, the convergence of the solar rays on a strip of paper burns throughout the day, and the length of the burn is used to quantify the sun shining hours. The burning occurs when the direct solar radiation exceeds a variable threshold from 100 to 200 W/m2, which depends on the geographical location of the equipment, on the climate, and on the type of paper strip used to perform the recording. When the equipment is installed properly, with the use of an appropriate paper strip, the threshold is equal to 120 W/m2. By using simple correlations with the appropriate coefficients, the historical series of insolation can be used to estimate daily, monthly, or annual solar radiation rate, with minimum errors of approximately 10%.
The pyranometers are devices intended to measure the global and diffuse solar radiation. There are different types of pyranometers, but here, only the thermoelectric and photovoltaic pyranometers are considered, as shown in Figure 4(a) and Figure 4(b), because most of the equipment installed in Brazil are of these types. The sensitive element of a thermoelectric pyranometer is a thermoelectric battery (set of thermocouples connected in series). The hot junction of thermopile is in contact with the surface of a detector (surface exposed to solar radiation). The photovoltaic pyranometer uses a photodiode as a sensor; however, those are less accurate in addition to having a limited spectral response (400 - 1100 nm). The pyranometers are classified into various classes, as presented in Table 3. The vast majority of instruments used for field measurements in Brazil are of the second class (Photovoltaic sensor).
These pyranometers attached to electronics integrators perform measurements of the daily global solar radiation with the errors described in Table 4; all the maintenance and periodical calibration procedures (at least once a year) are followed.

Figure 3. Campbell—Type Stokes Heliograph. Source: Solarimetric Atlas of Brazil (2001).
 (a)
(a) (b)
(b)
2.2.2. Measurement Period
A central problem associated with the solar resource assessment consists of estimating the smallest number of years necessary to obtain a reliable estimate of the solar radiation in a specific place. Studies performed [2] with the purpose of using insolation measures (sunshine hours) to determine the global solar radiation using the Angstrom relation have estimated the number of necessary years for a reliable determination of the solar resource.
The authors concluded that a 14-year period enables a daily series to be statistically stable not only for insolation data and its conversion to radiation but also for other meteorological variables. In other words, for periods longer than 14 years, it is believed that the observed variability, in this case of the solar resource, is due exclusively to its intrinsic statistical nature, regardless of the sample size. Obviously, in geographic regions of strongly variable climatology, this consideration is not valid.
2.2.3. Spatial Distribution of the Measures
Generally speaking, the solarimetric information, even the most abundant information, such as the daily insolation, does not satisfy all of the requirements of its users, due to the low density of the station nets. Recent studies on the spatial variability of the solar resource in homogeneous phytogeographic regions indicate that the global daily radiation and the monthly average can be extrapolated out to 200 km of distance with errors of 15%, with a confidence level of 90% [3] .
In geographic regions with a strongly variable topography, such as mountains and large water mirrors (the coast), the cited extrapolation is not valid. The theme of the spatial extrapolation of solar radiation is not yet sufficiently studied due to the lack of good quality data and the small numbers of the sites measured.
2.2.4. Angstrom Relation
The relationship between the monthly averages of the daily insolation and the daily global solar radiation is Table 3. Classification of the pyranometers sensors according to the WMOa.
aSource: WMO, 2010.
Table 4. Comparasion of daily solar radiation data, monthly averages for different locations in the world and Brazil.
known as the Angstrom Relation [4] . The correlation required modifications and is currently expressed in the following terms—Equation (1):
 (1)
(1)
where H and Ho are monthly averages of the daily global solar radiation and the daily global solar radiation in the top of the atmosphere, respectively; n and N are the monthly averages of the daily insolation and the astronomic duration of the day, respectively. There is a huge list of recent studies that seek to achieve better a and b regression coefficients, with the inclusion of non-linear terms or other variables, such as relative humidity (RH), rainfall water quantity, latitude, and solar height among others. The conclusion is that the improvement in the results achieved related to the Angstrom Relation is modest and insufficient to justify an increase in the complexity of the calculations.
2.2.5. Estimate Due to Satellite Images
An interesting alternative is the estimate performed based on satellite images because such images are able to cover a large spatial extension at a reasonable temporal extension. The use of this methodology would nevertheless need high quality terrestrial solarimetric stations for its calibration. In addition, beyond the issues the sensors installed in the satellites suffered from (decalibration in time), it would be necessary for an astronaut and associated equipment for its recalibration, which is normally not feasible due to its cost.
2.2.6. Qualification of Solarimetric Data Measured for One Locality
According to the before-mentioned comments regarding several aspects of solarimetric measures, the qualification of solarimetric data for a locality obeys the following hierarchy:
• Pyranometer data with first class sensors;
• Pyranometer data with second class sensors;
• Solar radiation estimates utilizing the Angstrom relation.
If there is information with equal equipment and unequal length of the time series, the longest prevails. Additionally, in this process, it is necessary to highlight the handmade character of the database qualification (always subject to temporal, spatial, or calibration failures, among others), in which the appreciation of a long experienced researcher in the theme is very important.
3. Identified Database
The following database were identified and recovered for the study in Minas Gerais:
• DB1—Global Solar Radiation database and other meteorological variables measured with automatic stations for the period of 2008 until the present date, on an hourly scale, measured by [5] ;
• DB2—Global Solar Radiation database and other meteorological variables measured with automatic stations for the period of 1993 until the present date, on a daily scale, measured by [5] ;
• DB3—Global Solar Radiation database and other meteorological variables measured with automatic stations for the period of 1998 until the present date, on a daily scale, measured by [6] ;
• DB4—Daily and Monthly Average Global Solar Radiation database measured with thermoelectric pyranometers for the period of 1984-1985 by [7] ;
• DB5—Daily Global Solar Radiation database, for the period of 1984-1985, without identification of the sensor by CEMIG;
• DB6—Daily Insolation, monthly average, measured with Campbell –Stokes heliographs in the period 1960-2010 [5] ;
• DB7—Brazilian Solarimetric Atlas [8] , with compilation of the terrestrial data until 1995 for the entire Brazil performed by CEPEL-UFPE-CHESF;
• DB8—Solar Radiation Atlas for Brazil estimated through satellite images by CPTEC in 2005 [9] .
4. Gridding and Contour Map
4.1. Gridding
Gridding is a method used to generate new data based on a discreet set of known data. These data, previously known, are gathered through data collecting or experimentation. In a more technical definition, it may be said that gridding is a type of curve adjustment that allows the determination of a function that represents the sample data, enabling an estimate of new data.
According to [10] a more geographic concept of gridding refers to the name given to the process of estimating the values of the attributes of determined locales based on the measures of other locales of the same region or area. This estimate of other points of an area in the sample is a mathematical process that depends on the quantity of the points in the sample and on the objective of the gridding. In this process, values obtained in certain points of the studied area are used, in which the points that are closer have a greater chance of having equal values than the points that are more distant from each other, according to the first Law of Geography, proposed by Waldo Tobler [11] . Hence, the diverse gridding methods use the information of certain points to calculate the neighbour points and arrive in an estimated continuous surface.
In this study, the “Kriging” gridding method was used. The “Kriging” gridding, also known as “krigagem” or “Gaussian Regression Process”, is a geostatistic method used to approximate or grid data. The “krigagem” can also be defined as a form of linear prediction or Bayesian inference. This method, which was used in the mining field, is also very powerful and was developed by the French mathematician Georges Matheron from its inventor works, the South African mine engineer Daniel G. Krige.
This technique assumes that the data in a certain population are correlated in space, that is, if in a point the weight or the mass is equal to x, it is very likely that there are results very close to x the closer you are to point p. It may be said that the “Krigagem” assumes that the variable that is being gridded is a regionalised one, that is, it has a certain degree of spatial correlation.
4.2. Contour Map
According to [12] , the process of generating the contour map, called contouring, is subject to the representation of a given surface, which is related to a set of data. The nature of these data may be topographic or any other data that represent the occurrence of a phenomenon in space. Contour maps are usually generated through the variation of a bivariate function that generates a continuous bare surface in three dimensions in space. In cases in which the function values are known only at some locations, gridding methods for estimating the behaviour of the phenomenon in a region [13] are used. Continuous surfaces can be represented by models of contour lines or grids, which can be regular or irregular [14] . The contour lines, called isolines or isopleths, are curvilinear lines traced by points of equal value. Although the data represented on the bare continuous surfaces may have three dimensions (two dimensions of location in space and one dimension representing the location attribute) they are represented in only two dimensions in the contour maps, as the third dimension is represented by colour or by isolines.
5. Filtering
Databases identified and recovered previously described were analysed and filtered. The filtering procedure includes the manual observation of the data and the conditions of the stations (over time) by experienced mining experts in meteorology. After the filtering procedures, the following data were selected for the preparation of maps of solar radiation and insolation:
• 49 stations of DB1 Database (INMET - 2008-2010), measured in hourly scale, as it is a recent and well-distributed network and, therefore, probably still calibrated;
• 31 stations of DB2 Database (INPE - 2008-2010) of global solar radiation and other meteorological variables measured with automatic stations for the period 2008-2010, by INPE. To increase the density of the considered stations and ensure spatial continuity with neighbouring states: 12 internal to MG and 19 in neighboring states;
• Six stations of DB3 Database (CEMIG - 2008-2010) of global solar radiation and other meteorological variables measured with automatic stations in a daily scale, measured by CEMIG, only one part, to the extent that the accumulated experience of some meteorologists were unreliable, for example due to the change of location.
• DB6 database (INMET - 1960 to 2010) of daily insolation, monthly average, measured with Campbell - Stokes heliographs in the period 1960-2010. Even with many flaws, especially in more recent times, it is the only one with such temporal and spatial scope.
The DB4 Database (CEMIG - 1984-1985) on daily global solar radiation data, monthly average, although data measured with thermoelectric pyranometers was discarded for the following reasons: age, short time series and relatively low spatial coverage.
Outliers were identified by means of training an artificial neural network to establish functional relations between the monthly radiations and spatial variables (latitude, longitude and altitude). Radiation data with an inter-annual variation above 15% were considered outliers. Hence, the original data were replaced by the estimated ones only if there were “outliers”.
Figure 5 shows the solarimetric stations used in the preparation of contour maps of solar radiation (top) and insolation (bottom).
6. General Criteria for Establishment of Maps
For preparation of solarimetric maps the following general criteria were followed:
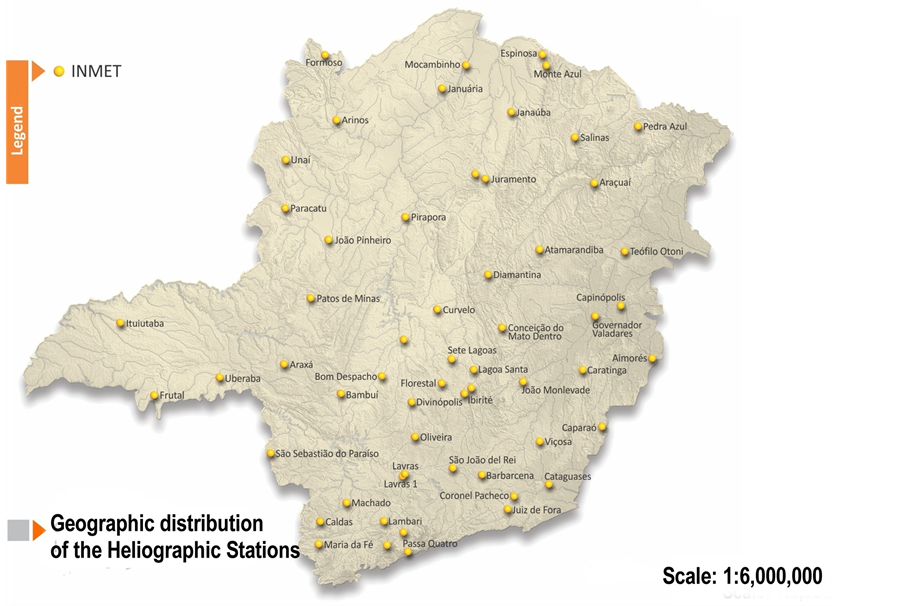
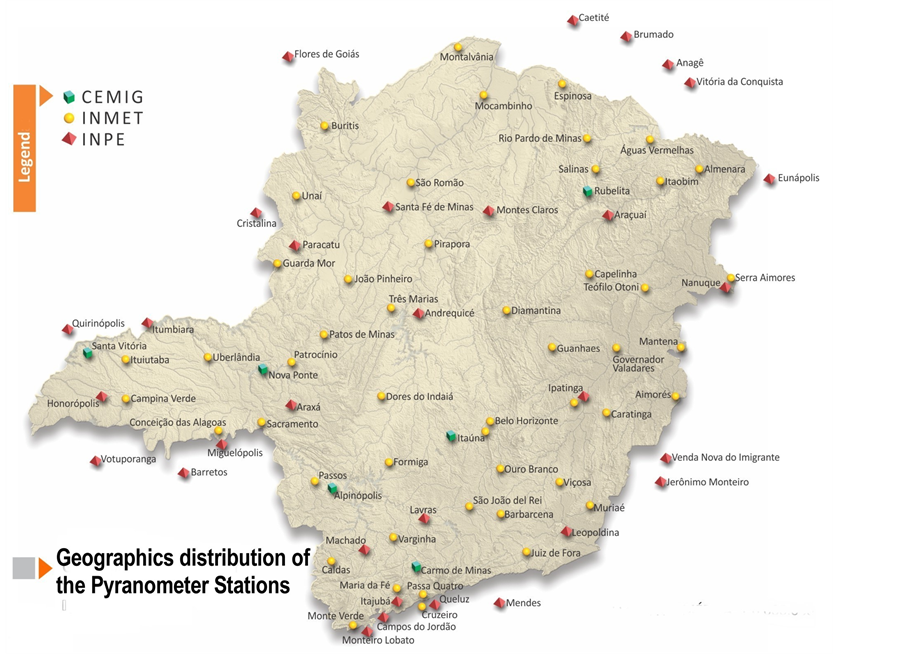
Figure 5. Location of solarimetric stations used in the preparation of contour maps of solar radiation (top) and insolation (bottom).
1) Considering that the errors associated with the photovoltaic pyranometers measures (sensors of second class as WMO) coupled to electronic integrators operating with calibration errors of 5% and drifts of 2% per year, and without recalibration records it is not unrealistic to admit an error of measuring field of the order of 10% - 15%. The lower rate is for a network with good maintenance and calibration on a frequency of 24 months.
2) Mean values of solar radiation obtained in neighbouring states were taken into account.
3) As a complementary support, the maps of the State of Minas Gerais rainfall and vegetation were used.
4) The values of daily global solar radiation, monthly and annual averages were expressed in kWh/m2.
5) Because the quality of insolation data obtained with the Campbell - Stokes type heliographs was not known, equal reliability for all was admitted “a priori”, considering an error not inferior to 15%.
As a consequence of the above considerations, the approximate value of 0.5 kWh/m2∙day was established as a proper spacing between successive isolines. This value corresponds to the instrumental error of 10%. Likewise, the spacing between isolines of insolation was fixed to 1.0 hour/day.
7. Results and Discussion
Isoline charts of the daily global solar radiation, monthly and annual averages, adequately describe the available data in MG. Considering the characteristics of existing information, these prepared charts constitute the most updated and best prepared set on the solar resource in Minas Gerais. The monthly solar radiation charts clearly showed, for each month, well differentiated and reasonably correlated regions with the rainfall conditions and corresponding insolation hours, as seen in Figures 6-8 for the daily solar radiation and hours of daily sunshine, annual average, and annual rainfall average, respectively.
The map of daily global solar radiation, annual average, Figure 6, elaborated in this project, shows that solar radiation on the state of Minas Gerais ranges from 4.5 to 6.5 kWh/m2. The maximum values occur in the northern region of Minas Gerais, and the minimum values occur in the Southeast, where there are areas of higher altitude (Mantiqueira and Serra do Caparaó) and intense rainfall, with total annual rainfall greater than 1400 mm (see Figure 8). The maritime tropical air mass which operates between Brazil and Africa is the main climatic factor that inhibits cloud formation and, consequently, the rainfall in these regions in the North and Northeast ones. The North and Northeast regions of Minas Gerais are characterised by a semi-arid climate with annual rainfall between 600 - 800 mm and altitudes between 400 - 600 m. The insolation map, Figure 7, is consistently correlated with rainfall and daily solar radiation, annual average.
The desert regions of the world are the regions with the highest solar resources. Thus, the region of the city of Dongola, located in the Arabian Desert, Sudan, and the region of Daggett in the Mojave Desert, California, United States, are examples of exceptionally well-served locations of solar radiation. For purposes of comparison, Table 4 presents the values of daily solar radiation, monthly, maximum, minimum, and annual averages for these two locations and some other localities in Brazil and particularly some of MG. As can be seen in this table, those locations in the Northwest MG (micro-regions of Pirapora, Januaria, Montes Claros and Janaúba), Figure 9, have values of daily solar radiation, on an annual average, comparable to the best regions in the world, such as Dagget. In addition, seasonal variations for the Northwest of MG are smaller, which may result in significant technical and economic advantages of solar systems installed in these regions.
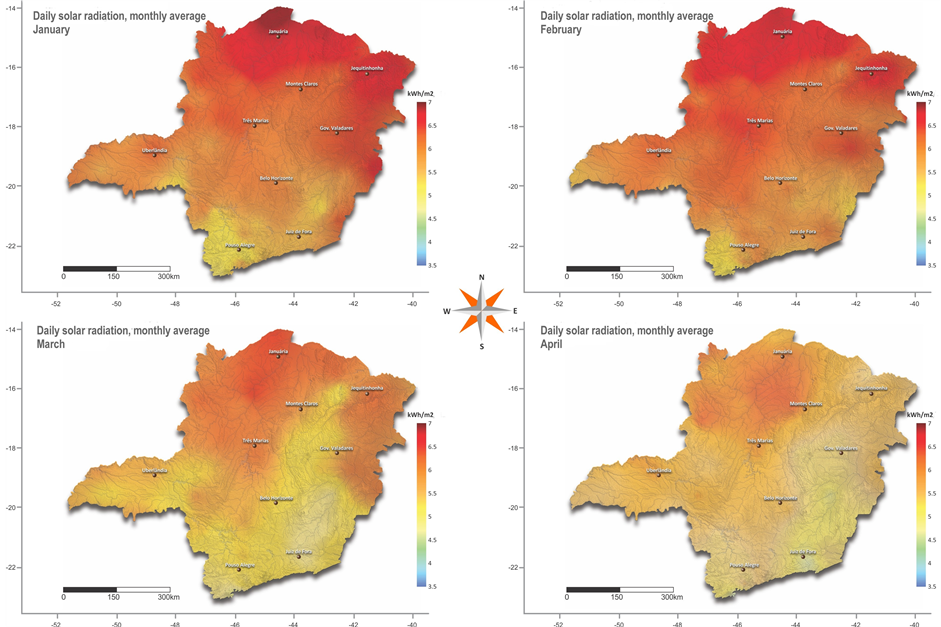
Charts of the daily global solar radiation, monthly averages, Figure 10, show that solar radiation in Minas Gerais varies between 3.0 to 7.5 kWh/m2, with a period of minimum irradiation in the trimester of May-JuneJuly, during which the solarimetric stations recorded the intensity of radiation to be in the range of 3 to 4 kWh/m2. Additionally, during this trimester, it is seen that that the maximum (5 kWh/m2) occurs over a vast region of the northwestern Minas Gerais. The trend of minimal (3 kWh/m2) occurs in the south and southeast (near Caparaó) of Minas Gerais. Yet, in the trimester December-January-February, it is observed that the solarimetric stations record very high radiation intensities, reaching a maximum value of 7.5 kWh/m2. During this period, the maximum of 7.5 kWh/m2 occurs in a small region of the Northwest of Minas Gerais, located in the north region of Januária.
Smaller but still significant (very good) values between 6.0 kWh/m2 and 7.0 kWh/m2 occur in a vast region located above the 18th parallel (upper half of Minas Gerais). It can also be deduced from the isolines of solar radiation charts that the lowest levels of cloudiness (highest solar radiation rates) are concentrated in the east and the Zona da Mata region, where the ocean circulation leaves the weather partially cloudy almost every day of the year.
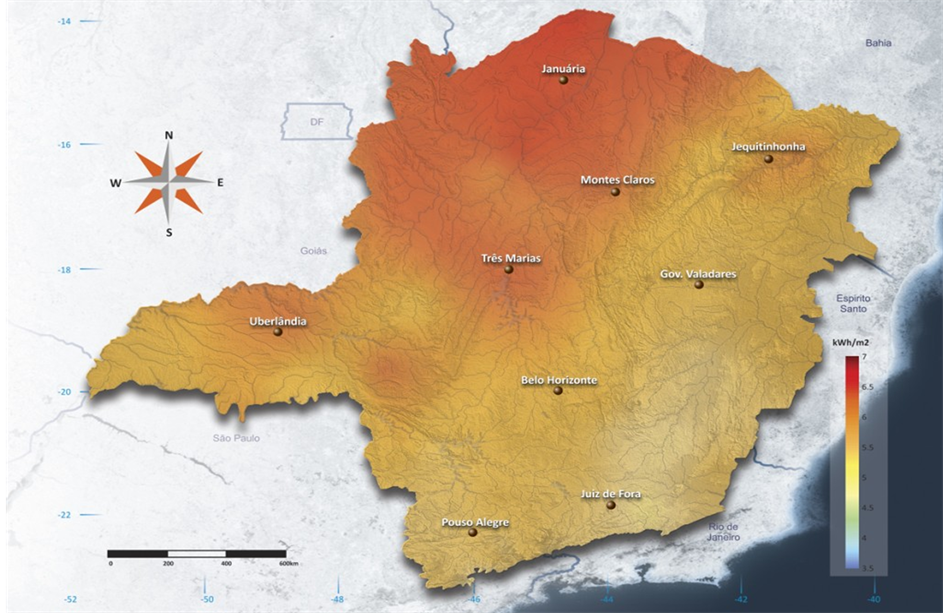
Figure 6. Global Daily Solar Radiation, annual average, for Minas Gerais.
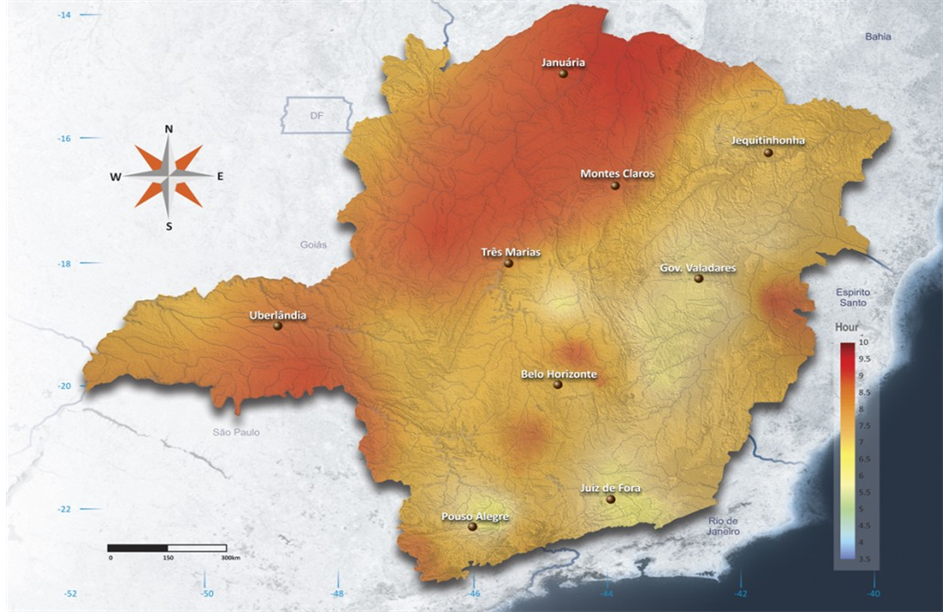
Figure 7. Daily Insolation, annual average, for Minas Gerais.
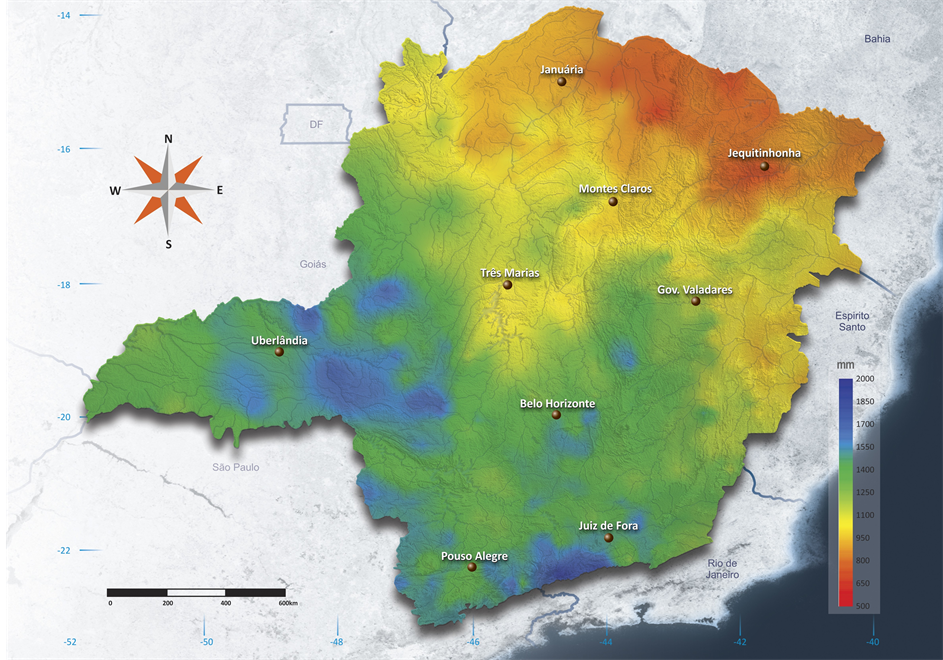
Figure 8. Annual Rainfall average for Minas Gerais.
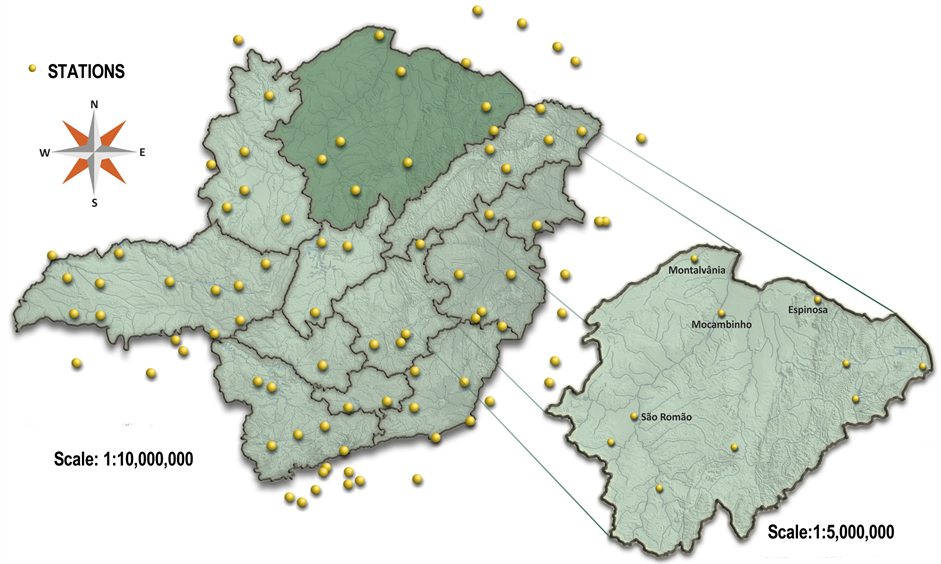
Figure 9. Location of measuring stations with bigger levels of solar radiation in the Northwest of Minas Gerais.
 (a)
(a)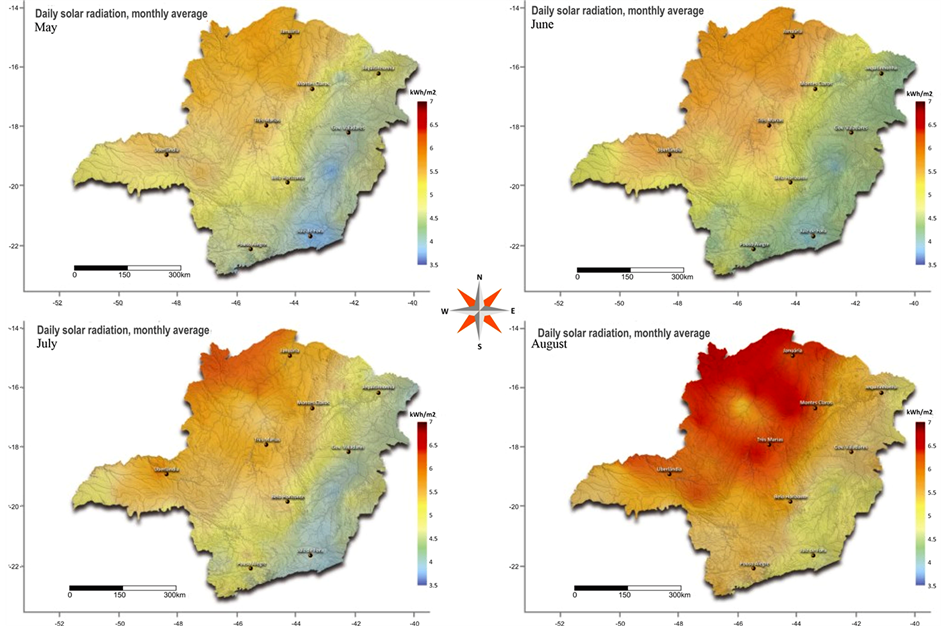 (b)
(b)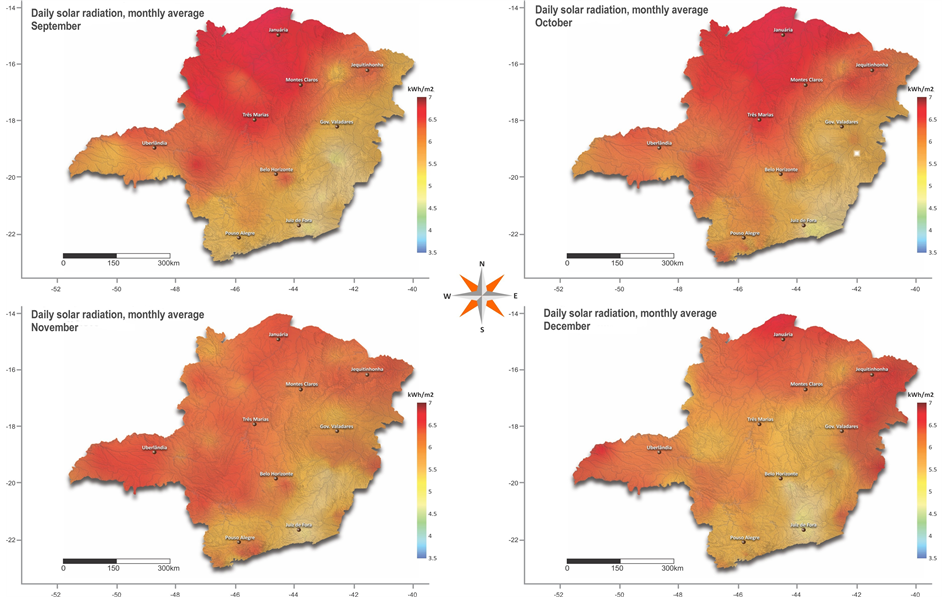 (c)
(c)
Figure 10. Daily solar radiation, monthly average for the state of Minas Gerais.
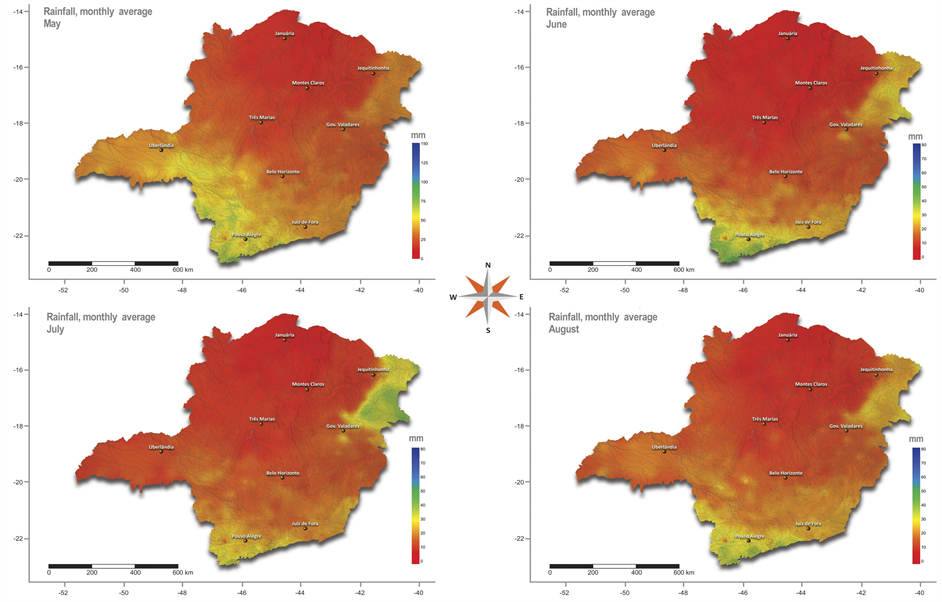
Figure 11. Seasonal rainfall (May-August), monthly average for the state of Minas Gerais.
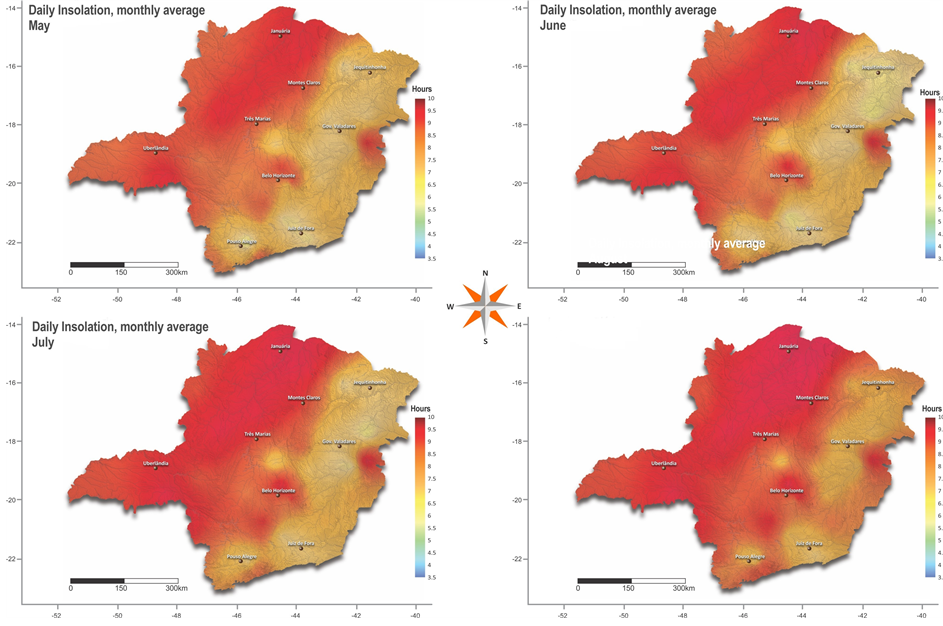
Figure 12. Seasonal insolation (May-August), monthly average for the state of Minas Gerais.
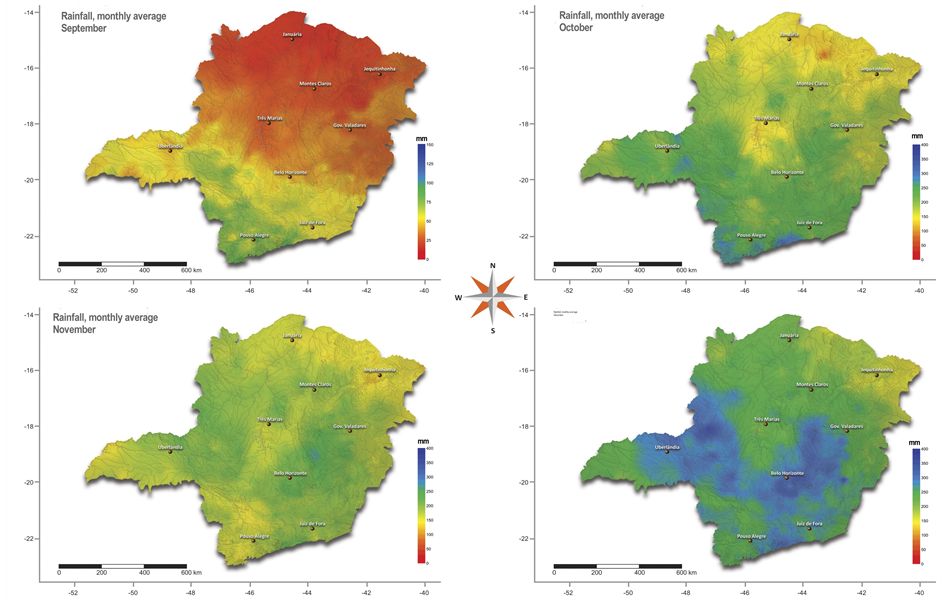
Figure 13. Seasonal rainfall (September to December), monthly average for the state of Minas Gerais.
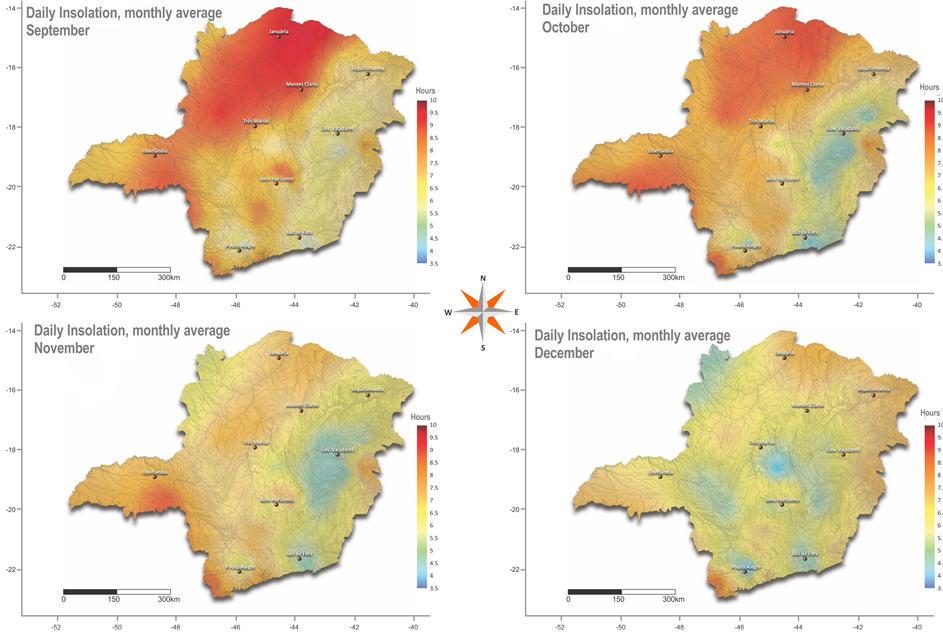
Figure 14. Insolation season (May-August), monthly average for the state of Minas Gerais.
Seasonal insolation maps are consistently correlated with rainfall. In winter (June to August), when the precipitation rate is the lowest of the year, Figure 11, the number of hours of sunlight reaches the maximum values between 8.5 to 9.5 h in a vast region of the eastern half the state of Minas Gerais, Figure 12. Conversely, for the period from November to January, there is an annual maximum rainfall, Figure 13, and therefore a minimum number of hours of sunlight, between 5.0 and 6.0 h per day, Figure 14.
Finally, the following very important aspects should be highlighted to users of the solar resource:
1) Charts of the spatial distribution of daily solar radiation represent only a first approximation of the field distribution of solar energy available at the surface (macro-spatial observation). For local information, one must resort to numerical measures of their solarimetric stations.
2) The isoline map of daily insolation and its eventual conversion to solar radiation could become valuable complementary information of the maps and database of solar radiation.
3) The siting to install a system or a set of solar systems through the use of radiation isoline maps built here (because the average value of the solar resource seems appropriate) has a preliminary indicative character that highlights the potential of the region. A final choice will require detailed measurements of the solar resource at the site as to determine its value and mainly its temporal variability.
Acknowledgements
To the CEMIG (Centrais Elétricas de Minas Gerais), ANEEL (Agência Nacional de Energia Elétrica) and National Research Council (CNPq), for the support in the solar energy research, particularly regarding the measurements, evaluation, and solar irradiation mapping.
References
- IBGE—Instituto Brasileiro de Geografia e Estatistica (2010) Pesquisa Nacional por Amostra de Domicilio (PNAD), Brasilia/DF.
- Vernich, L. and Zuanni, F. (1996) About the Minimum Number of the Years Required to Stabilize the Solar Irradiation Statistical Estimates. Solar Energy, 57, 445-447. http://dx.doi.org/10.1016/S0038-092X(96)00121-1
- Gallegos, H.G. and Lopardo,
R. (1988) Spatial Variability of the Global Solar Radiation Obtained by the Solarimetric
Network in the Argentine Pampa Humeda. Solar Energy, 40, 397-404.
http://dx.doi.org/10.1016/0038-092X(88)90094-1 - Angstrom, A. (1924) Solar and Terrestrial Radiation. Quarterly Journal of the Royal Meteorological Society, 50, 121-126. http://dx.doi.org/10.1002/qj.49705021008
- INMET—Instituto Nacional de Meteorologia (2010) Brasilia/DF, 1961-1990 e 2009-2010.
- INPE—Instituto Nacional de Pesquisas Espaciais (2010) Brasilia/DF, 2008-2010.
- CEMIG (1987) Estudos sobre Aproveitamento de Energias Solar e Eolica em Minas Gerais, Depto de Tecnologia de Engenharia, 01.000-TN/TE-093, Relatorio Tecnico de Projeto.
- Tiba, C., Grossi Gallegos, H., Fraidenraich, N.
and Lyra, F.J.M. (1999) On the Development of Spatial: Temporal Solar Radiation
Maps: A Brazilian Case Study. Renewable Energy, 18, 393-408.
http://dx.doi.org/10.1016/S0960-1481(98)00806-4 - Colle, S. and Pereira, E.B. (1998) Atlas de Irradiacao Solar do Brasil—Primeira versao para irradiacao global derivada de satelite e validada na superficie. Edicao. Florianopolis: LABSOLAR/NCTS, 79-104.
- Burrough, P.A. and Mcdonnell, R. (1998) Principles of Geographical Information Systems. Oxford University Press, New York, 333.
- Abreu, J.F. and Barroso, L.C. (2003) Geografia, modelos de analise espacial e GIS. Pontificia Universidade Catolica de Minas Gerais (PUC Minas), Belo Horizonte.
- Watson, D.F. (1992) Contouring: A Guide to the Analysis and Display of Spatial Data: With Programs on Disket. Pergamon, Oxford, 321.
- Tobler, W.R. (1979) Smooth Pycnophylactic Interpolation for Geographical Regions. Journal of the American Statistical Association, 74, 519-536. http://dx.doi.org/10.1080/01621459.1979.10481647
- Comber, A., Proctor, C. and Anthony, S. (2007). A Combined Pycnophylactic Dasymetric Method for Disaggregating Spatial Data: The Example of Agricultural Land Uuse. Proceedings of the Geographical Information Science Research UK Conference, National Centre for Geocomputation, National University of Ireland: Maynooth, 445-450.


