Natural Science
Vol. 5 No. 8 (2013) , Article ID: 35585 , 6 pages DOI:10.4236/ns.2013.58111
New proteins and protein species identified in human umbilical vein endothelial cells by Fourier transform ion cyclotron resonance-mass spectrometry
![]()
1Biochimie A, Hôpital Saint-Antoine, Pôle de Biologie Médicale et Pathologie, Hôpitaux Universitaires de l’Est Parisien (AP-HP), Paris, France; *Corresponding Author: bruno.baudin@sat.aphp.fr
2EA 4530, Université Paris-Sud, Châtenay-Malabry, France
3CNRS USR 3149, Spectrométrie de Masse Biologique et Protéomique, ESPCI-ParisTech, Paris, France
Copyright © 2013 Bruno Baudin et al. This is an open access article distributed under the Creative Commons Attribution License, which permits unrestricted use, distribution, and reproduction in any medium, provided the original work is properly cited.
Received 29 January 2013; revised 1 March 2013; accepted 8 March 2013
Keywords: Database; 2-DGE; Endothelium; HUVEC; FTICR; Tubulins
ABSTRACT
For many years, HUVEC.com1 public database provides biological data relative to the proteome of human umbilical vein endothelial cells (HUVECs), which are the most used human endothelial cell model in vascular biology. The proteins were identified using two-dimensional gel electrophoresis (2-DGE) for protein separation coupled with Matrix Assisted Laser Desorption-Ionization Mass Spectrometry (MALDI-TOFMS) for identification. We present here an important update of HUVEC.com with 521 protein identifications as determined using Fourier transformed ion cyclotron resonance-mass spectrometry (FTICR-MS) applied to an unstained 2-DGE gel cut in 221 squared pieces; each identified protein being accompanied by a semi-quantitative three dimensional visualization is called “score imaging”. The squared analyzed gel and the alphabetical list of identified proteins, linked with their corresponding three-dimensional score imaging, are available at www.huvec.com. This original approach led to the establishment of the most protein-rich and informative database for HUVECs, as well as to the identification of some protein species, in particular with phosphorylation.
1. INTRODUCTION
From 2004, HUVEC.com (www.huvec.com) shared a public database relative to human umbilical vein endothelial cells (HUVECs) proteome as assessed by the classical peptide mass fingerprinting approach combining two-dimensional gel electrophoresis (2-DGE) and Matrix Assisted Laser Desorption-Ionization Mass Spectrometry (MALDI-TOF-MS) [1]. More than 160 identifications were obtained corresponding to the major Coomassie-stained proteins separated under standard 2-DGE conditions [2,3]. Although encountering a good audience with more than 100,000 visits till September 2012, HUVEC.com database now appears as notably insufficient especially because of being restricted to a relatively low number of major, mainly soluble endothelial proteins. In the goal to further enrich HUVEC.com, we used Fourier transformed ion cyclotron resonance-mass spectrometry (FTICR-MS) applied to an unstained 2-DGE gel cut in 221 equal rectangles to avoid the relatively poor sensitivity and the spot overlapping inherent to 2-DGE with classical staining [4,5]. This study also allowed for identifying some protein species in HUVECs, such as heat-shock proteins and proteins from the cytoskeleton.
2. MATERIALS AND METHODS
2.1. HUVEC Culture
We used primo-cultures of HUVECS, obtained as previously described in details [6]. In particular, cells were scrapped two days after confluency, as assessed under phase contrast microscopy, and dissolved in buffer with Triton X-100.
2.2. Two-Dimensional Gel Electrophoresis (2-DGE)
Two identical gels were prepared as previously described [2] with 60 µg of proteins from HUVECs. The first control gel was stained successively with Colloidal Coomassie Blue (CCB) and silver nitrate, for protein localization in 2-D gel. The second gel was cut in 221 equal rectangles without staining for protein identification by mass spectrometry.
2.3. In-Gel Trypsin Digestion
The proteins of every unstained rectangle (0.5 mm × 6 mm × 10.5 mm, volume 31 µL) were in-gel proteolyzed [7]. After reduction (10 mM dithiothreitol, 100 mM NH4HCO3 for 45 min at 56˚C), and alkylation (55 mM iodoacetamide, 100 mM NH4HCO3 for 30 min in the dark) of the proteins, the gel pieces were rehydrated for 45 min at 4˚C in 50 mM NH4HCO3, 5 mM CaCl2 and 12.5 ng/µL of trypsin (Roche, Mannheim, Germany; sequencing grade, EC 3.4.21.4). Excess protease solution was removed and the volume was adjusted with 25 mM NH4HCO3 to cover the gel pieces. After trypsin digestion (2 hours at 37˚C), the resulting peptide mixtures were extracted by incubation in 1% formic acid (FA) and analyzed by nano Liquid Chromatography (nanoLC) Electrospray Ionization (ESI) Fourier transformed ion cyclotron resonance-tandem mass spectrometry (nanoLC ESI-FTICR-MS/MS).
2.4. Automated NanoLC ESI-FTICR-MS/MS
A nano-scale capillary LC system (Ultimate 3000 Dionex, LC-Packings, The Netherlands) was used on line with a hybrid nanoESI Linear Ion Trap (LIT) FTICR mass spectrometer (LTQ-FT, Thermo Scientific, USA) using aqueous (buffer A: H2O/acetonitrile/formic acid, 98/2/0.1, v/v/v) and organic buffers (buffer B: H2O/acetonitrile/formic acid, 10/90/0.1, v/v/v). Chromatographic separations were conducted on a reverse phase capillary column (Atlantis dC18, 75 µm id., 15 cm length, Waters, UK) with a 220 nL/min flow rate. The gradient profile consisted of two linear gradients from 0 to 20% B in 10 min and from 20% B to 60% B in 35 min. Data were acquired in automatic mode as described [8] and were processed using Bioworks 3.1 cluster version software (ThermoElectron Corporation, USA). Database search was run against SwissProt from UniProtKB release 5.5 (181,571 entries) not indexed, on any taxonomy, for tryptic peptides with up to 2 miscleavages, and carbamidomethylation of cysteins (+57.022 uma) and methionin oxidation (+15.995 uma) variable modifications. Protein identifications were validated only for human and if at least 2 different sequences (in doubly and/or triply charge state) were identified as first candidates in the protein according to the published standards [9]. Mass accuracy tolerance was set to 0.01 Da in MS mode and to 0.5 Da in MS/MS mode, which was the minimal value allowed in the used software version.
2.5. Establishment of the 3D Virtual Gel and Score Imaging
In SequesTM, peptide “hits” are sorted in five subsets according to the identification rank of each peptide for a given protein. The consensus score is calculated by multiplying the first entry in the “hits” column by 10, the second entry by 8, the third by 6, the fourth by 4, and the fifth by 2, and then summing these values. To distinguish between equivalent consensus scores, the decimal number (0.1, 0.2, or 0.3) is a weighting which is calculated by dividing by 20 the top Xcorr score of the peptides and adding it to the consensus score. For example, a protein can be identified by one top hit or five 4th best hits with the same consensus score. The weighting puts the one with a top hit above the others. However with our validation criteria, the later would not be validated with five 4th hits only. SequestTM consensus score could be correlated to the relative protein abundance in the sample, according to Gao’s peptide hits technique [10-12].
For each protein identified according to the previous criteria, the values of the corresponding consensus score were stored in a matrix representing the gel (13 rows and 17 columns). The localization of the protein in the gel was visualized by a 3D representation of the matrix (x-axis for the pI, y-axis for molecular weight, z-axis for the consensus score). A linear scale for consensus scores enhanced the major focalization spot(s) for each protein in the gel. In some cases, the gel was mapped using logarithmic scale to enhance the lower scores.
3. RESULTS AND DISCUSSION
Two identical gels were prepared: the first gel (or control gel) was stained successively with CCB then with silver nitrate (not shown); the second gel was cut in 221 equal rectangles without staining, the resulting grid pattern being matched against the stained control gel (Figure 1). After in-gel trypsin digestion of each rectangle, their respective protein content was analyzed using nanoLC ESI-FTICR-MS/MS. Using stringent thresholds filters, i.e. at least two different peptide sequences with Xcorr and DeltaCn of 2.5 and 0.1 respectively [13], 521 distinct proteins were unambiguously identified (alphabetical list of identified proteins available at www.huvec.com). Furthermore, each identified protein could be individually visualized on a grid 2-D gel according to a “score imaging” deduced from rectangle locali-
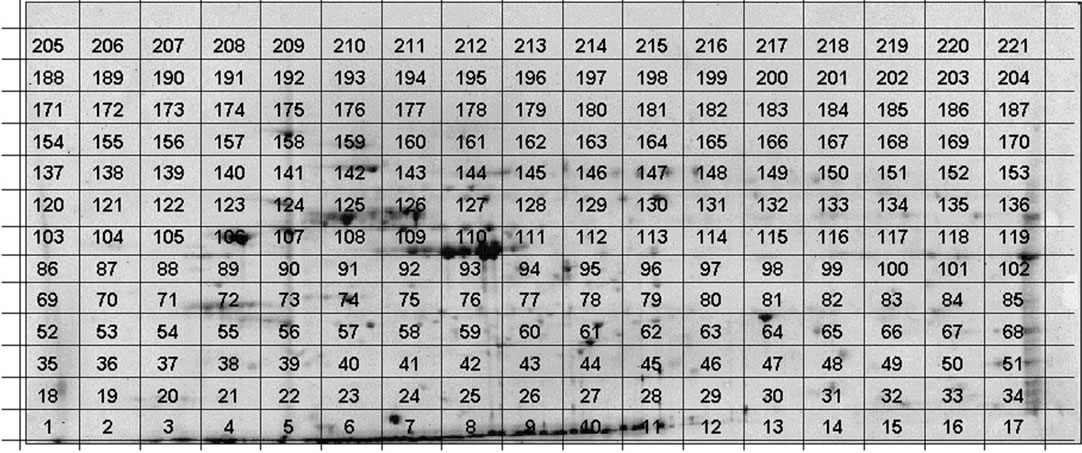
Figure 1. CCB stained 2-D pattern of proteins (60 μg) from quiescent HUVECs in the pH range 4.0 to 7.0 (left to right) with Mr ranging from 10 Da to 120 kDa. Superimposed is the grid representing the unstained “twin” gel cut in 221 regular rectangles.
zation (xand y-axis) and corresponding consensus scores from SequestTM database search (z-axis).
This approach permitted relatively accurate protein location due to rectangle dimensions (~6.0 × 10.5 mm). Furthermore, in absence of any interferences related to the coloration process, it allowed protein detection with a high level of sensitivity. For example, while 5 spots were detected using silver nitrate in rectangle #118, 22 proteins were identified using our approach corroborating the ability of FTICR-MS for the identification of proteins in very low amounts.
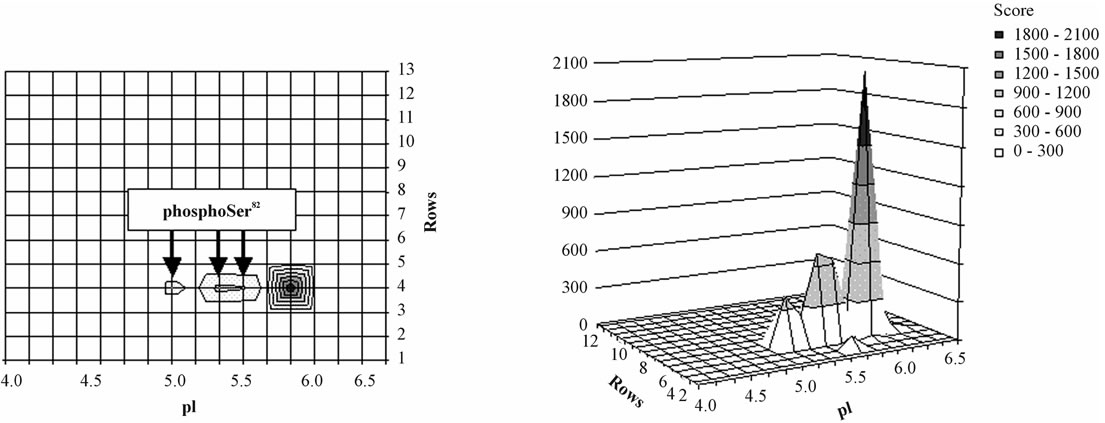
It has been shown that SequestTM peptide hits and by extension the associated identification consensus scores resulting from LC-MS analysis could be used for labelfree relative protein quantification [14]. Thus, although not giving a relative quantification between different proteins, the score imaging could provide a pattern of the relative abundance of a given protein in each area of the gel. To illustrate this point, we focused on the 27 kDa mammalian heat shock protein (HSP27) whose score imaging data are presented in Figure 2. Using a linear scale for SequestTM consensus score, three major spots corresponding to phosphorylation isoforms were visible at pI 5.2, 5.6 and 6.0 (Figure 2(a) and three-dimensional Figure 2(b)) in agreement with published proteomic data relative to HSP27 phosphorylation isoforms [2,15]. When switching to a logarithmic scale (Figure 2(c)), HSP27 was shown to be detected all over the area between pI 5.1 and 6.3.
In the field of spot overlapping and protein background, since each protein identification was considered individually, the corresponding score imaging could not theoretically be “contaminated” by other proteins. Nevertheless, the example of rectangle #110, in which only two major actin isoforms have been detected in this wellknown “overcrowded” 2-D gel area, strongly suggests that ion suppression effects [16] could have arisen in some rectangles notably where particularly abundant proteins were present. Further, when considering individually an abundant protein such as actin, tubulin or vimentin, it appears that the high sensitivity of the method could allow its detection/identification in highly numerous adjacent rectangles (covering up to ~ 75% of the gel area for actin) probably dealing with 1) insufficient isoelectric focusing (horizontal streaks) and insufficient SDS protein loading (vertical streaks) during 2-DGE [17] and 2), with protein complexes and fragments (vertical streaks; isolated “spots”) or protein isoforms (+/− horizontal streaks). Concerning isoforms, it should nevertheless be noted that the presented method, by sequencing specific peptides, was able to identify various complex and intricate isoforms as illustrated in Figure 3 for some tubulin β isoforms.
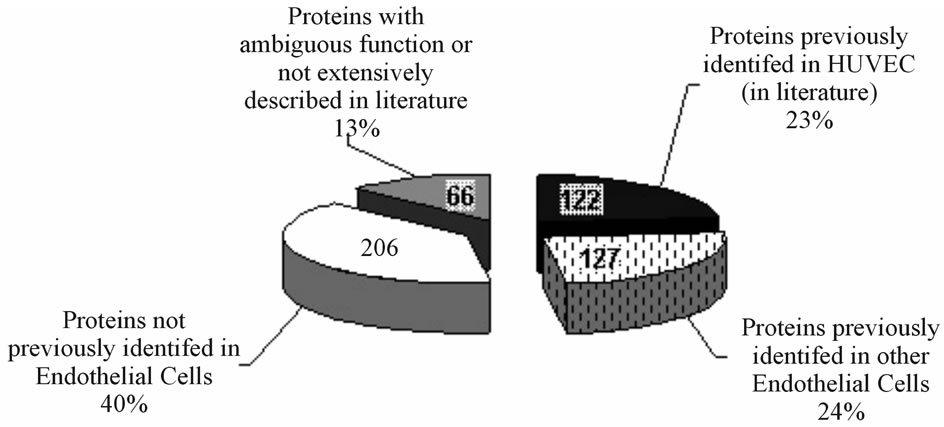
In biological terms, among the 521 proteins identified, FTICR-MS allowed to unveil a lot of proteins not yet known in HUVECs nor in other endothelial cells (ECs), and for many of them at low cellular concentration. As shown in Figure 4, 122 proteins (23%) were previously identified in HUVECs, 127 (24%) were identified only in other ECs, 206 proteins (40%) were not previously identified in HUVECs nor in other ECs and 66 (13%) possessed ambiguous or uncharacterized biological function. Furthermore, the identified proteins could be sorted into eight general categories i.e. sugar metabolism (37 proteins, 7%), mitochondria and lipid metabolism (30 proteins, 6%), amino acid and vitamin metabolism (41 proteins, 8%), cytoskeleton and organelles (160 proteins, 30%), replication and protein biosynthesis (129 proteins, 25%), detoxification and anti-oxidant defenses (25 proteins, 5%), membrane receptors, channels and transduction (67 proteins, 13%) and lastly, proliferation, cancer and apoptosis category (32 proteins, 6%).
 (a)
(a)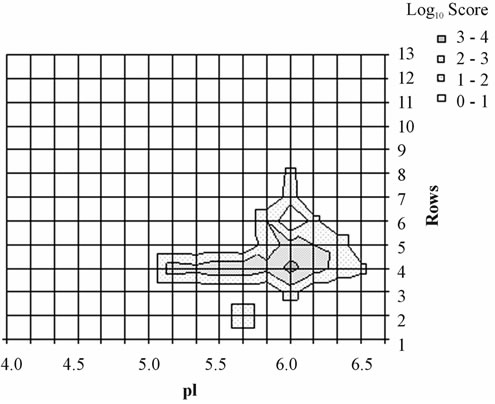 (b)
(b)
Figure 2. Distribution of HSP27 isoforms in the 2-D gel. For each rectangle where the identification was validated, HSP27 isoforms were localized according to their respective pI value in the center of the rectangle (y-axis) and to the corresponding row number along the Mr scale (x-axis); relative quantification was appreciated according to respective SequestTM consensus score value (z-axis). The phosphorylation site in the sequence 80QLpSSGVSEIR90 was detected in the rectangles 59, 61 and 62 (arrows) corresponding to the apex of the 2 acidic isoforms. This representation was obtained using a linear score scale (Figures (a) and (b)) or a logarithmic score scale (Figure (c)), the latter allowing to underline the lowest scores.
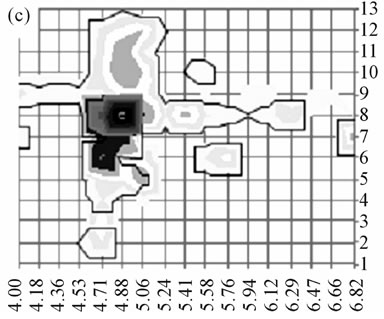
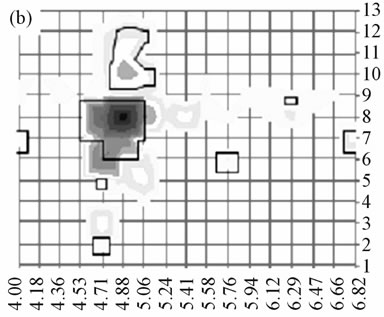
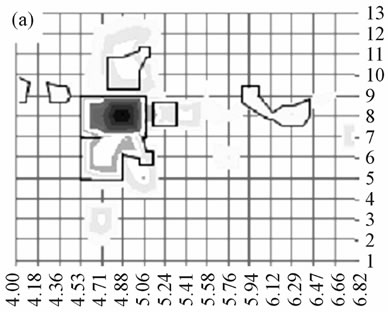
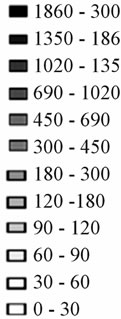
Figure 3. Distribution of some tubulin β isoforms. (a) tubulin β2A/β2B, (b) tubulin β2C, (c) tubulin β5 as identified by Sequest and imaged here as described in Figure 2. On each distribution, a solid line surrounds the area of the gel where β2A/B, β2C and β5 were respectively identified with specific peptides. Despite a very high degree of sequence homology between β2 isoforms (429/445 residues are identical), specific peptides from tubulin β2A/B and from tubulin β2C allowed to differentiate their respective localizations. Tubulin β2B has no specific peptide; however peptides specific to both isoforms β2A/B (99% homology, 443/445 common residues) allow differentiating isoforms β2A/B from isoform β2C (96% homology, 429/445 common residues).The tubulin β5 sequence (444 residues) shares 433 residues with β2C (97% homology) and 424 residues with β2B (95% homology). Three β5 specific peptides among the four theoretical ones were detected and used. In comparison, 27 peptides (specific or not) could be matched to β5 in rectangle 125 (tubulin most intense spot).
 (a)
(a)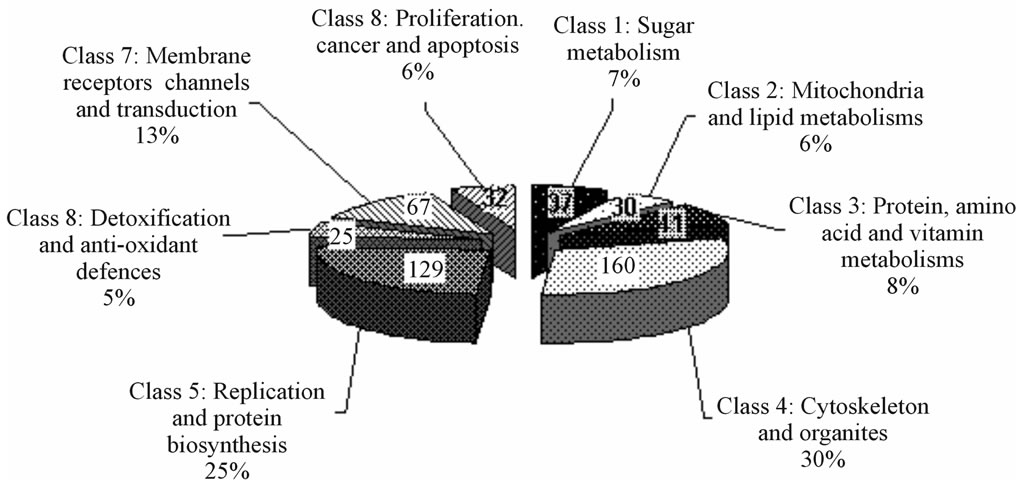 (b)
(b)
Figure 4. Drawing showing the % distribution of identified proteins (corresponding absolute numbers are indicated on each part). Classification is based according to the studied models where these proteins have been described i.e. HUVECs, ECs or not ECs (in a), and upon their biological functions (in b), as reported in the literature. Only 23% of the proteins have been already described in HUVECs and 40% of the proteins identified were never described in ECs.
4. CONCLUSION
The presented 2-DGE/FTICR-MS-based method constitutes an original, sensitive, and semi-quantitative alternative to classical 2-DGE staining for the establishment of protein databases. When applied to HUVECs, i.e. the most popular endothelial cell model in humans, it allowed to unambiguously identify and further localized on a 2-D gel 521 endothelial proteins representing to date the most protein-rich and informative database for HUVECs. The grid 2-D gel with links to identified proteins and related score imaging, as well as the alphabetical list of identified proteins (also linked with score imaging), are freely available at www.huvec.com.
5. ACKNOWLEDGEMENTS
Financial support from the TGE FT-ICR for conducting the research is gratefully acknowledged.
![]()
![]()
REFERENCES
- Pernet, P., Bruneel, A., Baudin, B. and Vaubourdolle, M. (2006) PHProteomicDB: A module for two-dimensional gel electrophoresis database creation on personal web sites. Genomics Proteomics and Bioinformatics, 4, 134- 136. doi:10.1016/S1672-0229(06)60024-7
- Bruneel, A., Labas, V., Mailloux, A., Sharma, S., Vinh, J., Vaubourdolle, M. and Baudin, B. (2003) Proteomic study of human umbilical vein endothelial cells in culture. Proteomics, 3, 714-723. doi:10.1002/pmic.200300409
- Bruneel, A., Labas, V., Mailloux, A., Sharma, S., Royer, N., Vinh, J., Pernet, P., Vaubourdolle, M. and Baudin, B. (2005) Proteomics of human umbilical vein endothelial cells applied to etoposide-induced apoptosis. Proteomics, 5, 3876-3884. doi:10.1002/pmic.200401239
- Rabilloud, T. (2002) Two-dimensional gel electrophoresis in proteomics: Old, old fashioned, but it still climbs up the mountains. Proteomics, 2, 3-10. doi:10.1002/1615-9861(200201)2:1<3::AID-PROT3>3.0.CO;2-R
- Campostrini, N., Areces, L.B., Rappsilber, J., Pietrogrande, M.C., Dondi, F., Pastorino, F., Ponzoni, M. and Righetti, P.G. (2005) Spot overlapping in two-dimensional maps: A serious problem ignored for much too long. Proteomics, 5, 2385-2395. doi:10.1002/pmic.200401253
- Baudin, B., Bruneel, A., Bosselut, N. and Vaubourdolle, M. (2007) A protocol for isolation and culture of human umbilical vein endothelial cells. Nature Protocols, 2, 481- 485. doi:10.1038/nprot.2007.54
- Shevchenko, A., Wilm, M., Vorm, O. and Mann, M. (1996) Mass spectrometric sequencing of proteins in silver-stained polyacrylamide gels. Analytical Chemistry, 68, 850-858. doi:10.1021/ac950914h
- Olsen, J.V., Ong, S.E. and Mann, M. (2004) Trypsin cleaves exclusively C-terminal to arginine and lysine residues. Molecular and Cellular Proteomics, 3, 608-614. doi:10.1074/mcp.T400003-MCP200
- Kapp, E.A., Schutz, F., Connolly, L.M., Chakel, J.A., Meza, J.E., Miller, C.A., Fenyo, D., Eng, J.K., Adkins, J.N., Omenn, G.S. and Simpson, R.J. (2005) An evaluation, comparison, and accurate benchmarking of several publicly available MS/MS search algorithms: Sensitivity and specificity analysis. Proteomics, 5, 3475-3490. doi:10.1002/pmic.200500126
- Gao, J., Opiteck, G.J., Friedrichs, M.S., Dongre A.R. and Hefta, S.A. (2003) Changes in the protein expression of yeast as a function of carbon source. Journal of Proteome Research, 2, 643-649. doi:10.1021/pr034038x
- Gao, J., Friedrichs, M.S., Dongre, A.R. and Opiteck, G.J. (2005) Guidelines for the routine application of the peptide hits technique. Journal of the American Society of Mass Spectrometry, 16, 1231-1238. doi:10.1016/j.jasms.2004.12.002
- Gao, J., Garulacan, L.A., Storm, S.M., Opiteck, G.J., Dubaquie, Y., Hefta, S.A., Dambach, D.M. and Dongre, A.R. (2005) Biomarker discovery in biological fluids. Methods, 35, 291-302. doi:10.1016/j.ymeth.2004.08.020
- Yanofsky, C.M., Bell, A.W., Lesimple, S., Morales, F., Lam, T.T., Blakney, G.T., Marshall, A.G., Carillo, B., Lekpor K., Boismenu, D. and Kearney, R.E. (2005) Multicomponent internal recalibration of an LC-FTICR-MS analysis employing a partially characterized complex peptide mixture: Systematic and random errors. Analytical Chemistry, 77, 7246-7254. doi:10.1021/ac050640q
- Qian, W.J., Liu, T., Monroe, M.E., Strittmatter, E.F., Jacobs, J.M., Kangas, L.J., Petritis, K., Camp, D.G. and Smith, R.D. (2005) Probability-based evaluation of peptide and protein identifications from tandem mass spectrometry and SEQUEST analysis: The human proteome. Journal of Proteome Research, 4, 53-62. doi:10.1021/pr0498638
- Meier, M., King, G.L., Clermont, A., Perez, A., Hayashi, M. and Feener, E.P. (2001) Angiotensin AT(1) receptor stimulates heat shock protein 27 phosphorylation in vitro and in vivo. Hypertension, 38, 1260-1265. doi:10.1161/hy1201.096573
- Annesley, T.M. (2003) Ion suppression in mass spectrometry. Clinical Chemistry, 49, 1041-1044. doi:10.1373/49.7.1041
- Weiss, W. and Gorg, A. (2009) High-resolution two-dimensional electrophoresis. Methods in Molecular Biology, 564, 13-32. doi:10.1007/978-1-60761-157-8_2
NOTES
1http://www.huvec.com/PHProteomicDB/proteomicDB/zone/2DpatternGelZone.php?gel=4
Login: huvecdata. Password: data 2010.