Natural Science
Vol.5 No.4(2013), Article ID:29938,6 pages DOI:10.4236/ns.2013.54062
Two mechanisms responsible for marine ecosystem regime shifts from fish landings data off the West Coast of California (WCC)
![]()
1Environmental Science and Technology Center, George Mason University, Fairfax, USA; *Corresponding Author: Jianjun.Xu@noaa.gov
2NOAA/NESDIS/Center for Satellite Applications and Research (STAR), College Park, USA; *Corresponding Author: Al.Powell@noaa.gov
Copyright © 2013 Jianjun Xu, Alfred M. Powell. This is an open access article distributed under the Creative Commons Attribution License, which permits unrestricted use, distribution, and reproduction in any medium, provided the original work is properly cited.
Received 2 November 2012; revised 5 December 2012; accepted 19 December 2012
Keywords: Regime Shift; Fish Landing; Physical Condition
ABSTRACT
This investigation focuses on two mechanisms over the North Pacific connecting decadal regime shifts to regional ecosystem impacts. The physical conditions show the impacts of the atmospheric surface wind stress and the sea surface temperature (SST) physical conditions on the fish landings along the west coast of California (WCC) from 1928-2008. The two mechanisms are identified by the two types of wind stress (e.g. westerly-easterly; or cyclonic-anticyclonic) anomaly over the central North Pacific which results in SST anomalies in the WCC. In both mechanism cases, the local warm (cold) SST anomaly leads to the number of fish species rising (falling) in the WCC region. In addition, the wind stress and SST anomaly pattern over the North Pacific is closely related to the intensity of the regime shifts as identified in the fish landings off the WCC.
1. INTRODUCTION
Identifying abrupt regime shifts in fish landing/catch data is to some extent related with ecosystem variability. Regime shifts are associated with large, abrupt, persistent changes in both atmospheric and oceanic conditions that may be especially pronounced in physical and biological variables. Generally, regime shifts were found in 1925, 1947, 1977, 1989, 1998 [1,2]. The best single test case is the 1976-1977 regime shift that has been identified in the literature numerous times from a variety of both data sets and analysis approaches [3,4].
Regime shifts in fish populations are difficult to explain alone on the basis of biological relationships [5]. Lehodey [6] stated that fish population variability is closely related to environmental variability. Beamish et al. [7] claimed climate change affects the abundance trends of major fisheries. Chavez et al. [5] commented that the mechanism(s) responsible for abrupt regime shifts should be simple, direct and similar in the different regions or ocean basins, and likely linked with largescale atmospheric and oceanic forcing. In many instances, the conditions associated with regional fish landings are often different.
This study attempts to examine a possible physical mechanism for the chain of environmental-regional ecosystem interactions based on the analysis of regime shifts in the North Pacific for the most recent 80 years. Section 2 describes the data sets and methodology. Section 3 investigates the regime shifts occurring in the fish landing data along the west coast of California. The results and the possible mechanisms are discussed in Section 4. Section 5 provides a final summary.
2. DATA AND METHODOLOGY
2.1. Data
The data used in this study include California’s fishery landing data published by the California Department of Fish and Game (CDFG). The sea surface temperature (SST) data was produced by the National Climatic Data Center (NCDC). The surface wind stress data was provided by The International Comprehensive Ocean-Atmosphere Data Set (ICOADS).
1) California’s fish landing data.
The landings of California’s fish catch brought to shore are recorded in the period of 1928-2008 by fish buyers, markets, and canneries and compiled by CDFG [8]. The annual commercial landings of fish and invertebrates are taken from the Pacific Fisheries Environmental Laboratory in the Southwest Fisheries Science Center of NOAA. To track the variability of species from California’s borders, this data set includes only the landings recorded as caught off the west coast of California (WCC). The thirty one species tracked plus the total (All) are listed in Table 1 from Powell and Xu [9].
2) NCDC Extended Reconstructed Sea Surface Temperatures.
The latest version of the Extended Reconstructed SST (ERSST. v3) in the period of 1928-2008 is used in this study. The data was developed by NCDC by combining reconstructed data from models and observations.
3) International Comprehensive Ocean-Atmosphere Data Set (ICOADS).
ICOADS offers wind stress data spanning the past three centuries, and simple gridded monthly summary products for 2˚ × 2˚ “latitude-longitude”. As it contains observations from many different observing systems encompassing the evolution of measurement technology over hundreds of years, ICOADS is probably the most complete and heterogeneous collection of surface marine data in existence.
2.2. Methodology
Similar to the methodology used in Powell and Xu [10], for one time series  from 1928 to 2008, the Regime Shift Index is defined as follows:
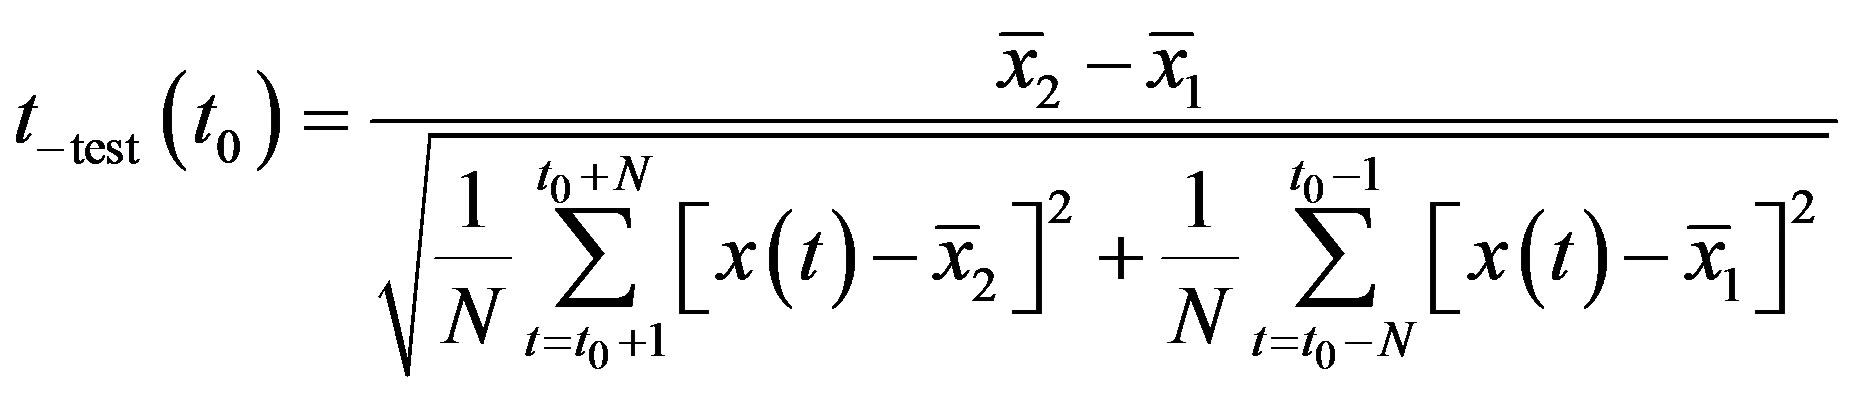 (1)
(1)
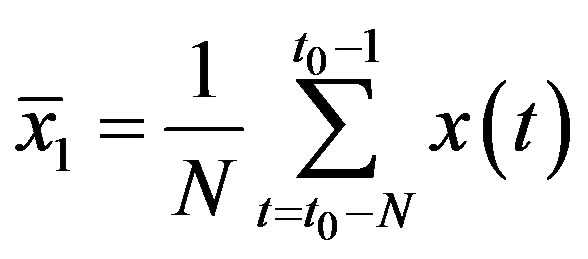 and
and 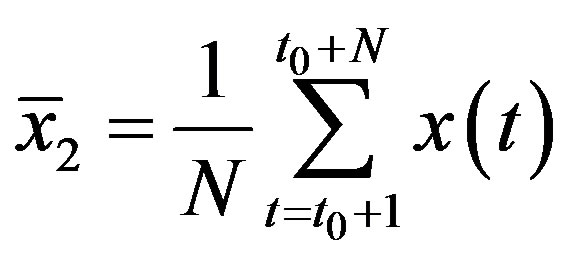
where N = 10, M = 81, the degrees of freedom for the test is 2N − 2, and t0 is the central time from N + 1 to M − N. The running IRSI is correlated with the decade prior and post the central year with the t-test confidence level used to identify the significance of changes.
3. IDENTIFICATION OF REGIME SHIFTS
To identify regime shifts in the fish landings along the WCC, the IRSI was computed with the normalized data set from 1928 to 2008. Figure 1 shows the analysis results with regime shifts occurring at approximately 1947- 1948, 1964-1965, 1977-1978, 1988-1989 and 1998-1999. It is interesting to note that the application of the IRSI to the time series of fish landings apparently indicated the strength of these regime shifts, and the five regime shifts can be divided into three levels: strong, medium and weak. The two strong regime shifts are observed at 1977- 1978 and 1998-1999; the IRSI for these two dates passed the significance test at the 99% confidence level (Figure 1(b)). The medium strength of regime shift is found at 1948-1949, which exceeded significance test at the 90% confidence level. The other two weak regime shifts at 1964-1965 and 1988-1989 can be identified but they did not pass the significance test at the 90% confidence level.
4. RESULTS AND DISCUSSION
Using the regime shift dates from the fish landing analysis, the local atmospheric variability over the North Pacific was analyzed to determine whether the typical cause-effect mechanism (atmospheric forcing, ocean change and fishery changes) could explain any potential linkages between the data sets. The wind stress, SST and fish landings show the pattern in Figure 2 when the data are grouped according to the regime shifts dates (1947- 1948, 1964-1965, 1977-1978, 1988-1989 and 1998-99) obtained from the fish landing analysis along the WCC (Figure 1). The whole study period of 1928-2008 was divided into six sub-periods 1928-1947, 1948-1964, 1965-1977, 1978-1988, 1989-1998, and 1999-2008.
4.1. Atmosphere
The wind stress anomaly (left panel in Figure 2) in the six sub-periods shows two types of opposing patterns. In 1928-1947 (Figure 2(a)), a cyclonic anomalous flow with westward (eastward) anomaly poleward of 30˚N can be found over the North Pacific, and an appreciable closed anomalous cyclone occurs over the northeast North Pacific. The southerly anomaly also prevailed off the WCC, which is opposite to the climatological pattern of wind stress anomaly. In 1948-1964 (Figure 2(b)), the anomalous cyclonic flow disappeared, and was replaced with a prominent easterly anomaly appearing around 30˚N over the North Pacific. At the same time, an anomalous convergent flow from the south and north occupied the WCC. Compared to the previous period, the wind field shows a similar anomaly in 1965-1977 (Figure 2(c)). However, the pattern in 1978-1988 (Figure 2(d)) shows a big change with the easterly anomaly replaced by a westerly anomaly over the central North Pacific and an anomalous divergent flow to the south and north was observed off the WCC. Interestingly, a similar pattern can be found in the subsequent period in 1989-1998 (Figure 2(e)) although the anomalous amplitude is different between the two periods. In contrast, the wind stress in 1999-2008 (Figure 2(f)) changed significantly in com-
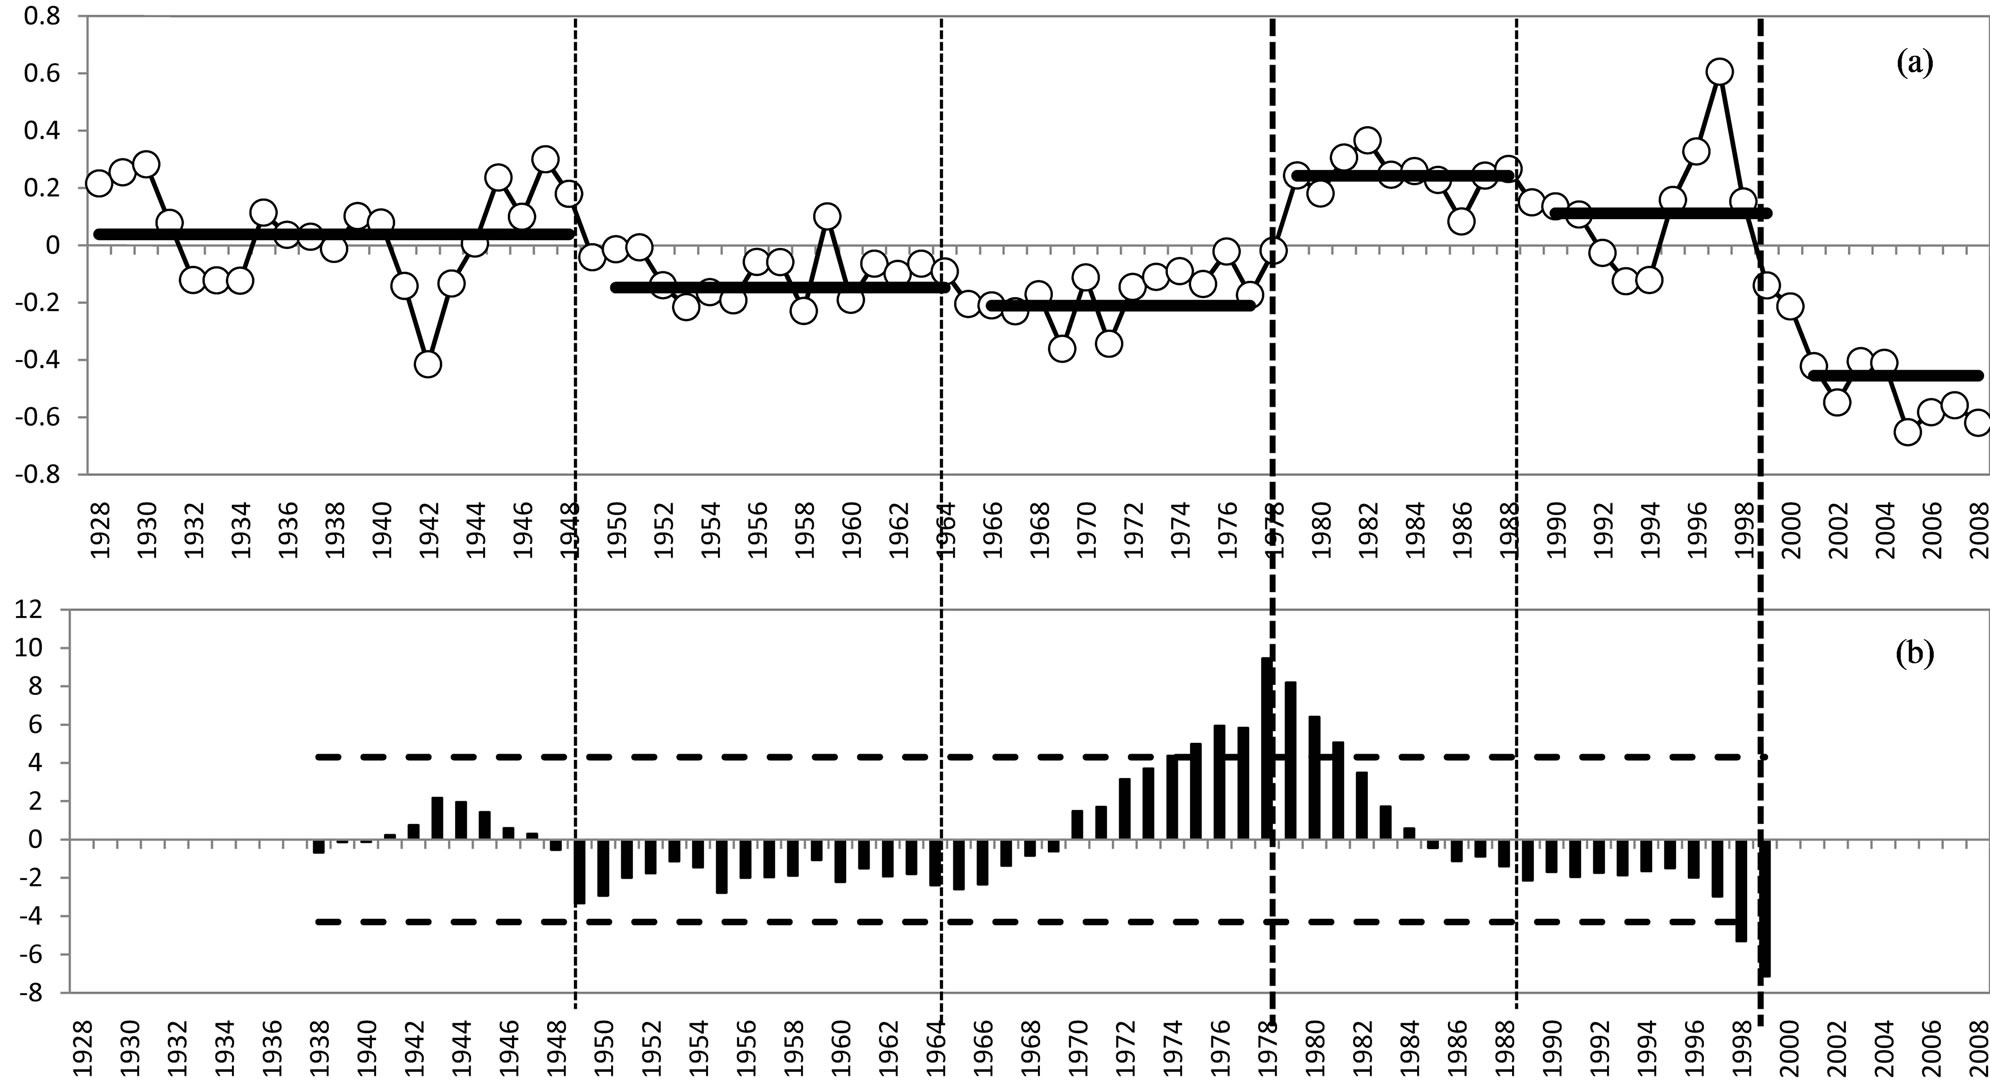
Figure 1. Normalized fish landings and index of regime shift intensity (IRSI) along the West Coast of California (WCC) during the period of 1928-2008. (a) Mean of 31 individual normalized amount of fish landings; (b) Regime shift index based on the student t-test. Horizontal dashed line indicates the significant test at the 99% confidence level. The regime shift periods and approximate shift dates are identified by vertical dashed line (Extended from Powell and Xu [10], Figure 5).
parison with the pattern in 1989-1998. In addition, the 1999-2008 pattern is opposite to the 1928-1947 pattern (Figure 2(a)) with an anomalous anticyclonic flow dominating the central North Pacific with southerly anomaly prevailing along the WCC.
To summarize, based on above analysis, the main points are found as follows: First, two basic patterns we found, with opposing counterparts, responsible for the wind stress anomaly over the North Pacific: 1) an easterly anomaly dominated the central North Pacific with convergent wind flows formed off the WCC (1948-1964 and 1965-1977 in Figures 2(b) and (c)), which is called the “Easterly-Convergence” pattern. The directly opposing pattern was a westerly anomaly prevailing over the central North Pacific (1978-1988 and 1989-1998 in Figures 2(d) and (e)) with a divergent wind flow off the WCC which is called the “Westerly-Divergence” pattern. 2) The cyclonic anomalous flow occupied the northeast North Pacific with southerly anomaly off the WCC (Figure 2(a)), which is called “Cyclonic-Southerly” pattern; while the opposing pattern is the anticyclonic anomalous flow over the northeast North Pacific with the northerly anomaly along the WCC (Figure 2(f)), which is called “Anticyclonic-Northerly” pattern.
During the whole period of 1928-2008, the three significant changes in the wind field occurred at the two strong regime shifts (1977-1978 and 1999-2008 in Figures 2(d) and (f)) and the one medium regime shift (1947-1948). The wind stress for the two weak regime shifts (1964-1965 and 1988-1989) shows similar patterns on each side of the shift period.
4.2. Ocean
On the basis of the coupled air-sea interaction, the atmospheric pattern should result in consistent changes in the ocean patterns. Figures 2(g)-(l) shows the SST patterns over the North Pacific in the six sub-periods. First, when the wind stress anomaly shows “Easterly-Convergence” pattern, a warm SST anomaly tends to occur over the central North Pacific and a cold anomaly forms along the WCC (Figures 2(h) and (i)). In contrast, when the wind stress anomaly shows the “Westerly-Divergence” pattern, a cold SST anomaly appears over the central North Pacific and a warm SST anomaly was observed off the WCC (Figures 2(j) and (k)).
Furthermore, when the wind stress anomaly shows the “Cyclonic-Southerly” pattern, a cold SST anomaly emerged over the central North Pacific and a warm SST anomaly formed along the WCC (Figures 2(g)), which is similar to the “Westerly-Divergence” pattern (Figures 2(j) and (k)); In the opposing situation, when the wind stress anomaly shows the “Anticyclonic-Northerly” pattern, a warm SST anomaly appeared over the central North Pacific and a cold SST anomaly formed off the
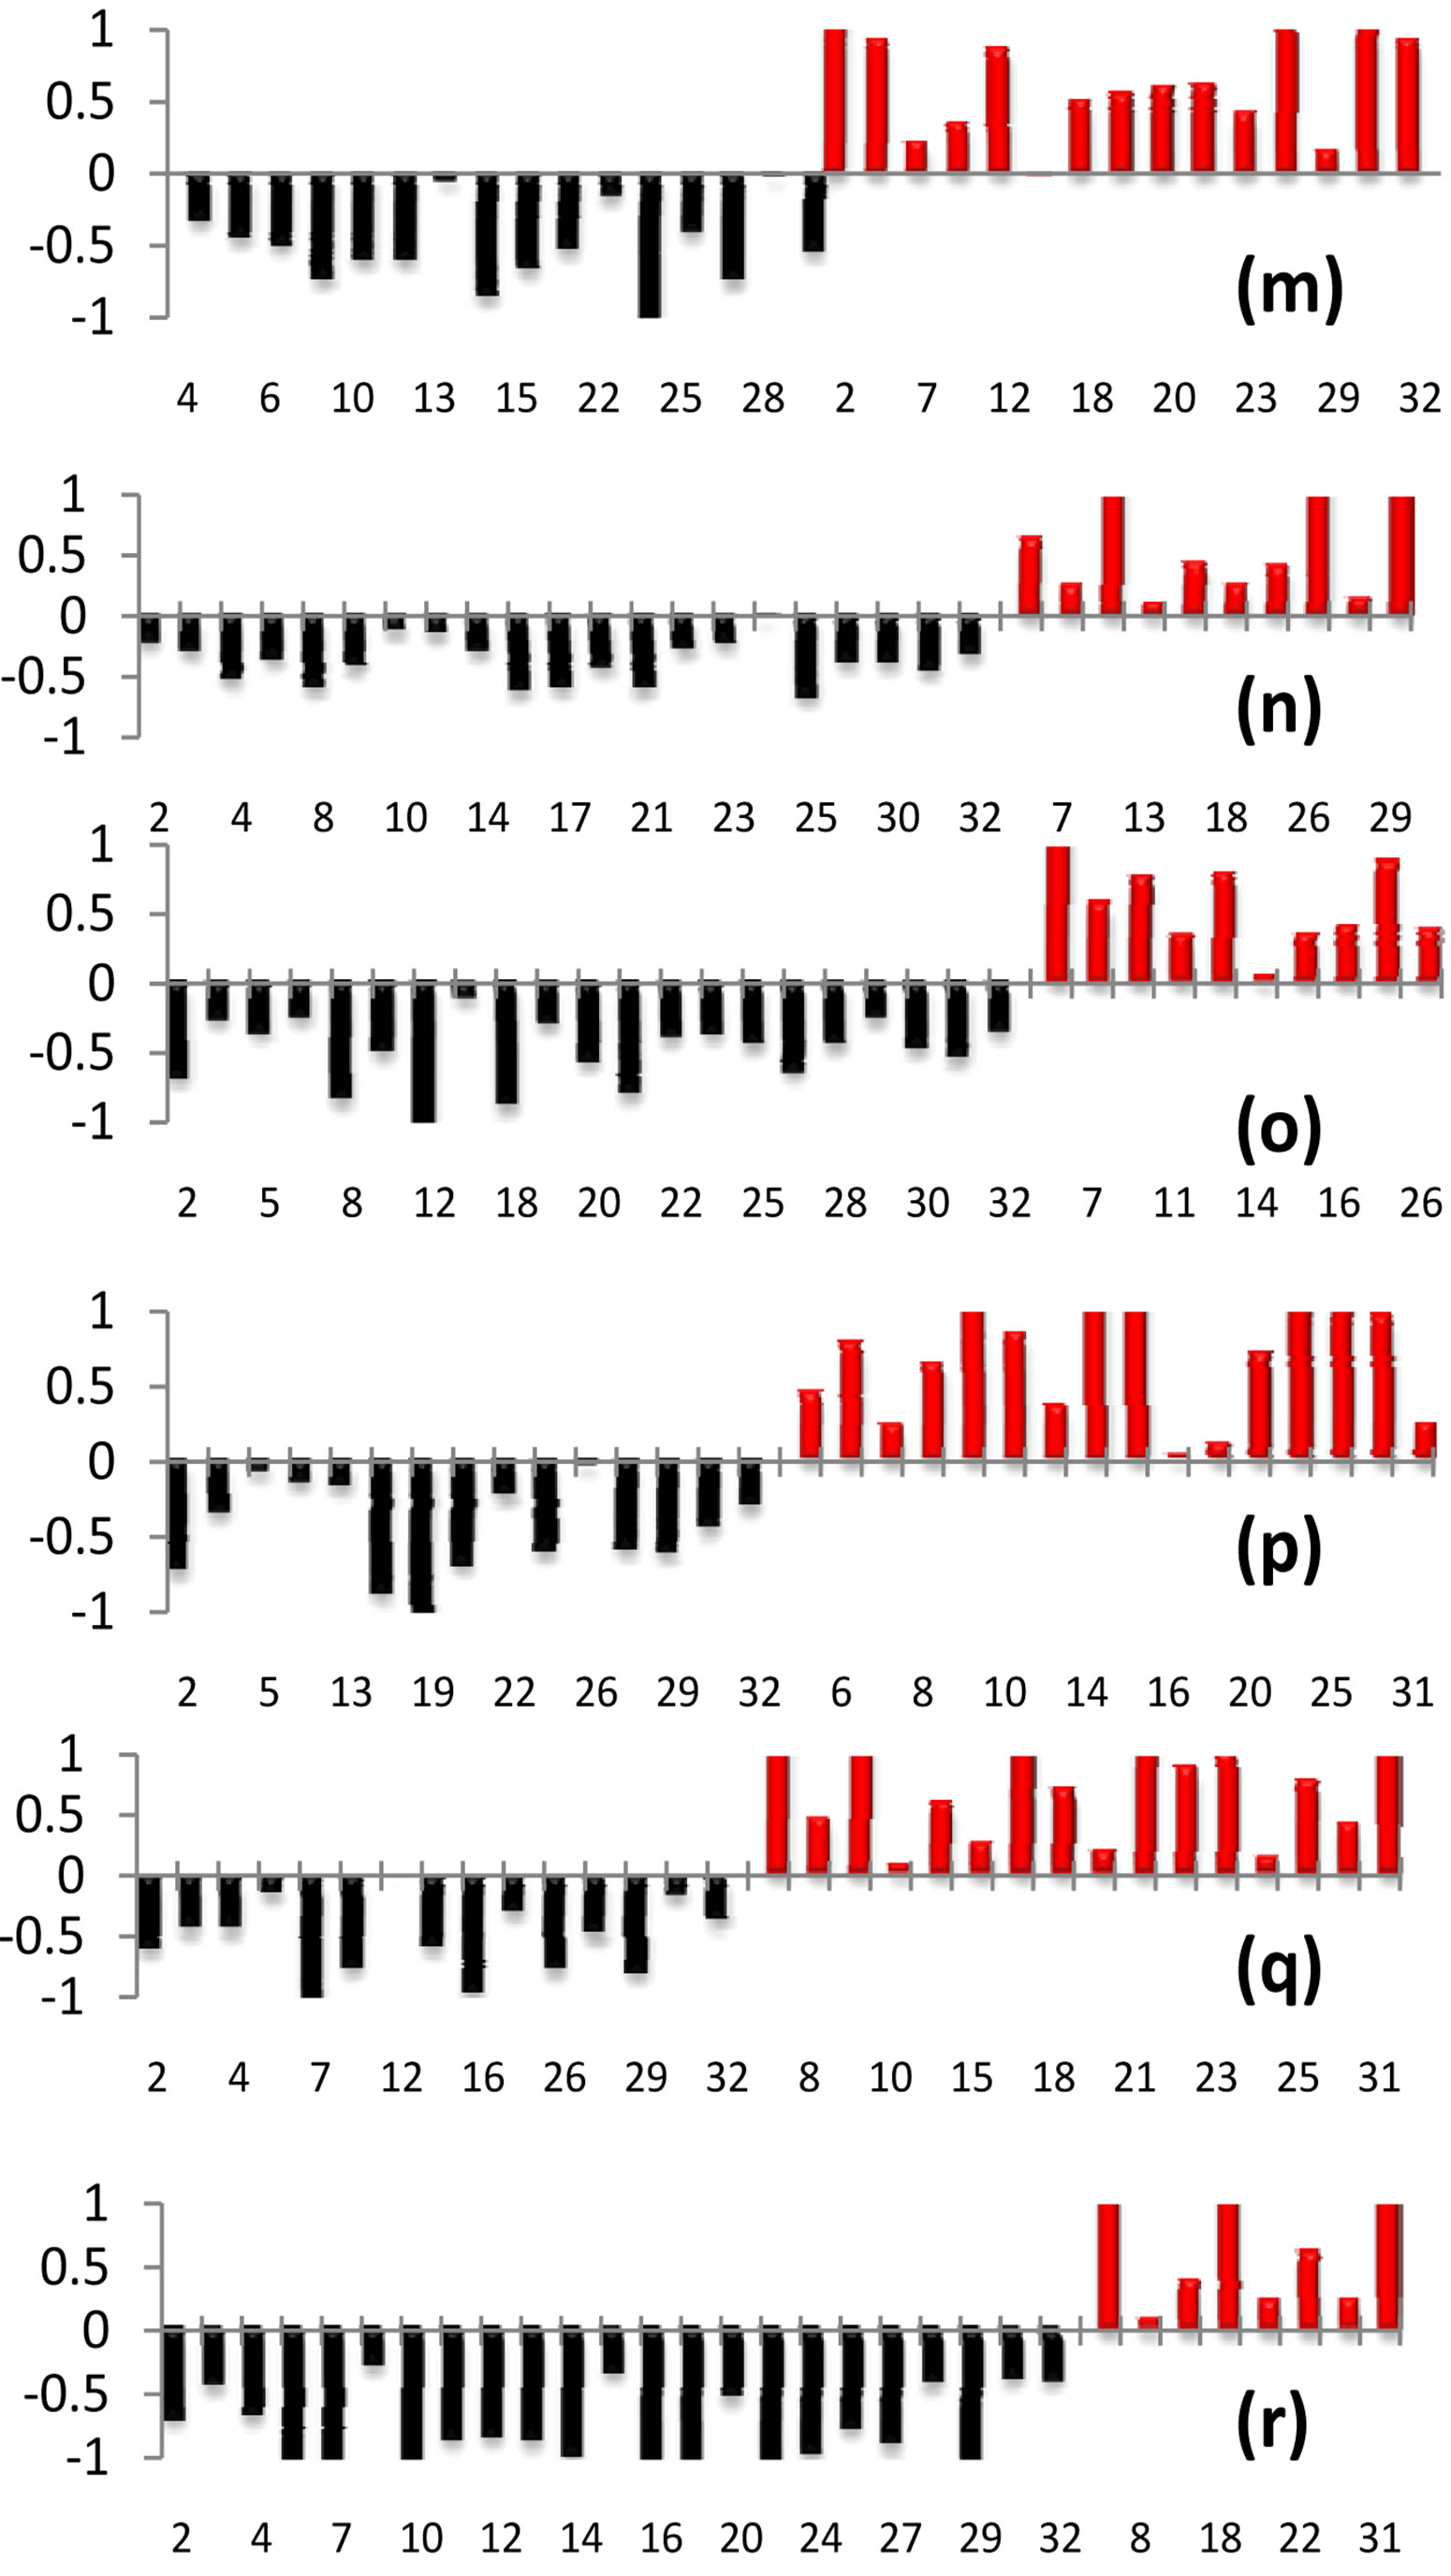
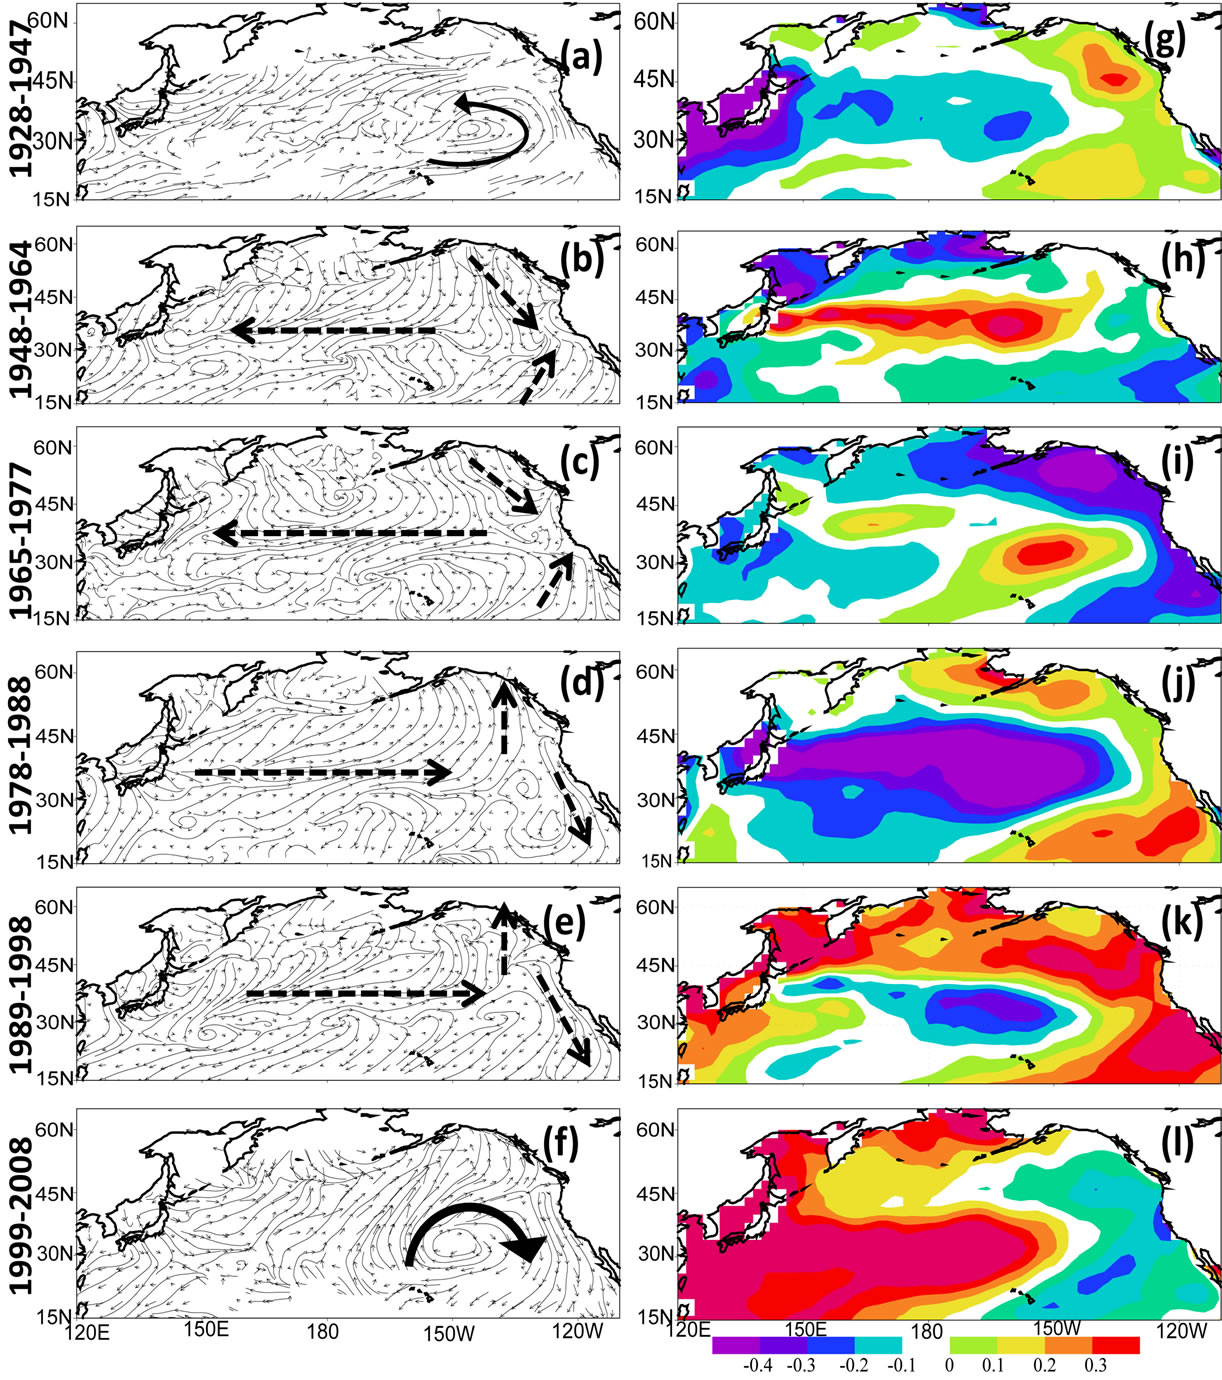
Figure 2. Decadal variability of wind stress, SST over the North Pacific and fish landing over the WCC. Left panel: (a)-(f) decadal wind stress anomaly; middle panel: (g)-(l) decadal SST anomaly; Right panel: (m)-(r) decadal variability of each normalized individual fish species along WCC, the x-axis number represents the individual fish species consistent with the code number in Table 1 (Updated from Powell and Xu [9], Figures 6 and 7).
WCC (Figure 2(i)), which is similar to the “EasterlyConvergence” pattern (Figures 2(h) and (i)).
4.3. Fisheries
If we assume the atmospheric and oceanic physical conditions can impact the fisheries via a variety of pathways (spawning temperatures, food availability via upwelling/downwelling, etc.), then the fish landings should subsequently show corresponding changes in the fish populations in the multiple time periods.
In Figures 2(m)-(r), the 31 individual species of fish landings available from NOAA’s Southwest Fisheries Science Center were analyzed for those that improved or worsened in each regime period. The fish that increased (decreased) in normalized landings were plotted together. During the period of the warm SST anomaly off the WCC (Figures 2(g), (j) and (k)), the number of fish species with increased normalized landings (Figures 2(m), (p) and (q) against Figures 2(n), (o) and (r)) is greater than during the cold anomaly periods (Figures 2(h), (i) and (l)). While this analysis is for a single region/ecosystem, it is relevant for understanding the Pacific basin scale chain of events that cause regional ecosystem change.
4.4. Discussion
The purpose of this paper was to demonstrate that a change in the atmosphere could produce simple and direct impacts on the ocean, leading to the ecosystem change. Many factors have been connected with regime shifts. Overland et al. [2] showed possible connections with 30 to 100 physical, biological and climate variables. Collie et al. [11] pointed out that smooth, abrupt, and discontinuous shifts can be identified on the basis of different patterns in the relationship between the response of an ecosystem variable (typically biological) and some external forcing. Aebisher et al. [12] discussed how temperature and wind stress variations affect plankton production which can propagate up the food chain and impact fish populations. With many factors potentially affecting an ecosystem, it should be obvious that not all fish species will respond similarly to the same physical change in the environment. As a consequence, the analysis approach used the more traditional atmospheric forcing of the ocean via wind stress as the general mechanism combined with the simple approach of looking at how many fish species improved or declined for identifying regime shift impacts.
In this study, the local SST anomaly off the WCC is a key factor linking the atmospheric forcing with the regional Pacific ecosystem by modifying the number of fish species which performed well as indicated by the fish landing data. Based on SST change, during cold anomalies fewer fish species do well compared to the warm anomalies when a greater number of fish species do well. For example, before 1977, the convergent wind flow off the WCC is associated with an easterly anomaly over the central North Pacific (Figure 2(c)), and produced a cold SST anomaly (Figure 2(i)) and modified the ecosystem to impact approximately 16% of the 31 monitored fish species off the WCC. In contrast, post 1978, divergent wind flow (Figure 2(d)) created a warm SST anomaly and strengthened the ecosystem conditions providing a benefit for the fish in the WCC ecosystem. It is worth noting this conclusion is due to inferred fish population changes from the fish landing data. The migration of fish to regions more conducive for survival, or other factors is not completely clear. However, the impact on the ecosystem is directly discernible.
5. SUMMARY
The atmospheric and oceanic anomaly pattern is closely related to the index of regime shift intensity. During the period of 1928-2008, two strong regime shifts were identified at 1977-1978 and 1999-2008, one medium regime shift at 1947-1948 and two weak regime shifts at 1964- 1965 and 1988-1989.
On the basis of the above analysis, two basic mechanisms are responsible for the regime shifts in the Pacific and in the WCC regional ecosystem in particular as summarized in Figure 3.
Mechanism one: When the wind stress anomaly shows “Easterly-Convergence” (“Westerly-Divergence”) pattern, a warm (cold) SST anomaly tends to occur over the central North Pacific with a cold (warm) anomaly forming along the WCC, the number of fish species doing well decreases (increases) off the WCC.
Mechanism two: when the wind stress anomaly shows “Cyclonic-Southerly” (“Anticyclonic-Northerly”) pattern, a cold (warm) SST anomaly emerged over the central North Pacific with a warm (cold) SST anomaly along the WCC. The impact was the number of fish species doing well increased (decreased) off the WCC.
The analysis shows a clear connection between the atmosphere, ocean and biological impacts in the WCC from surface wind forcings due to regime shifts that re-
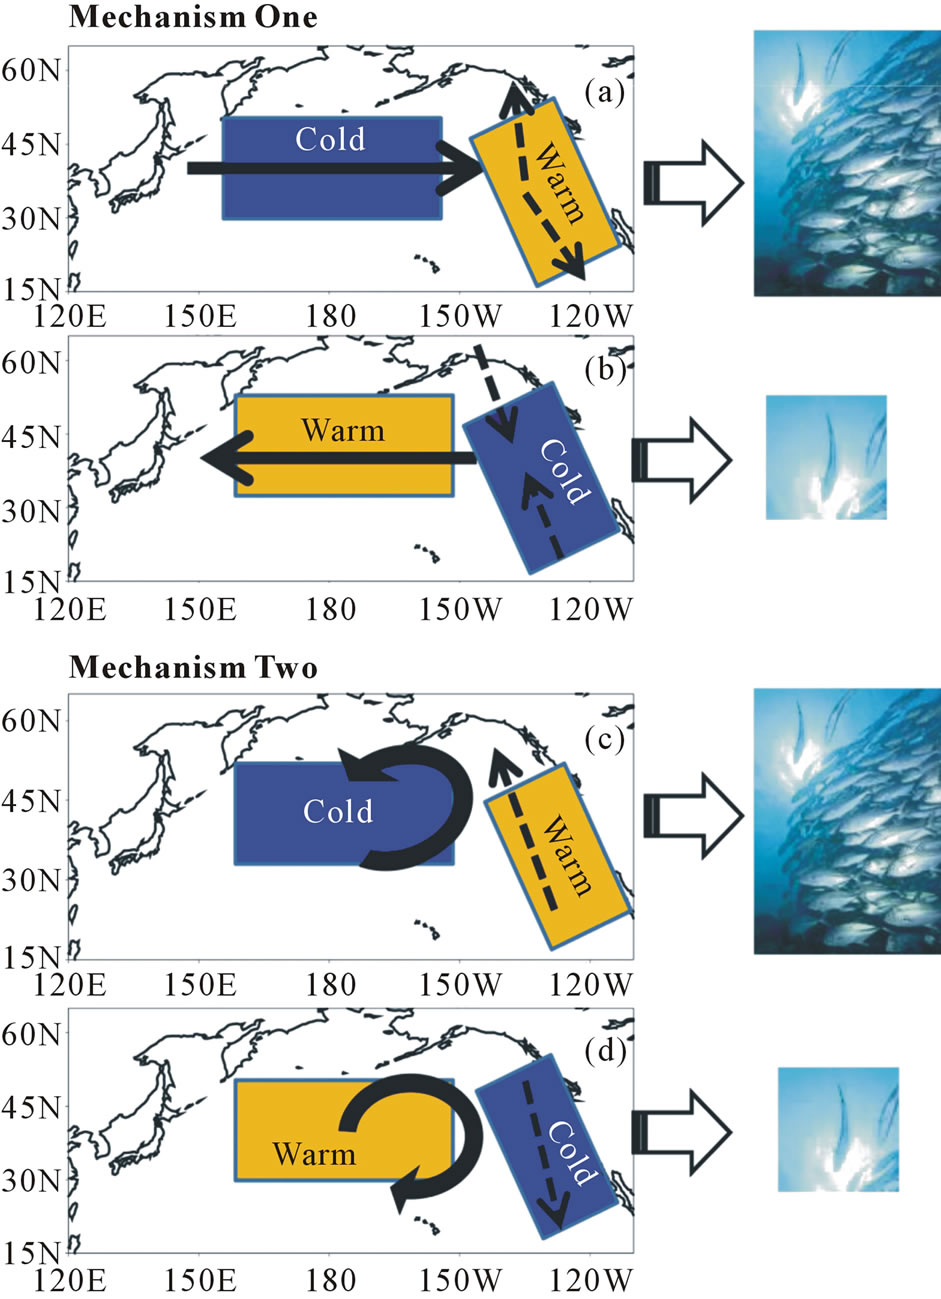
Figure 3. Schematic diagrams of the two mechanisms responsible for the regime shift of fish landings along the WCC. The “arrow” indicates the direction of the SWS anomaly. The “WARM” and “COOL” indicates the SST anomaly. Mechanism one: (a) Westerly-Divergent (WD) SWS forcing; (b) EasterlyConvergent (EC) SWS forcing Mechanism two; (c) CyclonicSoutherly (CS) SWS forcing; (b) Anticyclonic-Northerly (AN) SWS forcing.
sult in fish landing changes.
6. ACKNOWLEDGEMENTS
This work was supported by NOAA. The views, opinions, and findings contained in this publication are those of the authors and should not be considered an official NOAA or US Government position, policy, or decision.
REFERENCES
- Mantua, N.J., Hare, S.R., Zhang, Y., Wallace, J.M. and Francis, R.C. (1997) A Pacific interdecadal climate oscillation with impacts on salmon production. Bulletin of the American Meteorological Society, 78, 1069-1079. doi:10.1175/1520-0477(1997)078<1069:APICOW>2.0.CO;2
- Overland, J., Rodionov, S., Minobe, S. and Bond, N. (2008) North Pacific regime shifts: Definitions, issues and recent transitions. Progress in Oceanography, 77, 92- 102. doi:10.1016/j.pocean.2008.03.016
- Nitta, T. and Yamada, S. (1989) Recent warming of tropical sea surface temperature and is relationship to the Northern Hemisphere circulation. Journal of the Meteorological Society of Japan, 67, 375-383.
- Zhang, Y., Wallace, J.M. and Battisti, D.S. (1997) ENSOlike interdecadal variability: 1900-1993. Journal of Climate, 10, 1004-1020. doi:10.1175/1520-0442(1997)010<1004:ELIV>2.0.CO;2
- Chavez, F.P., Ryan, J., Lluch-Cota, S.E. and Miguel Niquen C. (2003) From anchovies to sardines and back: Multidecadal change in the Pacific Ocean. Science, 299, 217-221. doi:10.1126/science.1075880
- Lehodey, P., et al. (2006) Climate variability, fish, and fisheries. Journal of Climate, 19, 1009-1029. doi:10.1175/JCLI3898.1
- Beamish, R.J., Benson, A.J., Sweeting, R.M. and Nevelle, C.M. (2004) Regimes and the history of the major fisheries off Canada’s West Coast. Progress in Oceanography, 60, 355-385. doi:10.1016/j.pocean.2004.02.009
- Mason, J.E. (2004) Historical patterns from 74 years of commercial landings from California Waters. CalCOFI Reports, 45, 180-190.
- Powell, A.M. and Xu, J. (2011) Abrupt climate regime shifts, their potential forcing and fisheries impacts. Atmospheric and Climate Sciences, 1, 33-47.
- Powell, A.M. and Xu, J. (2012) The 1977 global regime shift: A discussion of its dynamics and impacts in the Eastern Pacific ecosystem, Atmosphere-Ocean, 50, 421- 436. doi:10.1080/07055900.2012.716023
- Collie, J.S., Richardson, K. and Steele, J.H. (2004) Regime shifts: Can ecological theory illuminate the mechanisms? Progress in Oceanography, 60, 281-302. doi:10.1016/j.pocean.2004.02.013
- Aebisher, N.J., Coulson, J.C. and Colebrook, J.M. (1990) Parallel long-term trends across four marine trophic levels and weather. Nature, 347, 753-755. doi:10.1038/347753a0