Health
Vol.11 No.06(2019), Article ID:92922,9 pages
10.4236/health.2019.116057
Utility of the “RMSSD-Slope” to Assess the Internal Load in Different Sports Situations
José F. Ruso-Álvarez1 , Claudio Nieto-Jiménez2, Alejandro Muñoz-López1, José Naranjo Orellana1*
1Pablo de OlavideUniversity, Sevilla, Spain
2Universidad del Desarrollo, Santiago, Chile

Copyright © 2019 by author(s) and Scientific Research Publishing Inc.
This work is licensed under the Creative Commons Attribution International License (CC BY 4.0).
http://creativecommons.org/licenses/by/4.0/


Received: May 13, 2019; Accepted: June 3, 2019; Published: June 6, 2019
ABSTRACT
The control of training load has become a very interesting field for investigation in sports, but few tools are used to assess internal training load (ITL). The aim of this study is to use a post-exercise analysis methodology in different athletes and situations to establish its utility and reliability as a measure of ITL. In a retrospective review, we analysed 112 measurements of 74 subjects (38 men and 36 women) grouped in: University students (UNI); national team (FUTSAL 1); university team (FUTSAL 2); athletes (ATL); badminton players (BADM). Measures of Heart Rate Variability (HRV) were made with a Polar V800 with a thoracic band H10, during 5 minutes in a seated position after exercise. We calculated the Root Mean Square of the successive differences between adjacent RR intervals (RMSSD) and its slope from exercise to recovery. Measurements from UNI, FUTSAL-2, ATL-M and ATL-F were grouped into three categories of intensity (60%, 75% and 100%). RMSSD-Slope values were lower as intensity increased but different for every subject. In the BADM and FUTSAL-1 groups, RMSSD-Slope was progressively lower after consecutive matches for every player. The RMSSD-Slope seems to be a very accurate method to assess ITL.
Keywords:
HRV, Training Load, rMSSD, Recovery

1. Introduction
The control of training load (TL) has become a very interesting field for investigation in sports [1] [2] [3]. The load administered (for example, as a training session) is considered the external training load (ETL) and the way in which each athlete responds to it is considered internal training load (ITL) [4] , however, few tools are used to assess ITL. Among them, the most used are the rating of perceived exertion of the training session (sRPE and its different variants) [5] or the algorithm called Training Impulse (TRIMP) [6].
Heart rate variability (HRV) is a non-invasive tool widely used to assess sympathetic and parasympathetic modulation [7] [8] [9]. The Root Mean Square of the successive differences between adjacent RR intervals (RMSSD) is considered as the more accurate measure of parasympathetic activity. HRV is considered a valid method to evaluate individual [10] [11] [12] [13] or collective response to a given TL [14] [15] and it fundamentally evaluates ITL, particularly if the object of analysis is the reactivation of the parasympathetic system after exercise [16] [17] [18] [19]. In this way, Naranjo Orellana et al. [20] described a measure of ITL based on the recovery slope of RMSSD during the first 30 minutes.
This measure (RMSSD-Slope) is easy to obtain. Its value bears a very close relationship with effort intensity, and it clearly detects individual responses to the same TL [20]; so, it seems justified to explore its practical utility as an indicator of ITL.
Therefore, the aim of this study is to use this post-exercise analysis methodology in different athletes and situations to establish its utility and reliability as a measure of ITL.
2. Methods
2.1. Subjects
In a retrospective review of our HRV database, we selected a total of 112 valid measurements, corresponding to 74 subjects (38 men and 36 women), taken under different circumstances. The inclusion criteria were as follow: 1) all records in a seated position; 2) all records with the same device; 3) all the records were taken after exercise; 4) all of them including at least 10 minutes recovery.
2.2. HRV Measurements and Analysis
The measurements were made with a Polar V800, with an H10 Sensor thoracic band (Polar Inc., Kempele, Finland) validated for the realization of HRV measurements [21].
The RR time series were downloaded via accompanying Polar Software (Polar FlowSync Version 2.6.2, Kempele, Finland) and they were analysed using Kubios HRV software (Version 2.1, University of Eastern Finland, Kuopio, Finland).
HRV was not quantified the first 5 minutes of recovery because of the loss of time series stability derived from the sudden change between the end of the exercise and the start of recovery [22]. Each record was analyzed previously to detect the possible presence of artifacts and anomalous beats, applying the corresponding filters if required.
All the subjects were grouped by sporting discipline as follows (Table 1).
A group made up of 13 university students of Sports Science, all physically active (UNI) and all male. They performed exercise on a cycle ergometer during a constant load test at an intensity of between 60% and 75%.

Table 1. Sample size and measurements.
Abbreviations: UNI (university students); FUTSAL-1 (National team); FUTSAL-2 (university team); ATL (athletes); BADM (badminton players).
A group of 20 female Futsal players divided into two groups. The first group (FUTSAL-1) included 10 members of a national team and we used 20 recovery measurements taken 120 minutes after 2 fully demanding matches. The second group (FUTSAL-2) was formed by 10 players of a University team and we used 10 recovery measurements recorded following a maximum stress test on a treadmill, 10 minutes immediately post exercise.
A group of 31 athletes (ATL) consisting of 22 men (ATL-M) and 9 women (ATL-F). In the ATL-M group, a total of 22 measurements were selected in the following situations: 17 measurements taken 10 minutes after an intense training session and 5 measurements taken 15 minutes after the end of a “time to exhaustion” (TTE) test. The athletes in the ATL-F group performed different evaluation tests and 17 measurements were chosen: 7 after a maximum stress test; 4 after a constant load test at 60% intensity; 5 after a constant load test at 80% intensity, and one after a TTE test.
All these measurements were recorded 10 minutes immediately post exercise.
One group of 10 youth elite badminton players (BADM) made up of 3 male (BADM-M) and 7 female (BADM-F) subjects. 30 measurements were selected corresponding to 3 matches played in 48 hours, at different tournaments, up to the semi-finals. Recovery was monitored 15 minutes after each game.
The subjects from the groups UNI, FUTSAL-2, ATL-M and ATL-F were grouped into three categories in accordance with the intensities at which they had carried out the corresponding tests: 60% (all tests < 70%), 75% (tests between 70% and 80%) and 100% (maximum tests). For all of them, the RMSSD recovery slope was calculated according to the specifications of Naranjo Orellana et al. [20].
The data from the BADM group were used to observe the behaviour of these indexes in a situation in which the same subjects accumulated three training loads (maximum level matches) in a period of 48 hours.
Finally, the data for the FUTSAL-1 group was used to ascertain whether the information about RMSSD recovery obtained two hours after a fully demanding game (and, therefore, out of the established range of 30 minutes) was still coherent with the other data. To this end, measurements were taken following two separate games, 48 hours apart, during a competition situation.
3. Results
Table 2 shows the age, body mass and height characteristics of each of the groups.
All the measurements were grouped by intensity, so that a 60% intensity corresponds to an average RMSSD-Slope of 2.65 (±3.71); at an intensity of 75% we found an average slope of 1.25 (±1.60) and at maximum intensity the average slope was 0.75 (±0.59).
Figure 1 shows the representation of each of the measurements in the corresponding nomogram for the RMSSD-Slope proposed by Naranjo Orellana et al. [20].
Figure 2 shows the distribution of RMSSD-Slope values for players in the BADM group. These values descended along the three consecutive matches played: 1.25 (±2.31), 0.32 (±0.44) and 0.17 (±0.19).
Figure 3 shows the distribution of the RMSSD-Slopes values corresponding to the players from the national Futsal team (FUTSAL-1). The values were 0.66 (±0.24) two hours after the first matches and 0.47 (±0.21) two hours after the second one.
Table 2. Sample size and measurements.
Abbreviations: UNI: University students; ATL: Athletes; BADM: Badminton players, F: Female; M: Male; SD: Standard deviation.
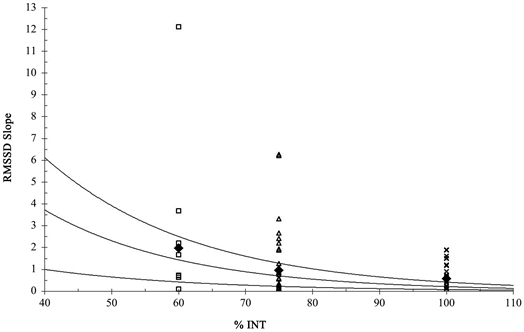
Figure 1. Distribution of all individual valulues over the nomogram proposed. Abbreviations: RMSSD (Root Mean Square of the Successive Differences between adjacent RR intervals in ms).
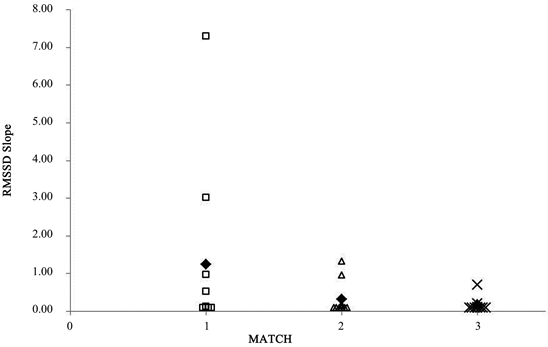
Figure 2. Distribution of RMSSD-Slope values over three badminton matches. Abbreviations: RMSSD (Root Mean Square of the Successive Differences between adjacent RR intervals in ms).
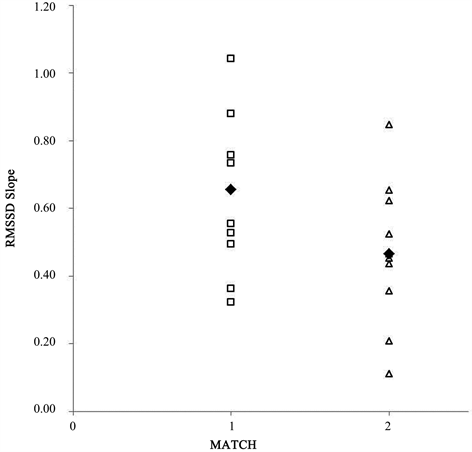
Figure 3. Distribution of RMSSD-Slope values over two futsal matches. Abbreviations: RMSSD (Root Mean Square of the Successive Differences between adjacent RR intervals in ms).
4. Discussions
The main contribution of this study is to verify with different exercise situations the usefulness of the nomogram proposed by Naranjo Orellana et al. [20] as a simple tool capable of evaluating ITL based on the immediate recovery of RMSSD.
The experiment carried out by Naranjo Orellana et al. [20] showed that RMSSD falls to values close to zero, regardless of the intensity of the effort, yielding an average value of 4 ms.
Following the recommendations of these authors, as we had not recorded the RMSSD values during exercise, we calculated the RMSSD recovery slope based on this average value of 4 ms.
The authors also found that its reactivation following exercise behaves in a linear way, at least for the first 30 minutes, and the slope can be calculated at any point during those 30 minutes. In that study [20] this recovery slope (RMSSD-Slope) had a good inverse correlation with exercise intensity but it is different for each subject at the same effort intensity, making it a good indicator of ITL.
Based on the proposed nomogram [20] , Figure 1 shows the individual responses of the 62 measurements taken within a range of three intensities: 60%, 75% and 100%. We can see that the higher the intensity of effort, the lower the dispersion between subjects. Of the 9 measurements taken at an intensity level of 60%, one is clearly down the lower limit of the nomogram, indicating that the ITL was excessively high for that intensity. Similarly, 6 of the 30 measurements (20%) taken at an intensity level of 75% and 4 of the 23 measurements (23%) taken at 100% are in the same situation, with a very high ITL. Therefore, it should be taken into account that around 20% of athletes performing similar TL could have a high ITL related to the intensity.
In the literature, most of articles are often looking for a correlation between the variables ETL and ITL. The most recent meta-analysis regarding this issue [4] is searching precisely for that. However, we are convinced that this way of thinking about TL leads to important errors. So that if we have into account the definition of ITL, it would not be logical to expect any kind of correlation with measurements of ETL. If this correlation did exist, it could be cross-contamination from ETL rather than the supposed measurement of ITL. In other words, if a group of subjects carries out exactly the same ETL, they should, by definition, have different ITL values, and if this were repeated with different ETL, we should not expect any correlation whatsoever.
This line of thinking is confirmed by our data. As we can see in Figure 1, and as noted above, the response shown in ITL is completely individual for the same ETL.
If the RMSSD-Slope is a good measure of internal load, in situations of greater fatigue, the same subjects should present lower values. That is exactly what is shown here when comparing data from the youth elite badminton players (BADM) during three matches at maximum competition level played over the course of one weekend. Figure 2 shows that, as progress of the games, the average RMSSD-Slopes are lower and data dispersal gradually lessens. Furthermore, as the number of matches increases, the number of subjects presenting a minimum slope also increases.
When analysing the values recorded in the national Futsal players (FUTSAL-1), the aim pursued is two-fold. Firstly, to confirm that data for the second match (Figure 3) shows a clearly higher ITL (lower slope) than the first match. Secondly, to see whether this analysis maintains its coherence when the slopes are calculated outside of the range of 30 minutes and, therefore, outside of what would be considered immediate recovery. These measurements are taken two hours after the game ends and we do not know whether the RMSSD recovery remains with the same slope that in the first 30 minutes, but data obtained continue to show an absolutely individual response and they are lower after the second match, as observed in Figure 3. Once again, in our opinion, these data reinforce the validity of this tool as a measurement of ITL.
In conclusion, RMSSD-Slope seems to be a very accurate method to assess ITL.
Acknowledgements
The authors would like to express their gratitude to the researchers who provided the data for this study, especially Dr. German Hernández Cruz’s team from the UANL Faculty of Sports Management (Nuevo León, México).
Conflicts of Interest
The authors declare no conflicts of interest regarding the publication of this paper.
Cite this paper
Ruso-Álvarez, J.F., Nieto-Jiménez, C., Muñoz-López, A. and Naranjo Orellana, J. (2019) Utility of the “RMSSD-Slope” to Assess the Internal Load in Different Sports Situations. Health, 11, 683-691. https://doi.org/10.4236/health.2019.116057
References
- 1. Bourdon, P.C., Cardinale, M., Murray, A., Gastin, P., Kellmann, M., Varley, M.C, Gabbett, T.J., Coutts, A.J., Burgess, D.J., Gregson, W. and Cable, N.T. (2017) Monitoring Athlete Training Loads: Consensus Statement. Human Kinetics Journals, 12, 161-170. https://doi.org/10.1123/IJSPP.2017-0208
- 2. Halson, S.L. (2014) Monitoring Training Load to Understand Fatigue in Athletes. Sports Medicine, 44, 139-147. https://doi.org/10.1007/s40279-014-0253-z
- 3. Buchheit, M. (2014) Monitoring Training Status with HR Measures: Do All Roads Lead to Rome? Frontiers in Physiology, 5, 1-19. https://doi.org/10.3389/fphys.2014.00073
- 4. McLaren, S.J., Macpherson, T.W., Coutts, A.J., Hurst, C., Spears, I.R. and Weston, M. (2018) The Relationships between Internal and External Measures of Training Load and Intensity in Team Sports: A Meta-Analysis. Sports Medicine, 48, 641-658. https://doi.org/10.1007/s40279-017-0830-z
- 5. Foster, C. (1998) Monitoring Training in Athletes with Reference to Overtraining Syndrome. Medicine & Science in Sports & Exercise, 30, 1164-1168. https://doi.org/10.1097/00005768-199807000-00023
- 6. Banister, E.W. and Calvert, T.W. (1980) Planning for Future Performance: Implications for Long Term Training. Canadian Journal of Applied Sport Sciences, 5, 170-176.
- 7. Sandercock, G.R.H., Bromley, P.D. and Brodie, D.A. (2005) Effects of Exercise on Heart Rate Variability: Inferences from Meta-Analysis. Medicine and Science in Sports and Exercise, 37, 433-439. https://doi.org/10.1249/01.MSS.0000155388.39002.9D
- 8. Stanley, J., Peake, J.M. and Buchheit, M. (2013) Cardiac Parasympathetic Reactivation Following Exercise: Implications for Training Prescription. Sports Medicine, 43, 1259-1277. https://doi.org/10.1007/s40279-013-0083-4
- 9. Task Force of the European Society of Cardiology and the North American Society of Pacing and Electrophysiology (1996) Heart Rate Variability. Standards of Measurement, Physiological Interpretation, and Clinical Use. European Heart Journal, 17, 354-381.
- 10. Nieto-Jiménez, C., Pardos-Mainer, E., Ruso-álvarez, J.F. and Naranjo-Orellana, J. (2019) Training Load and HRV in a Female Athlete: A Case Study. Revista Internacional de Medicina y Ciencias de la Actividad Física y el Deporte, in press. http://cdeporte.rediris.es/revista/inpress/artcarga1143e.pdf
- 11. Pichot, V., Roche, F., Gaspoz, J.M., Enjolras, F., Antoniadis, A., Minini, P., Costes, F., Busso, T., Lacour, J.R. and Barthélémy, J.C. (2000) Relation between Heart Rate Variability and Training Load in Middle-Distance Runners. Medicine and Science in Sports and Exercise, 32, 1729-1736. https://doi.org/10.1097/00005768-200010000-00011
- 12. Kiviniemi, A.M., Hautala, A.J., Kinnunen, H. and Tulppo, M.P. (2007) Endurance Training Guided Individually by Daily Heart Rate Variability Measurements. European Journal of Applied Physiology, 101, 743-751. https://doi.org/10.1007/s00421-007-0552-2
- 13. Fortes, L.S., Ferreira, M.E.C., Paes, S.T, Costa, M.C., Lima-Júnior, D.R.A.A., Costa, E.C. and Cyrino, E.S. (2019) Effect of Resistance Training Volume on Heart Rate Variability in Young Adults. Isokinetics and Exercise Science, 27, 69-77. https://doi.org/10.3233/IES-182207
- 14. Fortes, L.S., Da Costa, B.D.V., Paes, P.P., Do Nascimento Júnior, J.R.A., Fiorese, L. and Ferreira, M.E.C. (2017) Influence of Competitive-Anxiety on Heart Rate Variability in Swimmers. Journal of Sports Science and Medicine, 16, 498-504.
- 15. Miranda-Mendoza, J., Reynoso-Sanchez, L.F., Hoyos-Flores, J.R., Quezada-Chacón, J.T., Naranjo, J., Rangel-Colmenero, B. and Hernández-Cruz, G. (2019) Stress Score and lnRMSSD as Internal Load Parameters during Competition. Revista Internacional de Medicina y Ciencias de La Actividad Física y El Deporte, in press. http://cdeporte.rediris.es/revista/inpress/artstress1105e.pdf
- 16. Naranjo, J., De La Cruz, B., Sarabia, E., De Hoyo, M. and Dominguez-Cobo, S. (2015) Heart Rate Variability: A Follow-Up in Elite Soccer Players throughout the Season. International Journal of Sports Medicine, 36, 881-886. https://doi.org/10.1055/s-0035-1550047
- 17. Goldberger, J.J., Le, F.K., Lahiri, M., Kannankeril, P.J., Ng, J. and Kadish, A.H. (2006) Assessment of Parasympathetic Reactivation after Exercise. American Journal of Physiology-Heart and Circulatory Physiology, 290, H2446-H2452. https://doi.org/10.1152/ajpheart.01118.2005
- 18. Saboul, D., Balducci, P., Millet, G., Pialoux, V. and Hautier, C. (2016) A Pilot Study on Quantification of Training Load: The Use of HRV in Training Practice. European Journal of Sport Science, 16, 172-181. https://doi.org/10.1080/17461391.2015.1004373
- 19. Buchheit, M., Laursen, P.B. and Ahmaidi, S. (2007) Parasympathetic Reactivation after Repeated Sprint Exercise. American Journal of Physiology-Heart and Circulatory Physiology, 293, H133-H141. https://doi.org/10.1152/ajpheart.00062.2007
- 20. Naranjo Orellana, J., Nieto-Jiménez, C. and Ruso-álvarez, J.F. (2019) Recovery Slope of Heart Rate Variability as an Indicator of Internal Training Load. Health, 11, 211-221https://doi.org/10.4236/health.2019.112019
- 21. Giles, D., Draper, N. and Neil, W. (2016) Validity of the Polar V800 Heart Rate Monitor to Measure RR Intervals at Rest. European Journal of Applied Physiology, 116, 563-571. https://doi.org/10.1007/s00421-015-3303-9
- 22. Javorka, M., Zila, I., Balhárek, T. and Javorka, K. (2002) Heart Rate Recovery after Exercise: Relations to Heart Rate Variability and Complexity. Brazilian Journal of Medical and Biological Research, 35, 991-1000. https://doi.org/10.1590/S0100-879X2002000800018