Health
Vol.5 No.6(2013), Article ID:32880,6 pages DOI:10.4236/health.2013.56134
Differences in body components and electrical characteristics between youth soccer players and non-athletes
![]()
1Laboratory of Health Science & Nanophysiotherapy, Department of Physical Therapy, Graduate Scool, Yongin University, Yongin, South Korea
2Department of Physical Therapy, College of Public Health & Welfare, Yongin University, Yongin, South Korea; *Corresponding Author: junghwankim3@yongin.ac.kr
Copyright © 2013 Seung-Min Yang et al. This is an open access article distributed under the Creative Commons Attribution License, which permits unrestricted use, distribution, and reproduction in any medium, provided the original work is properly cited.
Received 18 March 2013; revised 20 April 2013; accepted 10 May 2013
Keywords: Body Components; Electrical Characteristics; Youth Soccer Players
ABSTRACT
Many previous studies have focused on youth soccer player injuries without body component analysis compared to non-athletes. Only a few studies which have investigated body components of youth soccer players, and studies that look at electrical characteristics used by rheobase and chronaxie as well as body components are even scarcer. Therefore, we feel that there is a need for a study investigating objective clinical analysis of the body components (body structure and body composition) and electrical characteristics of both youth soccer players and non-athletes. Sixty subjects participated in our study, comprising of thirty youth soccer players and thirty non-athletes. The Inbody 520 was used to measure and analyze body composition and the Duo 500 was employed to measure electrical characteristics. It was observed that the soccer players showed markedly lower total impedance compared to the non-athletes. In both legs, it was particularly noted that there were significant differences between the right and left sides. The soccer players showed a higher skeletal muscle mass and lean/ideal lean × 100% compared to the non-athletes. Furthermore, the soccer players had a lower rheobase and higher chronaxie. A comparison of the genders showed a similar pattern. In this study, we were able to separate the differences in body components and electrical characteristics between the subject groups using a systemic approach. Future studies on diverse types of athletes would contribute further to the development of clinical phy- siotherapy and sports rehabilitation.
1. INTRODUCTION
Soccer is the most popular sport in the world, with about 200 million participants including both sexes and all age groups [1]. Because of its popularity, it has often been suggested that soccer may help prevent or cure health problems round the world [2]. However, despite the perception that soccer is a relatively safe sport, it is one of the most common causes of sport injuries among youth [3]. Therefore, elite youth soccer players are exposed to the risk of a variety of sports injuries which may occur for a variety of reasons. It is important that therapists are accurate in testing and cautious in making decisions when treatment is required [4-6]. They also need to have a good understanding of the body composition of youth soccer players. Generally, athletes’ body components appear visually different to those of non-athletes. However, it needs to be said that the body system uniformly applied treatment for athletes is based on visual classification only [7,8]. Therefore, a more systemic and professional approach is required. In a previous study, it was found that body components of athletes may show different tendencies to those of non-athletes [8]; but there has been a lack of professional studies relating specifically to the body components of youth soccer players. Many athletes, including soccer players, commonly use electrotherapy because it is frequently used for the treatment of musculoskeletal disorders [8,9]. Electrical characteristics are generally important factors in electrotherapy because they affect electric strength, which increases the effectiveness of rehabilitation [10]. In our study, we focus mainly on physical therapy and whether it should be applied differently based on the differences shown to exist between athletes and non-athletes. In this way, we have contributed to current research relating to sports physical therapy and its clinical application.
2. MATERIALS & METHODS
2.1. Participants
From September 2012 to February 2013 all subjects were measured for their particular body structure, body composition and body electrical characteristics. 30 young soccer players were recruited from Y soccer center located in Korea. The criteria for their inclusion in the study were as follows: 1) Age: 17 - 20 years old; 2) Sex: male; 3) no skin problems or wounds; 4) no muscle pain or disorder. A further 30 non-athletes were recruited from Y university, also located in Korea. Criteria for their inclusion in the study were as follows: 1) Age: 17 - 22 years old; 2) Sex: male; 3) no skin problems or wounds; 4) no muscle pain or disorder.
2.2. Body Composition
All measurements taken for subjects were based on an empty stomach state, or two hours after each meal, after they had produced a stool sample, to ensure accurate body fat measurement. All subjects avoided excessive exercise and bathed to maintain body moisture. The Inbody 520 was used to measure the results and to ensure that the measurements were as accurate as possible, all subjects were required to stretch their arms [8] (Figure 1(A-a)).
2.3. Body Electrical Characteristics
Rheobase and chronaxie were measured using an electrical stimulator in the region of the vastus lateralis and vastus medialis muscles (Duo 500, Gymnauniphy Co., Belgium) (Figure 1). A rheobase measurement pad was applied to the regions of the vastus lateralis and vastus medialis muscles of subjects, who were in the sitting position, until the muscle contraction response became visible [10]. A chronaxie measurement pad was also applied to the same regions, until muscle contraction responses became visible using double the rheobase current intensity. After one side had been measured, subjects rested for 5 minutes; then, the process was repeated on the other side (Figure 1).
2.4. Statistical Analysis
The data are expressed as means ± standard errors (SE). A P value of < 0.05 was considered statistically significant. SPSS Version 18.0 (International Business Machines, Armonk, USA) for Microsoft Windows was
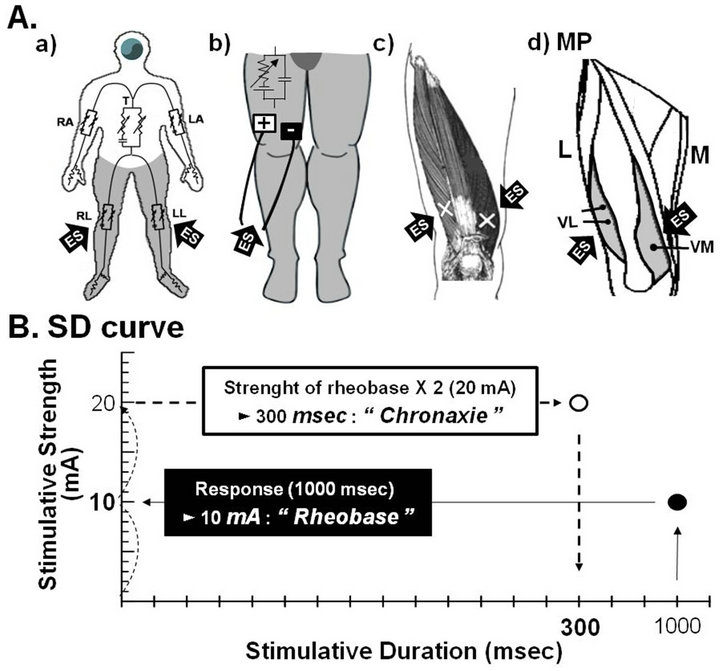
Figure 1. Schematic representation of the measurements of rheobase and chronaxie. In analysis of rheobase and chronaxie, the thigh was stimulated using the electrical stimulator and two surface electrodes of the same size for bipolar stimulation. Rheobase and chronaxie were measured using monofilaments, as described in the Materials & Methods. RA, right arm; T, trunk; LA, left arm; RL, right leg; LL, left leg; +, anode; −, cathode; →, region of stimulation in anterior parts of thigh; VL, vastus lateralis; VM, vastus medialis; ES, electrical stimulation; MP, motor point; M, medial side; L, lateral side; SD curve, strengthduration curve.
used for analysis in this study. The protocol for the study was approved by the Committee of Ethics in Research of the University of Yongin, in accordance with the terms of Resolution 5-1-20, December 2006.
3. RESULTS
The soccer player subjects markedly showed a lower total impedance (202.7 ± 7.8 Ω) compared to the non-athletes (221.7 ± 12.9 Ω) (Figure 2(A-a)). In both legs, there was a particularly significant difference between right (young soccer players: 204.0 ± 6.4 Ω nonathletes: 236.2 ± 11.2 Ω) and left sides (young soccer player: 206.7 ± 6.7 Ω non-athletes: 239.5 ± 10.5 Ω) (Figure 2(A-b)). The soccer players (11.1±1.1 kg) showed higher skeletal muscle mass in comparison with the non-athletes (10.1 ± 1.7 kg) (Figure 2(B-a)), especially in both legs, where there was a significant difference between right (young soccer players: 11.0 ± 0.2 kg, nonathletes: 9.6 ± 0.3 kg) and left sides (young soccer players: 11.0 ± 0.2 kg, non-athletes: 9.5 ± 0.3 kg) (Figure 2(B-b)). Furthermore, the soccer players showed higher lean/ideal lean × 100% (113.3% ± 0.9%) than non-athletes (106.9% ± 1.0%) (Figure 2(C-a)). Again, in both legs, it could be seen that there was a significant difference between right (young soccer players: 119.7% ±
1.4%, non-athletes: 108.4% ± 1.5%) and left sides (young soccer players: 118.8% ± 1.4%, nonathletes: 107.5% ± 1.9%) (Figure 2(C-b)). The soccer players also showed lower rheobase and higher chronaxie compared to the non-athletes (Figure 3(A)). However, all subjects showed no significant differences on rheobase and chronaxie (Figures 3(B-a) and (C-a)). A gender comparison for the same values showed a similar pattern (Figures 3(B-b) and (C-b)).
4. DISCUSSION
Soccer is a sport that is based on power and elaboration of the lower extremities [11]. It necessitates the sudden redirection of the body when following the ball and a player has to run to achieve a good position when in attack or defense. It also requires that a ball is kicked in order to shoot or pass using a combination of strength and finesse [12]. Therefore, a professional soccer player’s body may be thought to be different to that of a non-athlete, especially in terms of the significant difference between the lower extremities in comparison to the remainder of the body structure. Soccer is also one of the most common causes of injuries such as musculoskeletal disorders of the lower extremities. That is why it was thought that professional soccer players suffer from many of these disorders. We focus our research on this area and in particular on the youth soccer player. A young soccer player’s body is slightly different to that of a professional soccer player. However, there are differences in non-athletes of a similar age. There had been few studies performed which particularly focus on the physical therapy of youth soccer players, and as a result, all of our measurements strictly dealt with the differences between youth soccer players and non-athletes. In terms of physical fitness, body composition is used to explain the percentages of fat, bone and muscle in human bodies. Because muscular tissue takes up less space in our body than fat tissue, our body composition, as well as our weight, determines our leanness. Two people of equal height and body weight may look totally different from each other because they have a different body composition, which is derived from many factors. First, birth weight and weight trajectories up to 24 months, associated with particular adult body composition (especially fat-free mass) [13]. Second, physical activity and particular body composition are related in adolescents [14]. It has also been found that body composition is associated with the aging process, having a tendency to

Figure 2. Differences in body composition between the general public and volunteer soccer athletes. Body composition was determined, as described in the Methods. Rt, right side; Lt, left side; Skeletal MM, skeletal muscle mass; Segmental MM, segmental muscle mass. *, significantly different from non-athletic controls with P < 0.05.
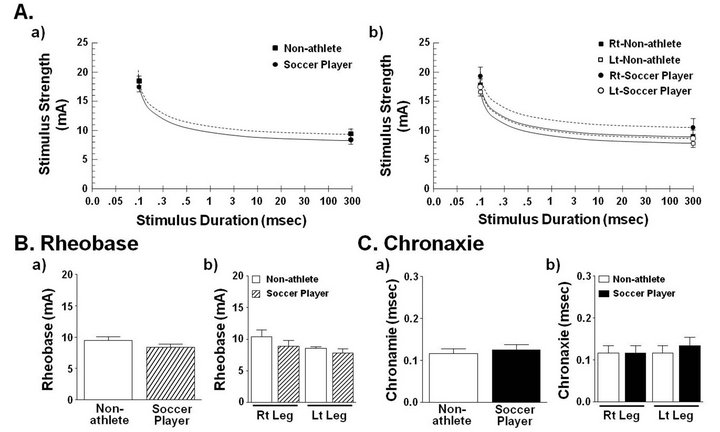
Figure 3. Difference in the rheobase and chronaxie between youth soccer players and non-athletes. Rheobase and chronaxie were measured to regions of vastus lateralis and medialis muscles. Rheobase and chronaxie were measured using monofilaments, as described in the Materials & Methods. Rt, right side; Lt, left side.

Figure 4. Schematic representation of the differences in body composition and electrical characteristics and of the significance of physical therapy between youth soccer players and non-athletes. SMM, skeletal muscle mass; ↑, increase; ↓, decrease; RA, right arm; T, trunk; LA, left arm; RL, right leg; LL, left leg.
gain fat mass and lose lean tissue in both bone and muscle, even when the weight does not change [15]. Measuring body composition in humans is usually carried out in response to the need to describe either deficiencies or excesses of a component that is thought or known to be related to health risk [16]. Many of the previous conventional body composition measurement methods are based on assumptions that are violated in the very obese state [17]. According to our results, the soccer players show significant differences in some parts, especially in the lower extremities. These differences have great implications. Upon assessing our measurements, we had to approach youth soccer player rehabilitation in a different way to the rehabilitation of non-athletes. In electrotherapy, which is frequently used for the treatment of youth soccer players, the differences of body components were considered important. The soccer players that had low fat and much skeletal muscular mass had to have more electrotherapy application time. In terms of body electrical characteristics, our results revealed a number of important things. Each person has their own body electrical characteristics and in order to understand these, we used rheobase and chronaxies in our measurements. Rheobase is a measure of membrane excitability. In neuroscience, rheobase is the minimal current amplitude of infinite duration (in a practical sense, about 300 milliseconds)
that results in the depolarization threshold of the cell membranes being reached, such as an action potential or the contraction of a muscle [18]. Chronaxie is the minimum time required for an electric current double the strength of the rheobase, to stimulate a muscle or a neuron. Chronaxie, a historically introduced excitability time parameter for electrical stimulation, has been assumed to be closely related to the time constant of the cell membrane [19]. That is why the differences of body electrical characteristics when electrotherapy is employed are important. Rheobase and chronaxie are commonly accepted as the principle parameters predicting the efficacy of electric stimulation [20]. This means that youth soccer players require a lower strength compared to non-athletes on application electrotherapy. Based on the results of our study, we can provide an important basis for selection of electric strength when applying electrotherapy on youth soccer players. In other words, the youth soccer players require less electric strength for rehabilitation or therapy compared to non-athletes (Figure 4). It is necessary to consider taking this into account prior to applying electrotherapy [21,22]. The major limitation of this study is the lack of measured information about other types of athlete. However, through a systemic and professional approach, we can be accurate in testing and cautious in making decisions when treatment is needed. Importantly, we can develop a tailored rehabilitation program and accomplish an effective electronic therapy treatment. If future studies are performed including diverse types of athletes, then they will further contribute to the development of clinical physical therapy and sports physiccal therapy in particular.
REFERENCES
- Giza, E., et al. (2005) Injuries in women’s professional soccer. British journal of Sports Medicine, 39, 212-216. doi:10.1136/bjsm.2004.011973
- Fuller, C.W., et al. (2010) “Football for health”—A football-based health-promotion programme for children in South Africa: A parallel cohort study. British journal of Sports Medicine, 44, 546-554. doi:10.1136/bjsm.2010.072223
- Melissa, A., et al. (2010) Soccer injuries in female youth players: Comparison of injury surveillance by certified athletic trainers and internet. Journal of Athletic Training, 45, 238-242. doi:10.4085/1062-6050-45.3.238
- Giombini, A., et al. (2007) Hyperthermia induced by microwave diathermy in the management of muscle and tendon injuries. British Medical Bulletin, 83, 379-396. doi:10.1093/bmb/ldm020
- Kim, I.H., et al. (2012) The effect of an early lumbar exercise program on trunk strength and the Oswestry disability index after herniated nucleus pulposus surgery. Journal of Physical Therapy Science, 24, 165-168. doi:10.1589/jpts.24.165
- Kim, J.H., et al. (2012) Change of muscular activity and dynamic stability of the knee joint due to excessive and repetitive jumping or cutting by female athletes. Journal of Physical Therapy Science, 24, 715-719. doi:10.1589/jpts.24.715
- Lee, W.D., Lee, L.K., Kim, B. and Kim, J. (2012) Differences in body components and the significance of rehabilitation for taekwondo athletes compared to nonathletes. Toxicology and Environmental Health Sciences, 4, 203- 208. doi:10.1007/s13530-012-0137-2
- Kim, M.Y., Kim, J.H., Kim, B. and Kim, J. (2011) Comparison study on the daily performance capability and body fat percentage for a healthy life among elderly people using a senior welfare center. Toxicology and Environmental Health Sciences, 3, 120-128. doi:10.1007/s13530-011-0087-0
- Lee, W.D., et al. (2013) Differences in rheobase and chronaxie between the paretic and non-paretic sides of hemiplegic stroke patients: A pilot study. Journal of Physical Therapy Science, 25, in press.
- Medlicott, M.S. and Harris, S.R. (2006) A systematic review of the effectiveness of exercise, manual therapy, electrotherapy, relaxation training, and biofeedback in the management of temporomandibular disorder. Physical Therapy, 86, 955-973.
- Kuzawa, C.W., et al. (2012) Birth weight, postnatal weight gain, and adult body composition in five low and middle income countries. American Journal of Human Biology, 24, 5-13. doi:10.1002/ajhb.21227
- Hallal, P.C., et al. (2012) Bidirectional cross-sectional and prospective associations between physical activity and body composition in adolescence: Birth cohort study. Journal of Sports Sciences, 30, 185-192. doi:10.1080/02640414.2011.631570
- Dallinga, J.M., Benjaminse, A. and Lemmink, K.A. (2012) Which screening tools can predict injury to the lower extremities in team sports? A systematic review. Sports Medicine, 42, 791-815.
- Lees, A., et al. (2010) The biomechanics of kicking in soccer: A review. Journal of Sports Sciences. 28, 805-817. doi:10.1080/02640414.2010.481305
- Gallagher, D., et al. (2000) Weight stability masks sarcopenia in elderly men and women. Endocrinology and Metabolism: American Journal of Physiology, 279, E366- E375.
- Lee, S.Y. and Gallagher, D. (2008) Assessment methods in human body composition. Current Opinion in Clinical Nutrition & Metabolic Care, 11, 566-572. doi:10.1097/MCO.0b013e32830b5f23
- Gallagher, D. and DeLegge, M. (2011) Body composition (sarcopenia) in obese patients: Implications for care in the intensive care unit. JPEN Journal of Parenteral and Enteral Nutrition, 35, 21S-28S. doi:10.1177/0148607111413773
- Ashley, Z., et al. (2005) Determination of the chronaxie and rheobase of denervated limb muscles in conscious rabbits. Artificial Organs, 29, 212-215. doi:10.1111/j.1525-1594.2005.29037.x
- Rattay, F., Paredes, L.P. and Leao, R.N. (2012) Strengthduration relationship for intraversus extracellular stimulation with microelectrodes. Neuroscience, 214, 1-13. doi:10.1016/j.neuroscience.2012.04.004
- Efimov, I.R. (2009) Chronaxie of defibrillation: A pathway toward further optimization of defibrillation waveform? Journal of Cardiovascular Electrophysiology, 20, 315-317. doi:10.1111/j.1540-8167.2008.01330.x
- Jeon, H.J., Kim, J.H., Kim, B. and Kim, J. (2012) Analysis of high-frequency transcutaneous electrical nerve stimulation-induced sensory threshold from the elderly people for healthy life. Toxicology and Environmental Health Sciences, 4, 167-172. doi:10.1007/s13530-012-0132-7
- Jeon, H.J., et al. (2012) Changing the sensory threshold of elderly people through low-frequency, high-voltage acupoint electrical stimulation. Toxicology and Environmental Health Sciences, 4, 277-283. doi:10.1007/s13530-012-0147-0