Engineering
Vol. 4 No. 4 (2012) , Article ID: 18835 , 13 pages DOI:10.4236/eng.2012.44029
Mixing and Segregation Characteristics of Binary Granular Material in Tapered Fluidized Bed: A CFD Study
Jadavpur University, Kolkata, India
Email: *h.k.sutar@gmail.com
Received February 21, 2012; revised March 9, 2012; accepted March 20, 2012
Keywords: Mixing; Segregation; Tapered Fluidized Bed; CFD Simulation
ABSTRACT
The particle flow pattern, mixing and granule segregation in a tapered fluidized bed have been studied along with the hydrodynamics. At first the bed of varying total mass and granule fractions is fluidized then the bed is defluidized to freeze the composition, the bed is sectioned to layers and the composition in each layer is determined by sieving. Materials used in the present study are dolomite and glass beads with different B.S.S Sizes. A series of unsteady, three fluid CFD simulations were performed using FLUENTTM 6.2. Simulation parameters viz. solution technique, grid, maximum packing fraction and operating conditions like gas velocity were investigated for relative effects on particle mixing and segregation. Good arrangement of solid volume fraction profile was obtained between the experimental results and simulation results for regular particles.
1. Introduction
One of the most prominent features of fluidized beds is either ability to mix and segregate. This of great importance for a variety of processes in industries. Knowledge of particulate mixing and segregation would be highly useful in the design of fluidized bed reactors as well as in the determining mass transfer, heat transfer, reaction rates, erosion and concentration profiles. For example the surface renewal rate is important in “top down” spraying granulation.
Mixing of solids in cylindrical and rectangular fluidized beds has focused earlier because of their use in industry and for practical experimentation. Tapered bed is preferred in unit operations like granulation, dry coating. A velocity gradient exists in the axial direction in tapered bed leading to unique dynamic characteristics of the bed. Due to this characteristics, tapered fluidized beds have found applications in waste water treatment [1], roasting sulphide ores [2] and food processing [3] etc. Tapered fluidized beds are very useful for fluidizing materials with a wide particle size distribution as well as for exothermic reactions [4]. They can be operated with less pressure fluctuation [1] and also for extensive particle mixing [5].
Much development and design of tapered fluidized bed reactors are still limited for the complex behavior of gassolid flow making flow modeling challenging task. In addition, numerical solutions of complex non-linear equations, with moving phase boundaries are difficult to obtain.
CFD is used for predicting the quantitative results, when fluid flows, in operations involving simultaneous flow of heat, mass transfer, phase change (e.g. melting, freezing), chemical reactions (e.g., combustion), mechanical movement (e.g., piston and fans), stress and displacement etc. of the various modeling tools, computational fluid dynamics (CFD) is most promising for future fluidized bed modeling. CFD is intended to include the key mechanisms of importance to predict accurate flow and other characteristics of fluidized bed for design, scale up and optimization. The detailed predictive simulations using CFD make modeling more accurate and faster. Conventional scaling laws can be used to design a fluidized bed, either larger or smaller, with hydrodynamic similarity. However, similarity of mixing segregation phenomena is not guaranteed. Hence simulations become the only potential tool useful for scaling fluidized beds used for fluidization of multi-components systems.
2. Literature Review
2.1. Theoretical
Tapered fluidized beds have many attractive features, among which are their capabilities for handling particles with different sizes and properties [6] and for achieving extensive particle mixing [7]. The flow regime of partial fluidization and pressure drop characteristics in gas solid tapered beds of apex angles 30˚ & 45˚ is reported [8], consisting of single size particles of glass beads ranging from 274 μm to 650 μm. An empirical equation derived for prediction of pressure drop at critical fluidization velocity for gas solid fluidized beds [9]. The study of bed expansion ratio of Gedart D particles using tapered vessels of apex angles ranging from 3.82˚ to 45.24˚ and equation has been proposed for bed expansion ratio [10]. Studies carried out in a tapered fluidized bed reactor and empirical methods proposed for determination of expanded bed height by using static pressure and wall surface temperature [3].
The mixing and segregation in classical and tapered fluidized beds is reported [11]. This is based on the reviews [12].
It is well known that mixing degree of solids in a binary fluidized bed with a constant cross-section is always between extremes, i.e. complete separation and complete mixing of the solid phases. Completely separated binary fluidized beds consist of two distinct fluidized layers, each containing one type of particle only. Conversely particles of each type are distributed uniformly over the entire solid phase volume in well mixed beds.
The new visual observation of the formation of segregation patterns in fluidized binary systems shows that a bed consisting of a mixture of particles of different sizes can have a variety of different structures depending on the gas flow through out. Their effect on the particles differs according to the local proportions of each component of mixture. Segregation can be persist when the gas flow rate is sufficiently large to fluidize the entire bed. Under such conditions it can be shown that the segregation can be successfully modeled by drawing an analogy with the sedimentation of particles from a turbulent flow field. The experimental results suggest that the efficiency of mixing by the bubbles in a fluidized bed is very less than for gas bubbles in a liquid.
2.2. Fluidization and Segregation in Binary Mixtures
Fluidization behavior of a binary mixture strongly affected by fines (smaller particles) as long as they constitute higher than 30% by volume [13]. The effect is shown in Figure 1 where the minimum fluidization velocity UmfM of a binary mixture is plotted against the fraction of big particles. When concerning the fluid bed agglomeration process, it is expected that the behavior of the bed during the agglomeration process will depend to a large extent on the primary particles in the early stage of the process.
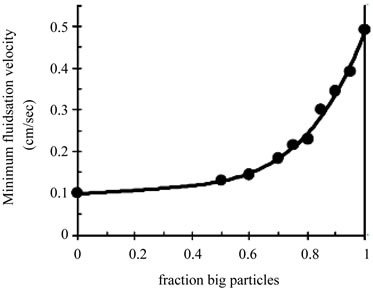
Figure 1. Minimum fluidization of a binary mixture of fines and coarse particles measured by P. N. Rowe and A. W. Nienow, 1975.
Bellow that volume % they can no longer fill the interstitial space between the larger particles. Thus for fluidized bed granulation process, it is expected that the b-e havior of the bed during the granulation process will mainly depends on the primary particles during the early stages of the process.
Segregation used to occur when a bed contains particles with different physical properties like density and size. Jetsam is the component that tends to segregate to the bottom of the bed and that tending to float is called flotsam [14]. Various mechanisms for segregation have been proposed [15].
For segregating fluidized bed the concentration of jetsam in the upper stratum of a strongly segregating bed at steady state is determined solely by the depth of the jetsam layer, the fluidization velocity and the particle properties, especially the minimum fluidization velocity of two components. A correlation based on the independent variables is given by.
 (1)
(1)
where  depth of jetsam layer,
 = mass fraction of jetsam in the bed,
 Mass fraction of flotsam in the bed,
X = ratio of mj to mf ,
Є = void fraction in bed,  = density of jetsam.
Visual observation of individual particle behavior of group B powders shows that particles are most of the time immobile in a structure like arrangement while being fluidized [16], and this structure is able to support particles that are denser than the bulk bed particles. Shearing of the structure by fluidization bubbles rising in the vicinity gives individual denser particles the opportunity to descend.
In general denser and larger particles will tend to act as jetsam, if both density and size differ between two fractions present in the bed; density will have the dominating effect, except in very special case [12].
Literature provides several relations for quantifying the segregation [13,17-19]. Introduction of the term “segregation distance” Ys [18] and is the measure of the amount of segregation of a given particle fraction in the bed caused by the passage of one fluidization bubble. J. C. Bosma and A. C. Hoffman (2003) rearranged the original relation of H. Tanimoto et al. (1981),
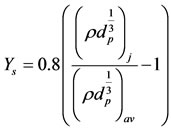 (2)
(2)
where ρ and dp are the particle density and diameter, respectively, & subscripts j and av signify the jetsam & the volumetric averages, respectively.
It is found for a binary system [17], that the fraction jetsam in the uniform mid section of the bed (xmid.j) can be described with:
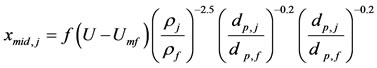 (3)
(3)
where subscript f signifies the flotsam fraction. Both of these relations show how the density dominates the particle size in determining the extent of segregation. Depending on the local composition of the bed material, a certain fraction of particles may change character, from jetsam to flotsam or vice versa [20].
When one fraction of particles, e.g. granules, is much larger than the other, e.g. the primary particles, there is, however, a simpler way of looking at the issue of segregation. Large object, with a volume Vg in a fluidized bed of particles with volume Vp will experience the macroscopic (on a large scale compared to the small particles) pressure gradient in the bed if Vg ≥ 30 Vp [21], and will therefore experience a buoyancy force, Fb and given by
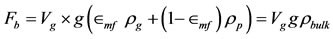 (4)
(4)
where subscript g signifies the fluidizing gas, and we have defined the bulk density, of the emulsion phase. Comparing this with the force of gravity acting on the large particles is Vggρg, where ρg is the envelope density (thus including any internal pores) reveals whether the large particles will act as flotsam or jetsam in the bed.
2.3. Particle Flow and Mixing and Segregation in a Tapered Fluidized Bed
As mentioned above, investigations of particle mixing in fluidized beds have been performed mostly in cylindrical or rectangular beds, and to some extent in tapered beds with small air inlets operated in the spouted region. Little research has done on bubbling fluidizing regime of a tapered bed [8,22].
The main difference between tapered fluidized beds and other fluidized beds is that in the former the fluidization velocity decreases axially. Thus according to conventional wisdom, and the two phase theory given above, the bubbling intensity, and therefore particle mixing, should decrease when moving up the bed. However tapered beds do not act entirely in this way. Three flow regimes in tapered beds (Figure 2) are distinguished [23]. when regime prevails depends on the fluidization velocity and the bed geometry, in particular the cone angle. H. Toyohara & Y. Kawamura (1991) considered the completely fluidized state (Figure 2(c)) to be completely mixed as in a normal vigorously fluidized bed. The bulk movement of solids and coalescence of bubbles are thus different in tapered fluidized bed, but the mechanisms of bubble and wake formation are expected to be the same as in cylindrical beds.
The type of segregation in the tapered bed would be expected to be same as in a straight bed.This was borne out in experiments [24], and shown in phase diagram in Figure 3. At low flow rates ,the bed is static,above the mixture UmfM, vertical segregation takes place, at higher gas flow rates, horizontal segregation takes place, when the gas flow rate is larger enough,the bed is well mixed.
Though the classification of segregation structures is broadly the same as for the straight sided bed , there are some distinct features for the tapered bed which reflects its heterogeneous character. First there is the presence of region IV, shown in Figure 3, intermediate between a purely horizontal segregationpattern & a well mixed bed. In region IV, there is still a layer of coarse particles on the base of the bed, the thickness of which decreases with increasing flow rate;however it also forms a near vertical layer along the edge of the aerated regions at either edge of the bed. As shown in the Figure 3 the growth of these near vertical regions is slow and can take place in the
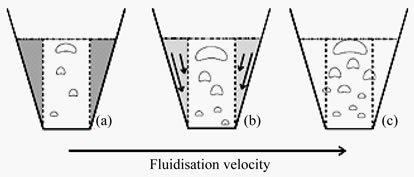
Figure 2. Three regimes of a tapered fluidized bed. (a) Fluidization takes place in the core of the bed only, outside the core the bed is fixed; (b) Fluidization takes place in the core only, outside the core the bed material moves downword; (c) The complete bed is in amixed state with no clear boundary between the upward and downword movement of solids.
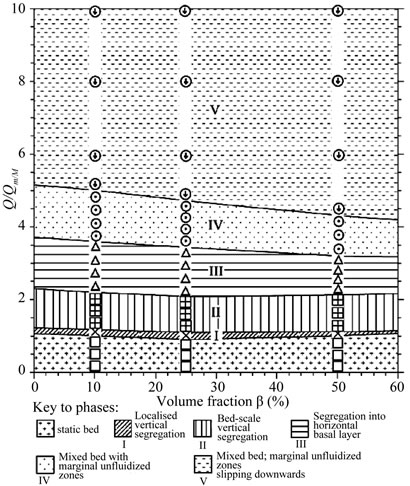
Figure 3. Phase diagram for segregation in a tapered fluidized bed predicted by T. M. Gernon, M. A. Gilberton and R. S. J. Spark (2010).
non-fluidized regions at the edge of the bed. The size of the near vertical regions increases with angle of taper.
A further difference between the phase diagram for segregation in the tapered bed compared with that in a straight sided bed is that all dependence on gas flow rate has been eliminated, notably for the transition between vertical segregation (region: II) and horizontal segregation (region: III). Furthermore, the gas flow rate at which the bed becomes well mixed is increases by 25% (roughly the width of the region IV in Figure 3).
3. Experimental Aspect
We describe here first the fluidized bed equipment with their parts. The schematic diagram of the experimental set-up is shown in Figure 4. The procedure of experiments, the computational mixing and segregation characteristics are described later.
3.1. Experimental Set-Up
Air compressor: A multistage air compressor of sufficient capacity is involved.
Air receiver: It is a horizontal cylinder used for storing the compressed air from compressor. There is one G.I pipe inlet to the receiver and one by-pass from one end of the cylinder. The exit line is also a G.I line taken from the central part of the cylinder. The purpose for using air accumulator in the line is to dampen the pressure fluctua-
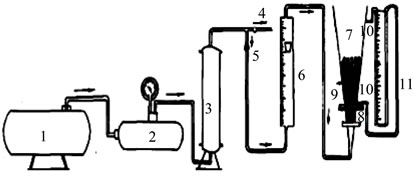
Figure 4. Schematic diagram of experimental set up. 1. Compressor; 2. Reciever; 3. Silica gel tower; 4. By pass valve; 5. Line valve; 6. Rotameter; 7. Conical fluidizer; 8. Glass beads packing; 9. Glass beads in fluidized state; 10. Pressure taps to manometer; 11. Support Stand (panel board) for manometer.
tions. The accumulator is fitted with a pressure gauge. The operating pressure in the cylinder is kept at 20 psig.
Air Distributor: Air distributor is a perforated plate made of G.I sheet. The pores of 0.5 cm diameter are randomly placed on the sheet. The distributor is an integral part of calming section where it is followed by a conical section. The inside hollow space of the distributor is filled with glass beads of 1.5 cm outer diameter, for uniform air distribution.
Conical fluidizer: The fluidizer consists of transport Perspex column with one end fixed to flange. The flange has 6 bolt holes of 1.2 cm diameter. Two pressure tapings are provided for noting the bed pressure drop. Screen is provided in the lower flange of the fluidizer and the conical air distributor.
Quick opening valve and control valve: A globe valve of 1.25 cm inner diameter is attached next to the pressure gauge for sudden release of the line pressure. A gate valve of 15 mm inner diameter is provided in the line to control the airflow to the bed.
Manometer panel board: One set of manometer is arranged in the panel board to measure the pressure drop. Carbon tetrachloride is used as manometric fluid.
Vacuum Pump: The vacuum pump is used to draw the material from the bed during mixing-segregation experiments.
3.2. Apparatus Data
The tapered column was made of Perspex sheets (Figure 5) to allow visual observation. The inlet diameter was 45 mm where as the outlet diameter was 177 mm. The reactor height is 545 mm. The tapered angle is 6.9˚. A 60 mesh screens at the bottom served as the support as well as the distributor. The calming section of the bed was filled with glass beads for uniform distribution of fluid. Two pressure taps, one at the entrance and other at the exit section of the bed were provided to record the pressure drops. Pressure drop is measured by manometer, which is one meter long. Carbon tetra chloride (density =
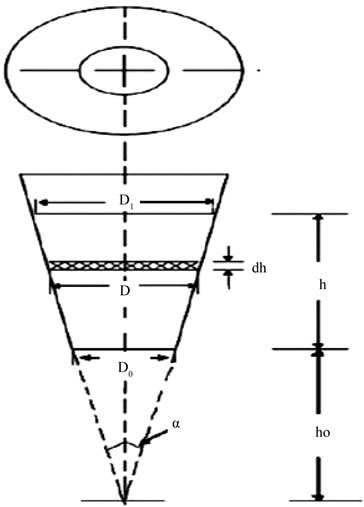
Figure 5. Schematic diagram of the structure of tapered bed.
1594 kg·m–3) was used as the manometric fluid. Air at a temperature of 28˚C (ρ = 1.17 kg·m–3 & μ = 1.8 × 10⁵ kg·m–1·s–1) used as the fluidizing medium was passed through a receiver and a silica gel tower to dry and control the air flow rate before being sent through the tapered column. Two rotameters one for the lower range (0 - 20 m3/hr) and the other for the higher range (20 - 120 m3/hr) were used to measure the air flow rates. The vacuum pump is used to draw the material from the bed during mixing-segregation experiments.
4. Experimental Procedure
4.1. Hydrodynamics, Mixing & Segregation
A weighed amount of material is charged to the bed .The initial stagnant bed height is recorded. Then air flow rate was increased incrementally allowing sufficient time to reach a steady state. The rotameter and manometer readings are noted for each increment in flow rate & pressure drop and superficial velocity calculated. When the minimum fluidization was attained, the expanded static bed height is measured. As the bed fluctuates between two limits of gas-solid fluidization, heights of the upper and lower surfaces of the fluctuating bed were measured for each fluid velocity higher than the minimum fluidization velocity.
After fluidization the bed with a particular fluid mass velocity, it was brought to static condition by closing the air supply. The bed then is divided into different layers each of 2 cm height. Each of the layers was drawn applying suction and analyzed for the amount of jetsam particles. Such a system is referred as the static bed condition.
4.2. Initiation
The initial bed of solids is packed into the bottom of the bed. The initial concentrations of materials of both sizes are based upon the maximum packing fraction for the materials. The specified volume fraction of solids in the bed is initially 0.01 less than the maximum solids packing fraction. If the initial solids fraction is too high, then coverage problems will occur. If the initial solids are much smaller than the maximum packing fraction, then settling will occur before fluidization. The initial condition patched was that of perfectly mixed solids throughout.
5. Material Properties
In order to simplify the physical experiments, the system is described by using a single gas phase and two granular phases. Each granular phase has a single density and a single particle size. Additional particle sizes would increase the number of phases & computational complexity of the problem. The physical properties of both the gas and solid phases are tabulated in Tables 1 and 2.
6. CFD Analysis Using FLUENTTM 6.2
6.1. Grid, Mesh & Solver
A two dimensional (2D) grid is used; using a CAD programme called GAMBIT 2.0. 30 and exported into FLUENTTM 6.2.16. The simulated bed contains a gas jet on the bottom of the bed. Along the horizontal and vertical directions, the grid size is 0.001 mm, resulting in a total of 85,491 cells. Additionally, the grid is divided into a lower zone and an upper zone for the purpose of specifying initial conditions. A zero time lower zone is filled with solids at an appropriate volume fraction, while the upper zone contains no solids initially. In order to model the transient nature of a bubbling fluidized bed, a non-
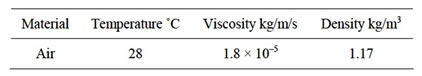
Table 1. Properties of gas phase.
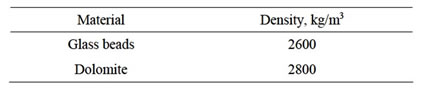
Table 2. Material properties of sold phase.
steady state, Eulerian multiphase model is used.
6.2. Boundary Conditions
The inlet was designated as velocity inlet in FLUENTTM, where the direction of gas flow is normal to the surface. The flow rates used for inlet are determined from the superficial gas velocity required. No solids are introduced through the nozzles. The effects of superficial gas velocity on mixing are investigated by changing this velocity in simulations. The top of the bed was set as a constant pressure outlet, and the walls are all set as no slip walls.
6.3. Iterations
A time step of 0.001 s to 0.0002 s with 20 iterations per time step was choosen. This iteration was adequate to achieve convergence for the majority of time steps. The relative error between two successive iterations was specified by using a convergence criterion of 0.001 for each scaled residual component.
7. Results
7.1. Fluidization Using Different Material
1) For single size material:
The single size materials like dolomite and glass beads are used in experimentation and their characteristics and operating parameters are tabulated in Tables 3 and 4.
2) For multi size material:
The multi size materials used in the present study is dolomite with B.S.S sizes –8 + 12 and –12 + 14 with initial static bed height of 13 cm. The experimental conditions and their readings are shown in Tables 5-6.
7.2. Mixing & Segregation Properties
The mixing and segregation characteristics have been studied using dolomite and glass beads. The detailed segregation characteristics like static bed height, segregated bed height and their weight % has extrapolated in Tables 7-9.
8. Discussion & Conclusion
The hydrodynamic behavior of fluidization in tapered beds is best described by the plot of pressure drop across the bed versus superficial velocity of the fluid at the entrance. The results shown in Figures 6-11, where the pressure drop increases with the increasing superficial gas velocity. The pressure drop reaches a maximum, where the transition from fixed bed to partially fluidized bed occurs. At this point the velocity is called critical fluidization velocity. Then the pressure drop starts to decrease with increase of superficial gas velocity and goes to a point where further increase in gas velocity keeps the bed pressure drop constant.
The two dimensional grid (Figure 12) and its adaption region is shown in Figure 13. The CFD results for the contours of solid & gas volume fraction along the length of the column are shown. The contours are extrapolated in Figures 14-17. The results obtained are useful in determining the material distribution in the column and also the pressure drop variations. Results shows that for bellow fluidization velocity, the solids did not move much
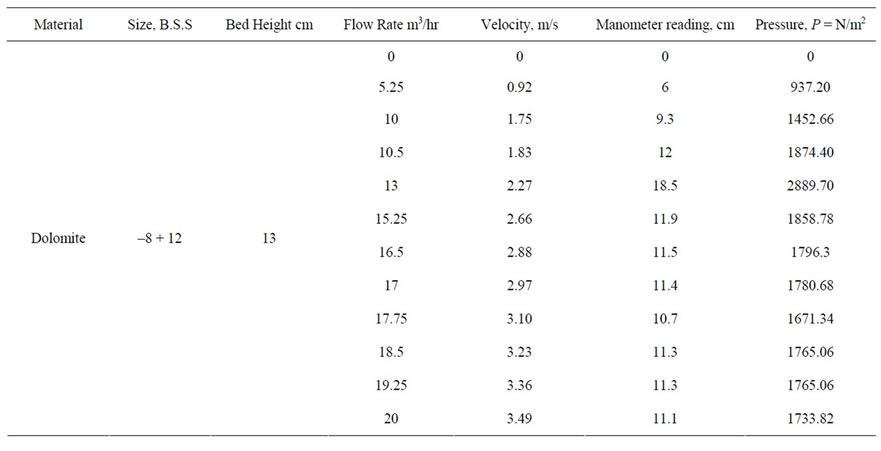
Table 3. Operating parameters for dolomite of –8 + 12 mesh size.
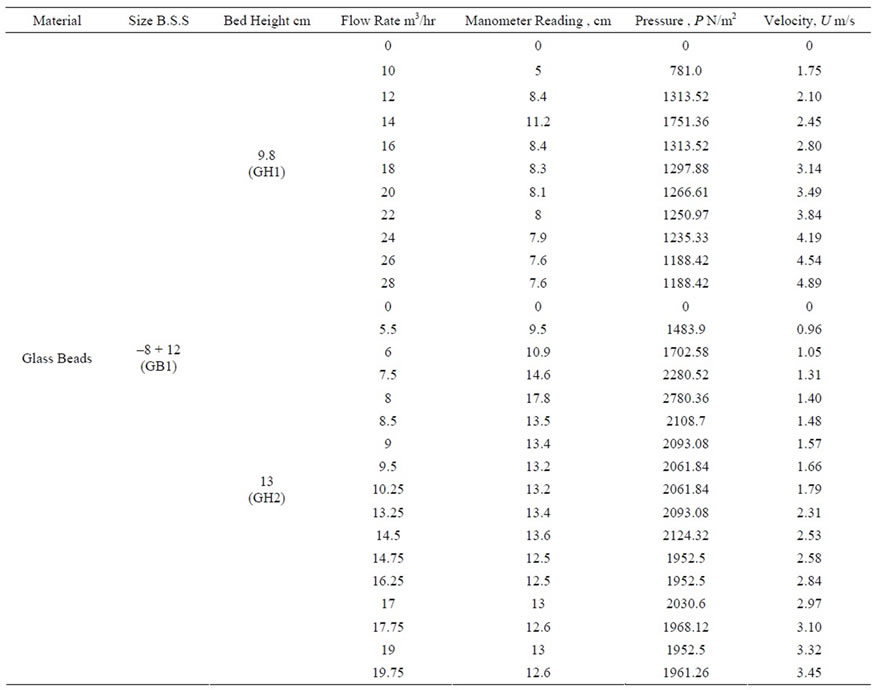
Table 4. Operating parameters for glass beads of –8 + 12 mesh size.
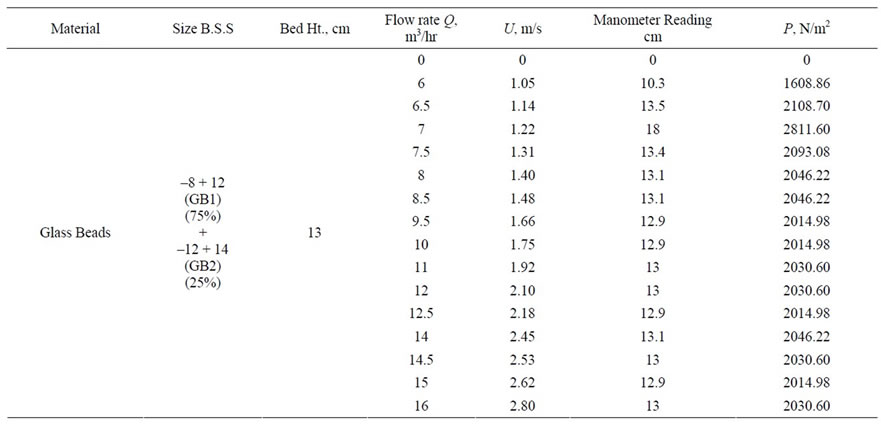
Table 5. Operating parameters for glass beads of GB1 and GB2 with bed height 13 cm.
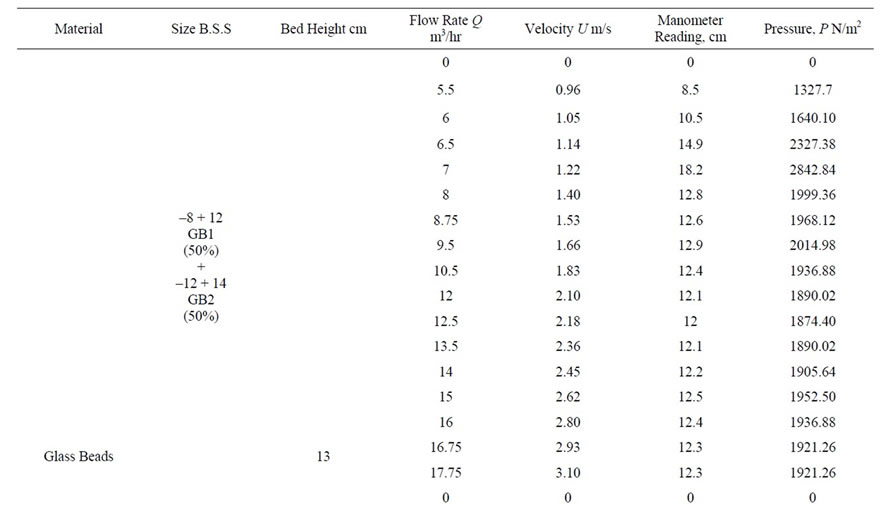
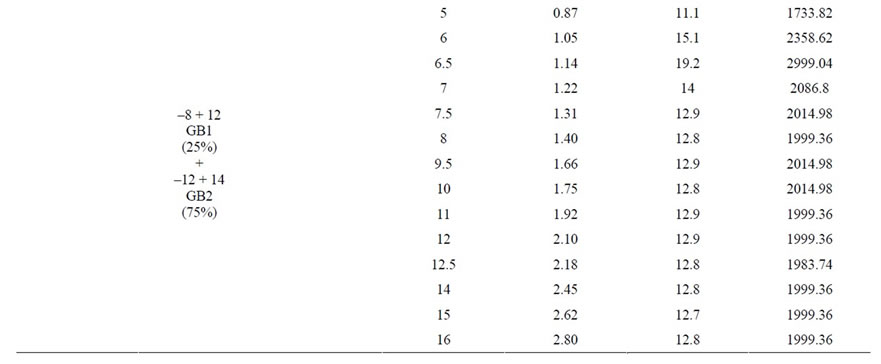
Table 6. operating parameters for mixture of glass beads for GB1 (50%) + GB2 (50%) and GB1 (25%) + GB2 (75%) with bed height 13 cm.
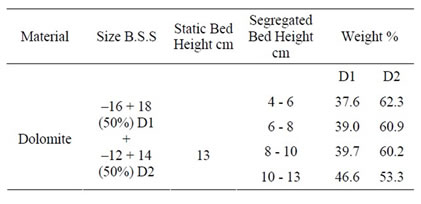
Table 7. Characteristics for dolomite with static bed height 13 cm.
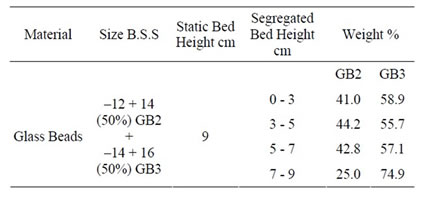
Table 8. Characteristics for glass beads with static bed height 13 cm.
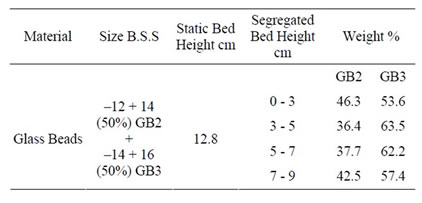
Table 9. Characteristics for glass beads with static bed height 12.8 cm.
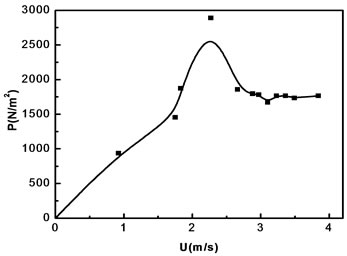
Figure 6. ∆P vs. U plot for dolomite of –8 + 12 mesh size.
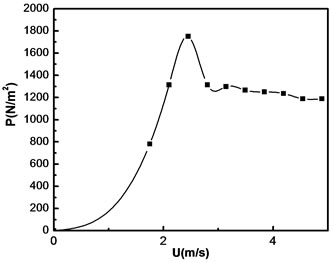
Figure 7. ∆P vs. U plot for glass beads of –8 + 12 mesh size (GH1).
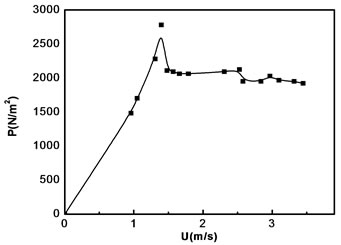
Figure 8. ∆P vs. U plot for glass beads of –8 + 12 mesh size (GH2).
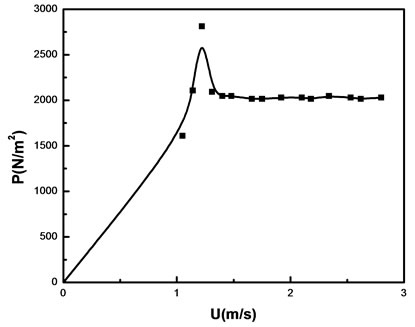
Figure 9. ∆P vs. U plot for a mixture of glass beads of GB1 (75%) and GB2 (25%).
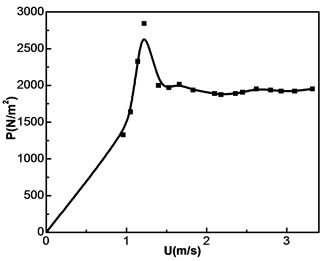
Figure 10. ∆P vs. U plot for a mixture of glass beads of GB1 (50%) and GB2 (50%).
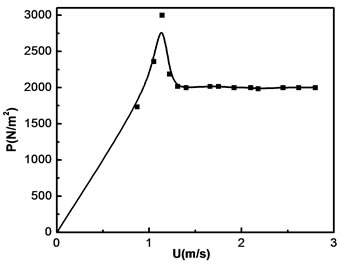
Figure 11. ∆P vs. U plot for a mixture of glass beads of GB1 (25%) and GB2 (75%).
and pressure drop increases. For minimum fluidization velocity, the diagram shows bed lifting after some time steps.
From the experimental results obtained, it shows that pressure drop across the bed increases with increasing in stagnant bed height. The critical fluidization velocity for
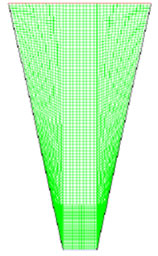
Figure 12. Grid Generated using GAMBIT 2.0.30.
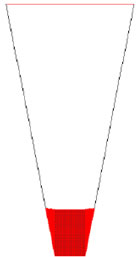
Figure 13. The adaption region.
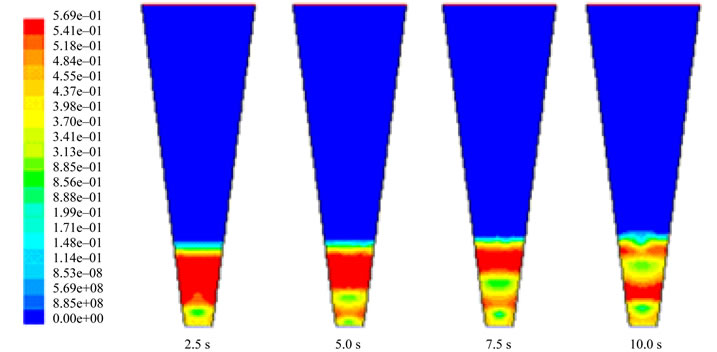
Figure 14. Simulated solids volume fraction profile of glass beads of 2D bed at minimum fluidization condition (U = UmfM i.e. 2.41 m/s).
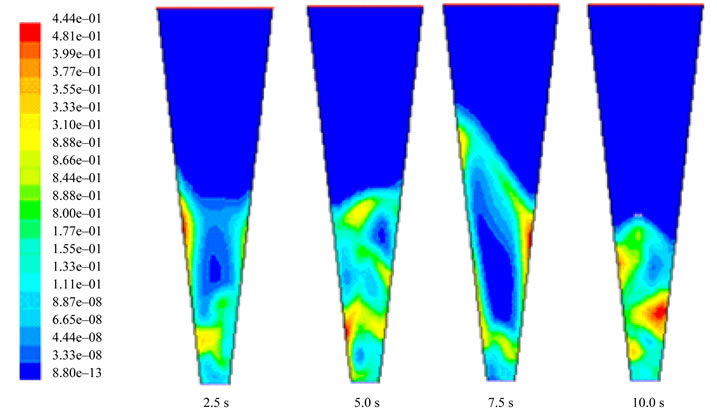
Figure 15. Simulated solids volume fraction profile for glass beads of 2D bed at fully fluidization condition U = 9.63 m/s i.e. at 4UmfM.
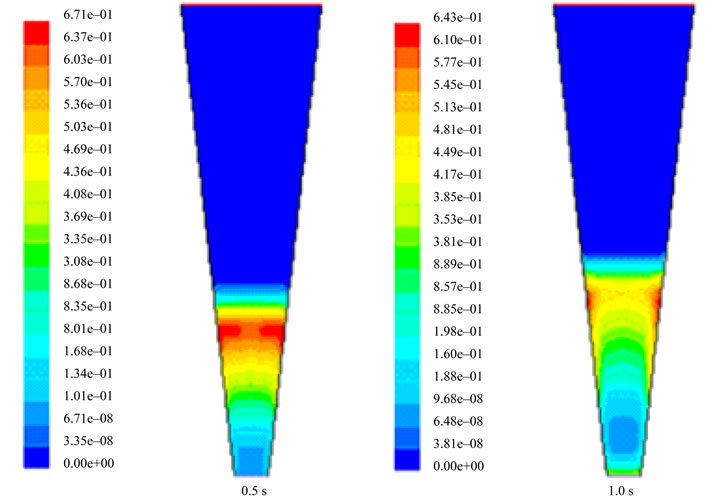
Figure 16. Simulated solids volume fraction profile for dolomite of 2D bed at minimum fluidization condition (U = UmfM i.e. at 2.01 m/s).
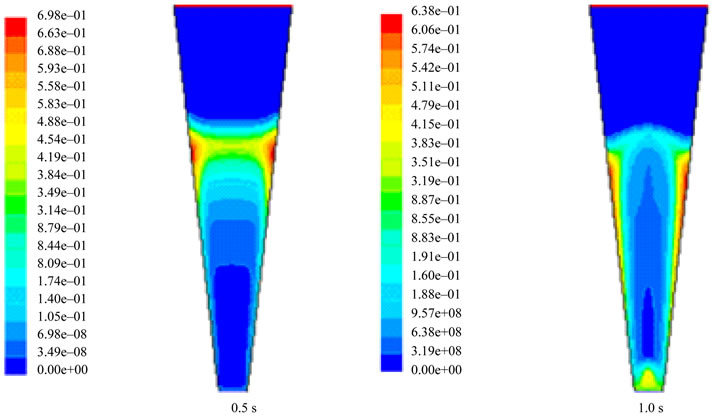
Figure 17. Simulated solids volume fraction profile for dolomite of 2D bed at fully fluidization condition (U = 4.01 m/s i.e. 2 UmfM).
the mixture decreases with increase in the weight fraction of flotsam in the mixture and a small increase in the maximum pressure drop was also observed with increase in the weight fraction of the flotsam particles in the mixture. Good agreement of solid volume fraction profile was obtained between the experimental results and simulation results for glass bead particle but some differences were obtained for dolomite particle. However the results are for two dimensional (2D) only, and therefore only serve to get a qualitative insight into the physical underlying of the fluidization behavior in tapered bed.
Finally it’s concluded that, the overall particle flow and the distribution of granules in a tapered bed are quite different from a cylindrical bed. This is due to intense bubbling zone in the core of the bed. Relations to describe bubble intensity and velocity as a function of bed height in cylindrical beds don’t hold for tapered beds.
The work shows that there is no clear segregation of the granules in the bed, and that their behavior may change between flotsam and the jetsam character depending on the granule fraction present. The results show that the flow and mixing pattern differs over the bed surface, with up flow in the middle, strong radial flow in a zone around this, and down flow at the edge. This indicates that the position of the nozzle will influence the granulation and the granule size distribution.
9. Acknowledgements
The authors would like to thank Faculty of Engineering and Technology, Jadavpur University, Kolkata, India for their kind technical support and for research and development of this project.
REFERENCES
- Y. F. Shi, Y. S. Yu and L. T. Fan, “Incipient Fluidization Condition for a Tapered Fluidized Bed,” Industrial & Engineering Chemistry Fundamental, Vol. 23, No. 4, 1984, pp. 484-489. doi:10.1021/i100016a018
- Y. Peng and L. T. Fan, “Hydrodynamic Characteristics of Fluidization in Liquid-Solid Tapered Beds,” Chemical Engineering Science, Vol. 52, No. 14, 1997, pp. 2277- 2290. doi:10.1016/S0009-2509(97)00061-4
- F. Depypere, J. G. Pieters and K. Dewettinck, “Expanded Bed Height Determination in a Tapered Fluidized Bed Reactor,” Journal of Food Engineering Vol. 67, 2005, pp. 353-359. doi:10.1016/j.jfoodeng.2004.04.039
- H. G. Kim, I. O. Lee, U. C. Chung and Y. H. Kim, “Fluidization Characteristics of Iron Ore Fines of Wide Size Distribution in a Cold Tapered Gas-Solid Fluidized Bed,” ISIJ International, Vol. 40, No. 1, 2000, pp. 16-22. doi:10.2355/isijinternational.40.16
- S. H. Schaafsma, T. Marx and A. C. Hoffmann, “Investigation of the Particle Flow Pattern and Segregation in Tapered Fluidized Bed Granulators,” Chemical Engineering Science, Vol. 61, No. 14, 2006, pp. 4467-4475. doi:10.1016/j.ces.2006.01.040
- C. D. Scott and C. W. Hancher, “Use of Tapered Fluidized Bed as a Continuous Bioreactor,” Biotechnology and Bioengineering, Vol. 18, No. 10, 1976, pp. 1393-1403. doi:10.1002/bit.260181006
- S. P. Babu, S. Leipsiger, B. S. Lee and S. A. Wiel, “Solids Mixing in Batch Operated Tapered Bed and Non-Tapered Gas Fluidized Beds,” Fluidized Bed Fundamentals and Application, AIChE Symposium Series, Vol. 69, 1973, pp. 49-57.
- H. Toyohara and Y. Kawamura, “Core Type Segregation in a Tapered Fluidized Bed of Binary Particle Mixtures,” Kagaku Kogaku Ronbunshu, Vol. 17, No. 1, 1992, pp. 172-178. doi:10.1252/kakoronbunshu.17.172
- S. K. Agarwal and G. K. Roy, “Packed Bed Pressure Drop and Incipient Fluidization Condition in a Conical Bed of Spherical Particles—A Mathematical Model,” Indian Chemical Engineer, Vol. 30, No. 3, 1998, p. 3.
- T. Maruyama and T. Koyanagi, “Slugging Fluidized Bed in Tapered Vessels,” Chemical Engineering Journal, Vol. 52, 1993, p. 9.
- G. Kwant, W. prins and W. P. M. Van Swaaij, “Particle Mixing and Separation in a Binary Solids Floating Fluidized Bed,” Powder Technology, Vol. 82, No. 3, 1994, pp. 279-291. doi:10.1016/0032-5910(94)02937-J
- S. Chiba, A. W. Nienow, T. Chiba and H. Kobayashi, “Fluidized Binary Mixtures in Which the Denser Component May Be Flotsam,” Powder Technology, Vol. 26, No. 1, 1980, pp. 1-10. doi:10.1016/0032-5910(80)85001-7
- P. N. Rowe and A. W. Nienow, “Minimum Fluidization Velocity of Multi-Component Particle Mixtures,” Chemical Engineering Science, Vol. 30, No. 11, 1975, pp. 1365-1369. doi:10.1016/0009-2509(75)85066-4
- L. G. Gibilaro and P. N. Rowe, “A Model for Segregating Fluidized Bed,” Chemical Engineering Science, Vol. 29, No. 6, 1974, pp. 1403-1412. doi:10.1016/0009-2509(74)80164-8
- J. C. Williams, “Mixing and Segregation in Powders,” In: M. Rhodes, Ed., Principles of Powder Technology, Wiley, 1990, London.
- G. P. Hartholt, A. C. Hoffmann and L. P. B. M. Janssen, “Visual Observation of Individual Particle Behavior in Gas and Liquid Fluidized Beds,” Powder Technology, Vol. 88, No. 3, 1996, pp. 341-345. doi:10.1016/S0032-5910(96)03139-7
- P. N. Rowe, A. W. Nienow and A. J. Agbim, “A Preliminary Quantitative Study of Particle Segregation in a Gas Fluidized Beds-Binary Systems of Near Spherical Particles,” Transactions of the Institution of Chemical Engineers, Vol. 50, 1972, pp. 324-333.
- H. Tanimoto, S. Chiba, T. Chiba and H. Kobayashi, “Jetsam Descent Induced by a Single Bubble Passage in Three Dimensional Gas Fluidized Beds,” Journal of Chemical Engineering of Japan, Vol. 14, No. 4, 1981, pp. 273-276. doi:10.1252/jcej.14.273
- J. C. Bosma and A. C. Hoffmann, “On the Capacity of Continuous Powder Classification in a Gas Fluidized Bed with Horizontal Baffles,” Powder Technology, Vol. 134, No. 1-2, 2003, pp. 1-15. doi:10.1016/S0032-5910(03)00097-4
- A. C. Hoffmann and E. J. Romp, “Segregation in Fluidized Powder of a Continuous Size Distribution,” Powder Technology, Vol. 66, No. 2, 1991, pp. 119-126. doi:10.1016/0032-5910(91)80093-X
- R. Clift, J. P. K.Seville, C. Moore and C. Chavarie, “Comments on Buoyancy in Fluidized Beds,” Chemical Engineering Science, Vol. 42, No. 1, 1987, pp. 1991-1996. doi:10.1016/0009-2509(87)80228-2
- K. Ridgway, “Tapered Fluidized Bed—A New Processing Tool,” Chemical and Process Engineering, Vol. 46, 1965, pp. 317-326.
- H. Toyohara and Y. Kawamura, “Fluidization of Tapered Bed of Binary Particle Mixture,” International Chemical Engineering, Vol. 32, No. 1, 1991, p. 164.
- T. M. Gernon, M. A. Gilbertson and R. S. J. Sparks, “Particle Segregation in Tapered Fluidized Beds,” The 13th International Conference on Fluidization—New Paradigm in Fluidization Engineering, Vol. RP6, 2010, Article 91.
NOTES
*Corresponding author.