Materials Sciences and Applications
Vol. 3 No. 11 (2012) , Article ID: 24927 , 9 pages DOI:10.4236/msa.2012.311115
Annealing Effect on the Solid State and Optical Properties of α-Fe2O3 Thin Films Deposited Using the Aqueous Chemical Growth (ACG) Methods
![]()
1Department of Science Laboratory Technology, School of Applied Sciences, Rivers State Polytechnic Bori, Bori, Nigeria; 2Department of Physics, Faculty of Science, Rivers State University of Science and Technology, Nkpolu, Nigeria; 3Department of Physics and Astronomy, Western University, London, Canada; 4Department of Physics and Astronomy, University of Nigeria, Nsukka, Nigeria.
Email: sylvestermammah@yahoo.com, Erfopara2002@yahoo.com, fiezema@yahoo.com; sezugwu@uwo.ca
Received August 8th, 2012; revised September 9th, 2012; accepted October 3rd, 2012
Keywords: Aqueous Chemical Growth; α-Fe2O3; RBS; XRD; Optical Properties
ABSTRACT
Thin films of hematite (α-Fe2O3) were deposited by heteronucleation through the process of hydrolysis and condensation of an aqueous solution of 0.1 M Fe(NO3)3×9H2O, 1 M NaNO3, 50 ml H2O in addition with five drops of HCl at 90˚C. One of the samples was kept as prepared while the others were annealed at different temperatures in order to determine the effect of annealing on their solid state and optical properties. The films were characterized using Rutherford Back Scattering (RBS), spectroscopy for chemical composition and thickness, X-Ray Diffraction (XRD) for structural analysis, UV-VIS Spectrophotometer for the analysis of other solid state and optical properties and a photomicroscope for photomicrographs. The results indicate that while the absorbance and absorption coefficient decreases with increasing annealing temperature, the direct band gap and refractive index increases with increasing annealing temperature in the direction of increasing photon energy in the visible range. Also, there is a high infra-red transmittance which increases with increasing annealing temperature and a shift/decrease in peak value of all the optical properties except transmittance in the direction of increasing photon energy as annealing temperature increases. The results further indicate that ACG hematite thin film annealed at 632 K is a suitable metal oxide semiconductor material for photocatalytic applications. It is also suitable for use in the construction of poultry houses for the rearing of chicks because of its high infrared transmittance including other opto-electronic applications.
1. Introduction
a-Fe2O3 the most stable oxide of iron is environmentally friendly (non toxic), highly resistant to corrosion and ferromagnetic [1]. It occurs naturally in the form of a mineral resource called hematite which is the major source of iron used in producing steel.
Iron is obtained from hematite through a carbothermal reduction process which is shown below.
 [2]
[2]
Pure iron is also obtained from a-Fe2O3 in an extremely exothermic thermite reaction which is shown below
 [3].
[3].
Magnetite, a black magnetic material which contains both Fe(III) and Fe(II) is also obtained from a-Fe2O3 in a partial reduction process using hydrogen at a temperature of about 400˚C. This is indicated in the reaction below
 [4].
[4].
In the form of fine powder, a-Fe2O3 is used in polishing metallic jewelry and lenses. It is also used as pigment for paints, varnish, ink, rubber, plastics etc. [5].
a-Fe2O3 is used as catalyst for petrochemical applications [6] and also has biomedical applications [7,8].
Hematite has also been studied intensively for its use in magnetic devices [9], rechargeable lithium-ion batteries [10], and in gas sensors [11,12].
a-Fe2O3 has a rhombohedral structure and is antiferromagnetic below the temperature of 260 K. Pressure, particle size, structure, morphology and magnetic field intensity are some of the factors that determine the magnetic properties of a-Fe2O3 [13].
Bulk a-Fe2O3 have been produced in the laboratory by electrolyzing a solution of sodium bicarbonate using an iron anode. The resulting hydrated iron(III) oxide is dehydrated at a temperature of about 200˚C. The problem with this production method is the large power supply requirement.
Iron(III) oxide can also be prepared by the thermal decomposition of Iron(III) hydroxide below a temperature of 200˚C.
Nanowires, nanotubes (one dimensional), flakes (two dimensional) and hollow/porous (three-dimensional) nanostructures of a-Fe2O3 have also been produced [14-16]. Some of the methods that have been used to produce nanostructures of a-Fe2O3 are spray pyrolysis [17], solgel [18], template [19] and hydrothermal [20] methods.
The above production methods have various disadvantages which range from high production cost, less purity level, high temperature requirement, possibility of generating wastes that can pollute the immediate environment etc. We have used a relatively novel method, the Aqueous Chemical Growth method, after Lionel Vayssieres [21,22] which has the advantage of low production cost, high purity level, non requirement of surfactants and templates, environmental friendliness, low temperature requirement etc. to deposit thin films of a-Fe2O3 having average thickness of 200 nm on glass substrates for study.
The deposited thin films were annealed at different temperatures and characterized in order to determine the effect of annealing on their solid state and optical properties.
2. Methodology
The samples of the thin a-Fe2O3 films were deposited by heteronucleation onto four clean glass substrates. This was done through the process of hydrolysis and condensation of an aqueous solution made up of 0.1 M Fe(NO3)3×9H2O, 1 M NaNO3, 50 ml H2O together with five drops of HCl at 90˚C for 12 hours. The precursor is hydrated iron nitrate. 1 MNaNO3 was added to 0.1 M Fe(NO3)3×9H2O in 50 ml H2O. Thereafter five drops of HCl was added to adjust the pH level.
The appropriate masses of each of the component chemicals were determined and measured using a laboratory electronic analytical microbalance and put into a 100 ml pyrex bottle. The content of the pyrex bottle was then properly stirred using a magnetic stirrer before four clean glass substrates were inserted in such a way that they were inclined at an angle to the wall of the container.
The corked pyrex bottle containing the chemicals and the four substrates was then put into a laboratory oven with its temperature adjusted to 90˚C and left for a period of 12 hours.
Thereafter, the substrates were removed from the residue in the pyrex bottle and were thoroughly rinsed with distilled water before being dried in air.
Three of the samples D2, D1 and D5 were subsequently annealed at different temperatures of 423 K, 523 K and 623 K respectively while sample D4 was left as prepared originally.
The as-prepared and annealed samples were then characterized and studied. While the thickness and composition of the thin films on the substrates was determined using the Rutherford Backscattering (RBS). The diffractogram was obtained using X-Ray Diffractometer (XRD) with CuKa radiation source having a wavelength of 1.54056 Å and equipped with a graphite back monochromator.
The effective particle size was estimated using the Scherer’s formula while the spectral analysis was carried out using a Unico-UV-2102PC spectrophotometer and the photomicrograph analysis was done with a KPLW10X/18 Zeiss standard 14 photomicroscope M354760 + 2-9901 camera.
This paper reports the effect of thermal annealing on the solid state and optical properties of ACG a-Fe2O3 thin films.
3. Results and Discussion
The elemental composition and the thickness of sample D4 was determined by means of Rutherford Backscattering (RBS).
The result is indicated in Figure 1. Based on the film composition shown in Table 1, it is concluded that the elemental composition of sample D4 is made up O (0.700) and Fe (0.300) while that of the glass substrate is made up O (0.500), Si (0.120), Ca (0.100), Al (0.100) and Na (0.180).
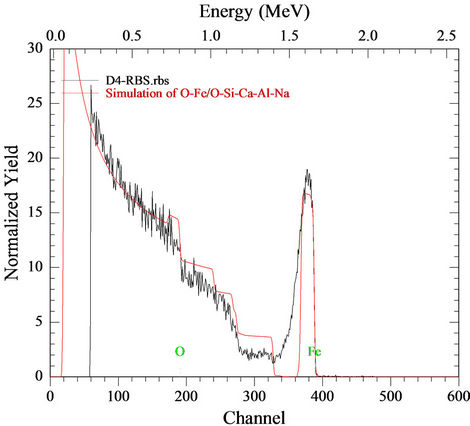
Figure 1. Element composition and thickness of sample D4.
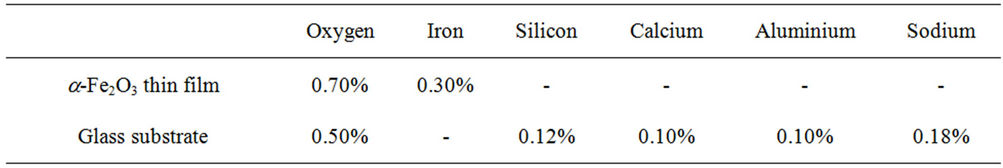
Table 1. Elemental composition of ACG a-Fe2O3 thin film and substrate from RBS analysis.
The X-ray diffraction patterns of three samples, (D4, D1 and D5) of the ACG a-Fe2O3 thin films are as shown in Figures 2-4 respectively. The diffractograms indicate the occurrence of diffraction peaks at 2q = 24.98˚, 33.5˚, 36.5˚, 40.5˚, 49.0˚, 54.0˚ and 62.50˚ which correspond approximately to the (012), (104), (110), (113), (024), (116) and (214) directions respectively in the as-prepared sample. This approximately agrees with the standard pattern on JCPDS Card No. 33-0664 [1]. This shows that the deposited thin films are pure and polycrystalline in nature. The diffraction patterns of the annealed (D1 and D5) samples indicate broad peaks.
The calculated crystal size based on the (012) diffraction peak (24.98˚) in the as prepared sample, using the Sherrer formula, is about 17.4 nm. Su et al. [1] obtained 10.2 nm as the calculated crystal size of pristine porous a-Fe2O3 prepared by hydrothermal method based on the broadening of the (104) diffraction peak.
The Figure 5 below shows the absorbance spectrum of the as-prepared a-Fe2O3 and the annealed samples. The absorbance of the as-prepared a-Fe2O3 rises from an initial value of about 1.07 to a maximum value of about 1.2 at 469 nm and then falls with increasing wavelength to about 0.443 at 600 nm. In the infra red region the absorbance gradually decreased with increasing wavelength to about 0.1 at about 908 nm.
Su et al. [1] recently synthesized tunable porous hematite for gas sensing and lithium storage in lithium ion batteries using hydrothermal method. They reported an absorbance spectrum for the as-prepared a-Fe2O3 nanoparticle which rose from an initial value of about 1.125 at 300 nm to a maximum value of about 1.81 at about 338 nm within the ultra-violet region. Thereafter, the absorbance decreased with increasing wavelength to about 0.44 at 400 nm and became fairly stable in the infra red region. Hence, our absorbance peak value occur in the visible range, while that of Su et al. [1] occurred within the ultraviolet range but the shapes of the spectra are basically the same. The difference in the positions of the peak values and in the peak values may be due to difference in preparation methods and the crystal sizes obtained.
The absorbance spectra of the annealed samples indicate a reduction of absorbance peak with annealing temperature while maintaining the same shape with the spectrum of the as-prepared sample.
Figure 6 shows the transmittance spectra for all the samples while the absorbance peak of the sample annealed at 423 K dropped to about 1.143 the peaks for the samples annealed at 523 K and 623 K reduced to about 1.07.
Generally, within the visible and infra-red ranges, the absorbance decreases with annealed temperature for a particular wavelength.
In the visible range the transmittance of all the samples increased with increasing wavelength. For example, the transmittance of the as-prepared sample increases from 6.43% at about 446 nm to 37.9% at about 600 nm while for the sample annealed at 423 K the transmittance increased from about 7.9% at 446 nm to about 45% at 554 nm. Similarly, the samples annealed at 523 K and 623 K had their transmittances increased from about 9.3% at 423 nm to about 53.6% at about 600 nm. Generally, transmittance within the visible range occurs at a shorter wavelength with increasing annealing temperature. The transmittance of all the samples increased with increasing wavelength in the infra red region. However, it increased with increasing annealing temperature for a particular wavelength. For example, the transmittance of the asprepared sample and the sample annealed at 623 K at 915 nm are about 70.0% and 80.6% respectively at 912 nm.
The high infra-red transmittance of the annealed ACG a-Fe2O3 thin films make them suitable materials for use in constructing poultry houses for the rearing of chicks.
The reflectance peak is generally low for all samples. This is shown in Figure 7. However, the peak shift towards shorter wavelength as the annealed temperature increases. While the peak reflectance value for the as-prepared sample is about 18.75% at 577 nm, that of the sample annealed at 423 K is about 19.2% at 558 nm. The reflectance peak of the samples annealed at 523 K and 623 K is approximately 20% at 539 nm. In the infra red region, the reflectance decreases from the peak value with increasing wavelength. However, for a particular wavelength in the infra red region, the reflectance decreases with increasing annealing temperature.
The absorption coefficient spectra for the samples are as shown in Figure 8. Absorption coefficient of all the samples increased rapidly with increasing photon energy and reaches its peak in the visible range. However, the absorption coefficient decreased with increasing annealing temperature at a particular wavelength within the visible range.
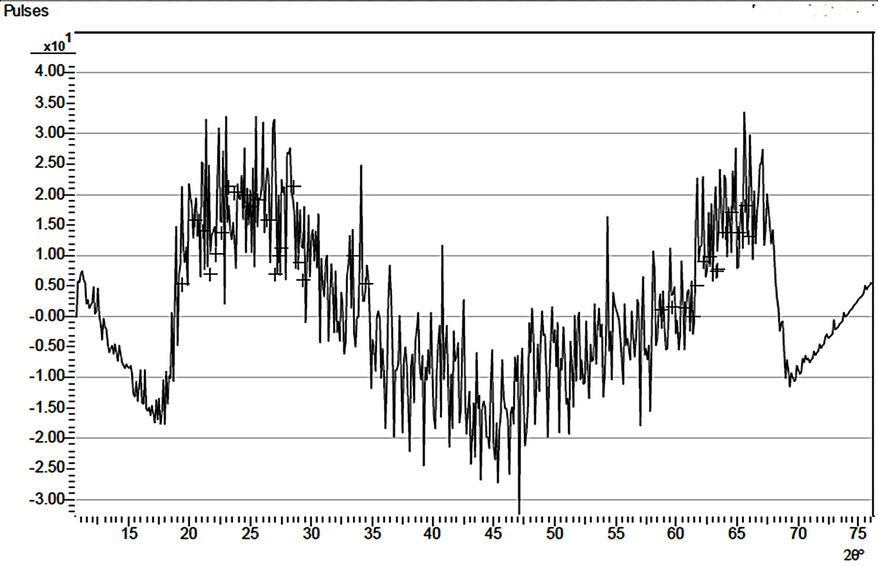
Figure 2. X-ray diffraction pattern of sample D4.
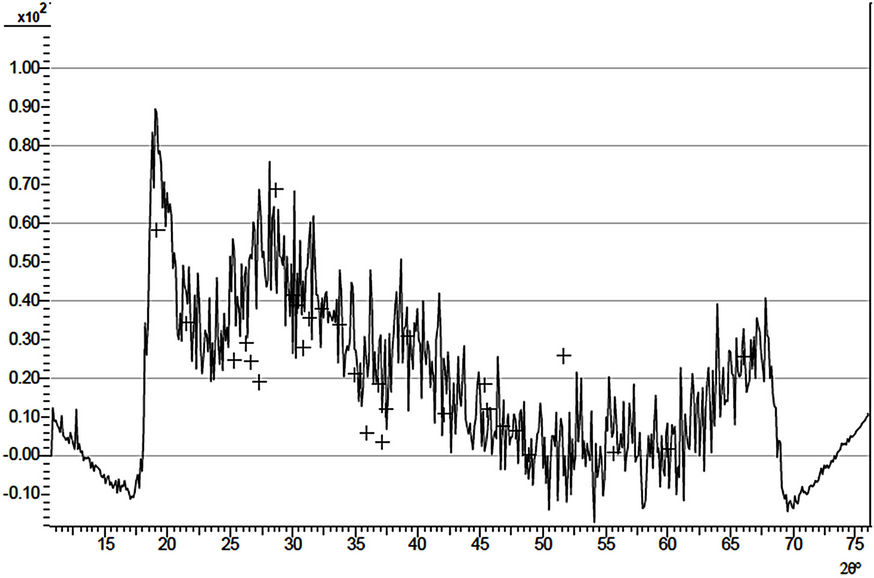
Figure 3. X-ray diffraction pattern of sample D1.
The absorption coefficient of the as-prepared sample rises from 0.8 at 2 eV to a peak value of about 2.70 at 2.77 eV while that of the sample annealed at 423 K rises from about 0.68 at 2 eV to about 2.59 at 2.85 eV. The samples annealed at 523 K and 623 K respectively had their absorption coefficients increased from 0.16 and
Figure 4. X-ray diffraction pattern of sample D1.
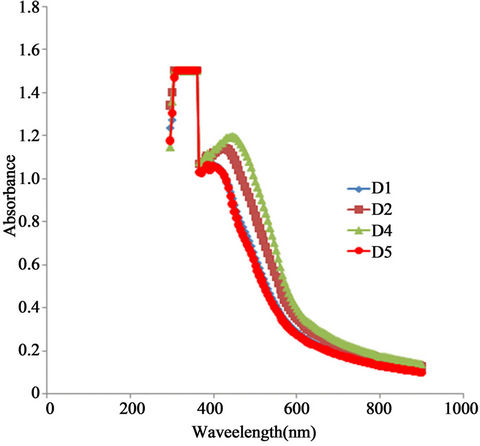
Figure 5. A plot of absorbance vs. wavelength for α-Fe2O3.
0.52 respectively at 2 eV to a peak value of 2.43 at about 3.18 eV.
Generally, the absorption coefficient for all the samples in the infra-red range is lower than 0.5 and also decreases with decreasing photon energy. Also, at any particular wavelength within the infra-red range, absorption coefficient decreases with increasing annealing temperature.
Figure 9 shows the plot of (ah)2 against photon en-
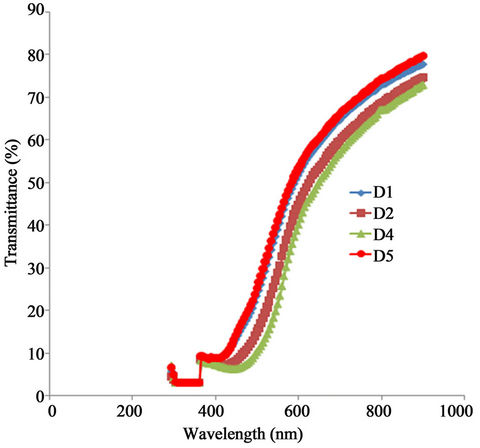
Figure 6. A plot of transmittance vs. wavelength for α-Fe2O3.
ergy for the ACG a-Fe2O3 thin films. As indicated in the figure, all the samples have direct band gap which increases with annealing temperature. The direct band gap of the as-prepared sample is about 2.13 eV which is within the range of 1.9 - 2.2 eV [23] earlier reported for hematite depending on its crystal state and method of preparation. While the estimated direct band gap for the sample annealed at 423 K is 2.25 that of the samples annealed at 523 K and 623 K are 2.34 and 2.50 respectively.
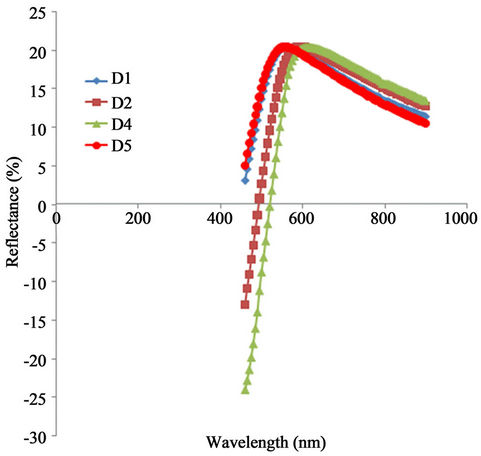
Figure 7. A plot of reflectance vs. wavelength for α-Fe2O3.
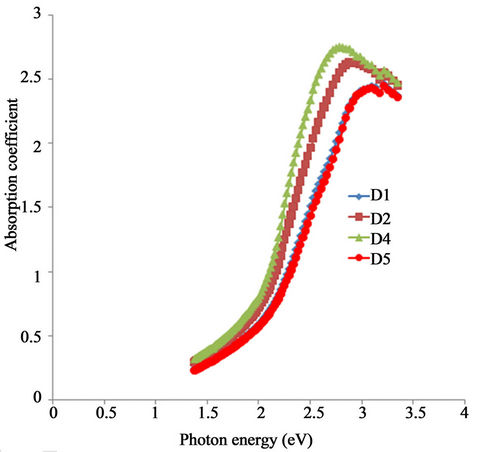
Figure 8. A plot of absorption coefficient vs. wavelength for α-Fe2O3.
This shows a blue shift of 0.05 eV, 0.14 eV and 0.30 eV in direct band gap for the samples annealed at 423 K, 523 K and 623 K respectively.
The blue shift of about 0.30 eV for the sample annealed at 623 K makes it a suitable oxide semiconductor material for photocatalytic applications [24,25].
Figure 10 shows the plot of refractive index of ACG a-Fe2O3 thin films against photon energy.
The refractive index of all the samples increased with increasing photon energy from about 1.5 at about 1.41 eV to a peak value of 2.31.
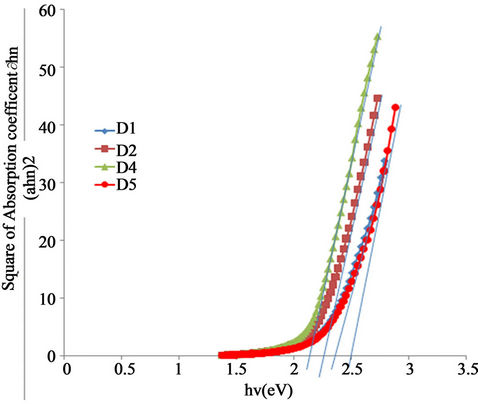
Figure 9. A plot of (αhν) vs. wavelength for α-Fe2O3.
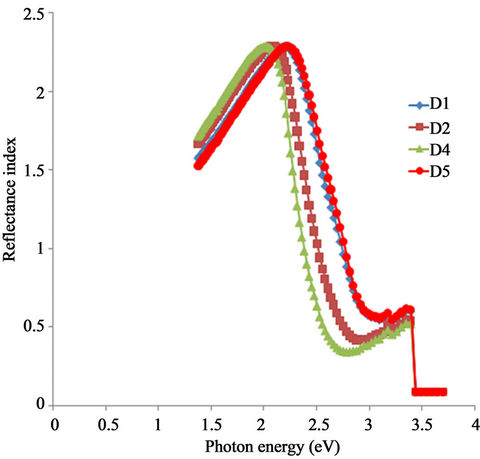
Figure 10. A plot of reflective index vs. photon energy for α- Fe2O3 thin films.
However, there is a shift in the peak position in direction of increasing photon energy as the annealing temperature increases. While the peak position for the asprepared sample occur at about 2.06 eV, that of the sample annealed at 423 K occur at 2.15 eV. Also, the peak position for the samples annealed at 523 K and 623 K occur approximately at 2.27 eV and 2.3 eV respectively.
The refractive index of all the samples falls rapidly with increasing photon energy within the visible range where they attain their minimum values.
The minimum value of the refractive index for the samples annealed at 523 K and 623 K occur at 3.09 eV while that of the sample annealed at 423 K and the asprepared sample occur at 2.9 eV and 2.8 eV respectively.
Figure 11 shows the plot of extinction coefficient against photon energy for all the samples under study. Generally the extinction coefficient of all the samples increases with increasing photon energy and rises to a peak value within the visible range. However, extinction coefficient decreases with increasing annealing temperature at any particular wavelength within the infra-red and visible ranges. While the extinction coefficient of the asprepared sample rises from 36.2 at 2 eV to a peak value of 98.1 at 2.66 eV, that of the sample annealed at 423 K rises from 32.4 at 2 eV to a peak value of 91.0 at 2.79 eV. Also, the extinction coefficient of the samples annealed at 523 K and 623 K is about 26.7 at 2 eV and rises to a peak value of about 81.9 at 2.97 eV. Thus, there is a shift and decrease in peak value in the direction of increasing photon energy as annealing temperature increases.
Figure 12 shows the variation of real dielectric constant of ACG a-Fe2O3 with photon energy. The dielectric constant of each of the samples rose sharply with increasing photon energy in the infra-red region and attained the same peak value though at different photon energies. The peak values shift in the direction of increasing photon energy with increasing annealing temperature. The peak value for all the samples is about 5.6. However, the peak value for the as-prepared sample occurred at about 2.00 eV while that of the sample annealed at 423 K occurred at 2.1 eV. Also, the peak value for the samples annealed at 523 K and 350˚C occurred at approximately 2.21 eV.
In the visible region, the real dielectric constant for all the samples decreases sharply with increasing photon energy and attained minimum values. The minimum value of real dielectric constant for the as-prepared sample is about 0.16 and occurred at about 2.62 eV while that of the sample annealed at 423 K is about 0.26 and occurred at 2.74 eV. Also, the minimum value of the real dielectric constant for the samples annealed at 523 K and 623 K is 0.42 and occurred at 3.00 eV.
The variation of imaginary dielectric constant of the ACG α-Fe2O3 against photon energy is shown in Figure 13. The imaginary dielectric constant of each of the samples rose with increasing photon energy in the infra-red region and attained peak value in the visible range.
There is a general shift and decrease in peak value of the imaginary constant in the direction of increasing photon energy with increasing annealing temperature.
While the peak value of the as-prepared sample is about 230 at about 2.13 eV, the peak value of the sample annealed at 423 K is about 222 at about 2.25 eV.
Also, the peak values for the samples annealed at
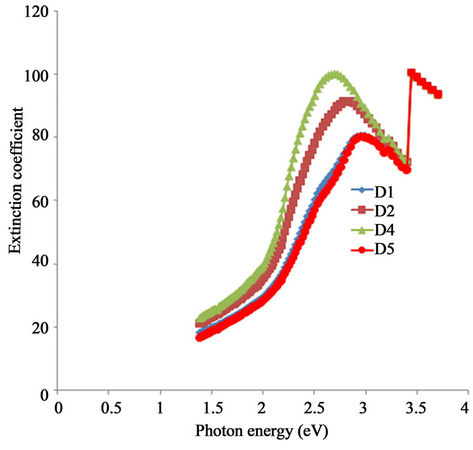
Figure 11. A plot of extinction coefficient vs. photon energy for α-Fe2O3 thin films.
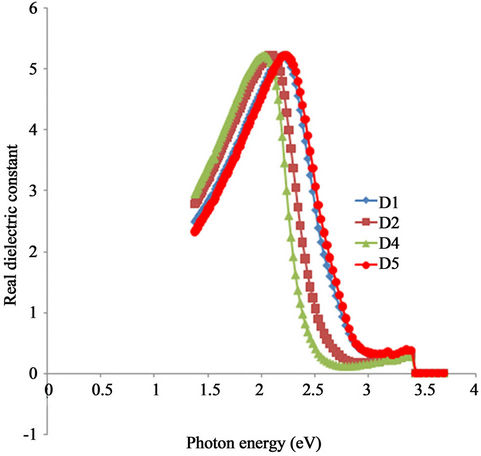
Figure 12. A plot of real dielectric constant vs. photon energy for α-Fe2O3 thin films.
523 K and 623 K are about 210 and 208 respectively at about 2.40 eV and 2.44 eV respectively.
The imaginary dielectric constant of each of the samples decreased to a minimum value from its peak value with increasing photon energy. There is a general shift and an increase in the minimum value in the direction of increasing photon energy with increasing annealing temperature. While the minimum value for the as-prepared sample is about 64 at about 2.81 eV, the minimum value for the sample annealed at 423 K is about 85 at about 2.95 eV.
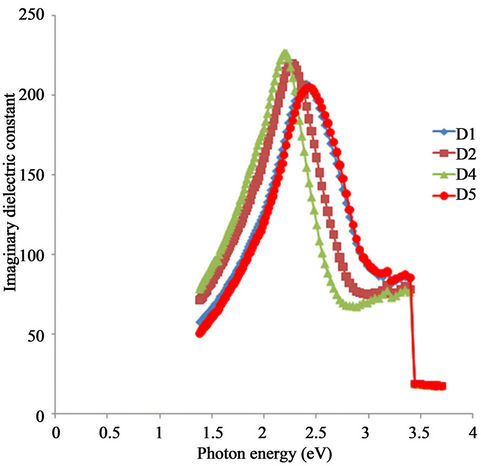
Figure 13. A plot of imaginary dielectric constant vs. photon energy for α-Fe2O3 thin films.
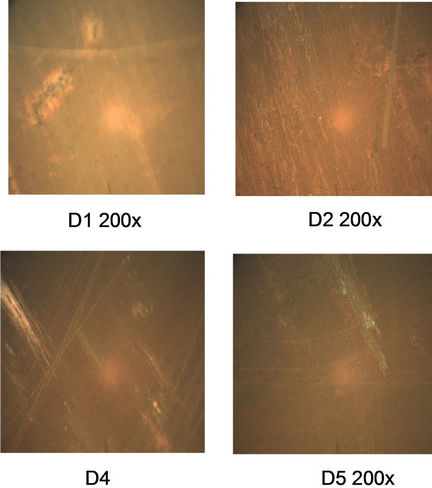
Figure 14. α-Fe2O3 photomicographs.
Also, the minimum value for the samples annealed at 523 K and 623 K is about 85 at about 3.14 eV.
The photomicrographs of each of the samples with a magnification of X200 are as shown in Figure 14. The samples show smooth surfaces with some cracks.
4. Conclusion
Thin films of α-Fe2O3 successfully deposited on glass substrates using the Aqueous chemical growth method from a solution of 0.1 M Fe(NO3)3×9H2O, 1 M NaNO3, 50 ml of H2O and five drops of HCl at 90˚C were annealed at different temperatures to determine its effect on the solid state and optical properties. The annealed films were found to have a decrease in the absorbance and absorption coefficient increase the direct band gap and refractive index in the visible range as the annealing temperature increases. Also a high infra red transmittance as well as a general shift and decrease in peak value of the absorption coefficient, refractive index, reflectance, extinction coefficient, real and imaginary dielectric constants were observed. It was found that α-Fe2O3 thin films annealed at 632 K are suitable materials photo catalytic applications as well for the construction of poultry houses, including other optoelectronic application.
REFERENCES
- D. Su, H. S. Kim, W. S. Kim and G. Wang, “Synthesis of Tunable Porous Hematite (a-Fe2O3) for Gas Sensing and Lithium Storage in Lithium Ion Batteries,” Microporous and Mesoporous Materials, Vol. 149, 2012, pp. 36-45.
- N. N. Greenwood and A. Earnshaw, “Chemistry of the Element,” 2nd Edition, Butterworth-Heinemann, Oxford, 1997.
- A. Price, “Higher School Certificate Inorganic Chemistry,” Leslie Slater Price, 1945.
- G. Brauer, “Handbook of Preparative Inorganic Chemistry,” 2nd Edition, Academic Press, New York, Vol. 1, 1963, p. 1661.
- B. Avijit, “Pickard’s Manual of Operative Dentistry,” Oxford University Press Inc., New York, 2011, p. 89.
- A. S. Teja and P. Y. Koh, “Synthesis, Properties, and Applications of Magnetic Iron Oxide Nanoparticles,” Progress in Crystal Growth and Characterization Matterials, Vol. 55, 2009, pp. 22-45.
- T. Marin, C. Nada, P. Matjaz, S. Zoran, M. S. Dragana and S. Vojstav, “Synthesis, Morphology, Microstructure and Magnetic Properties of Hematite Submicron Particles,” Journal of Alloys and Compounds, Vol. 509, No. 28, 2011, pp. 7639-7644.
- J. Singh, M. Srivastava, J. Dutta and P. K. Dutta, “Preparation & Properties of Hybrid Monodispersed MagneticFe2O3 Based Chitosan Nanocomposite Film for Industrial & Biomedical Application,” International Journal of Biological Macromolecules, Vol. 48, 2011, pp. 170-176.
- M. Mahmoudi, A. Sinchi and M. Imani, “Recent Advances in Surface Engineering of Superparamagnetic Iron Oxide Nanoparticles for Biomedical Applications,” Journal of the Iranian Chemical Society, Vol. 7, No. 3, 2010, pp. 1-27.
- T. E. Garcia, M. Valvo, U. Lafont, C. Munan and E. M. Kelder, “Nanostructured Fe2O3 and CuO Composite Electrodes for Li Ion Batteries,” Journal of Power Sources, Vol. 196, No. 15, 2011, pp. 6425-6432.
- J. Huang, M. Yang, C. Gu, M. Zhai, Y. Sun and J. Liu, “Hematite Solid and Hollow and Photocatalysis,” Materials Research Bulletin, Vol. 46, 2011, pp. 1211-1218.
- C. Hanley, A. Thurber, C. Hanna, A. Punnoose, J. H. Zhang and D. G. Wingett, “The Influences of Cell Type and ZnO Nanoparticle Size on Immune Cell Cytotoxicity and Cytokine Induction,” Nanoscale Research Letters, Vol. 4, No. 12, 2009, pp. 1409-1420.
- J. E. Greenon, “Magnetic Oxide,” John Wiley and Sons, New York, 1994.
- G. X. Wang, X. L. Gou. J. Horvat and J. Park, “Facile Synthesis and Characterization of Iron Oxide Semiconductor Nanowires for Gas Sensing Application,” The Journal of Physical Chemistry C, Vol. 112, 2008, p. 15220.
- A. A. Tahir, K. G. U. Wijayantha, S. Saremi-Yarahmadi, M. Mazhar and V. Mckee, “Nanostructured α-Fe2O3 Thin Films for Photoelectrochemical Hydrogen Generation,” Chemistry of Materials, Vol. 21, 2009, pp. 3763-3772.
- Z. C. Wu, K. Yu, S. D. Zhang and Y. Xie, “Hematite Hollow Spheres with a Mesoporous Shell: Controlled Synthesis and Applications in Gas Sensor and Lithium Ion Batteries,” Journal of Physical Chemistry C, Vol. 112, 2008, p. 11307-11313.
- L. Wang, H. W. Xu, P. C. Chen, D. W. Zhang, C. X. Ding and C. H. Chen, “Electrostatic Spray Deposition of Porous Fe2O3 Thin Films as Anode Material with Improved Electrochemical Performance for Lithium Ion Batteries,” Journal of the Power Sources, Vol. 193, 2009, pp. 846-850.
- K. Won, H. J. Lee, J. P. Ahn and Y. S. Park, “Sol-Gel Mediated Synthesis of Fe2O3 Nanorods,” Advanced Materials, Vol. 15, 2003, pp. 1761-1764.
- J. P. Liu, Y. Y. Li, H. J. Fan, Z. H. Zhu, J. Jiang, R. M. Ding, Y. Y. Hu and X. T. Huang, “Iron Oxide-Based Nanotube Arrays Derived from Sacrificial Template-Accelerated Hydrolysis: Large-Area Design and Reversible Lithium Storage,” Chemistry of Materials, Vol. 22, No. 1, 2010, pp. 212-217.
- J. B. Lian, X. C. Duan, J. M. Ma, P. Peng, T. I. Kin and W. J. Zheng, “Hematite (Alpha-Fe2O3) with Various Morphologies: Ionic Liquid-Assisted Synthesis, Formation Mechanism, and Properties,” ACS Nano, Vol. 3, No. 11, 2009, pp. 3749-3761.
- L. Vayssieres, “On the Design of Advanced Meta Loxide Nanomaterials,” International Journal of Nanotechnology, Vol. 1, No. 1-2, 2004, pp. 1-41.
- L. Vayssieres, “One Dimensional Effect in Hematite Quantum Rod Arrays,” Proceedings of SPIE, Bellingham, Vol. 6340, No. 634000-1, 2006.
- L. Vayssieres, C. Sathe, S. M. Butorin, D. K. Smith, J. Nordgren and J. H. Guo, “1-D Quantum Confinement Effect in α-Fe2O3 Nanorod Arrays,” Advanced Materials, Vol. 17, 2005, pp. 2320-2323.
- Z. Zhou, J. Ye, K. Sayama and H. Arakawa, “Direct Splitting of Water under Visible Light Irradiation with an Oxide Semiconductor Photocatalysts,” Nature, Vol. 414, 2005, pp. 625-627.
- Y. Matsumoto, “Energy Positions of Oxide Semiconductors and Photocatalysis with Iron Complex Oxides,” Journal of Solid State Chemistry, Vol. 126, No. 2, 1996, pp. 227-234.