Materials Sciences and Applications
Vol.3 No.2(2012), Article ID:17254,4 pages DOI:10.4236/msa.2012.32015
Studies of Preparation and Characteristics in Borosilicate Photosensitive Glass-Ceramics
![]()
1Department of Material Science and Engineering, Changchun University of Science and Technology, Changchun, China; 2Staff Room of Basic Base Physics, Air Force Aviation University, Changchun, China.
Email: *zt_001214@126.com
Received December 13th, 2011; revised January 22nd, 2012; accepted January 29th, 2012
Keywords: Borosilicate Glass; Heat Treatment System; Radiation Induced Absorption
ABSTRACT
Photosensitive glass-ceramics have been extensively studied in recent years in that it is an attractive high diffraction efficiency grating materials. It is based on Stookey’s mixed fluoride sodium glass system for us to adopt, design prescriptions on the basis of SiO2-Na2O-Al2O3-ZnO for the glass main component and a series of glass doped with CeO2, AgNO3 and NaF etc. melted at about 1450˚C, and the glass have good optical property (homogeneity, without bubble and stripe, high transparency). The borosilicate glass was exposed by ultraviolet light, and then after the heat treatment of the sample, the measurement of ultraviolet-visible-near infrared absorption spectrum and the X-ray diffraction of exposure part was performed.
1. Introduction
Conventional photosensitive materials for volume hologram recording include: silver halide photographic emulsions, dichromated gelatin, photoresists, photopolymers, polymers with spectral holeburning, chalcogenide glasses, oxide glasses doped with variable valence rare-earth elements, porous glasses doped with photopolymers, germanium doped silica, and photorefractive crystals [1-3]. Each of these materials has its own merits, combined with considerable drawbacks. Finally, none of the mentioned materials has tolerance to laser radiation comparable with the main materials for optical design dielectric glasses and crystals.
Fiber gratings and other photonic devices based on photosensitivity of glass have a very wide application in the communications technology and other opto-electronics industry [4]. Therefore, the photosensitive of glass has become one of the hot researches. However, research work has been focused on silica glass. In recent years, borosilicate glass with strong photosensitivity, higher refractive index changes and temperature stability, gets more research interest in its photosensitivity [5]. The influence of heat treatment and exposure time on photosensitivity of glass-ceramics was studied and analyzed [6,7].
2. Experiment
2.1. Preparation of Glass Samples
In this paper, the SiO2-Na2O-Al2O3-ZnO system was used, and the main components are shown in Table 1.
The glasses were melted in an electrical furnace in 1L platinum crucible at 1460˚C for 5 h. Stirring with a Pt blade was used to homogenise the melt. After melting, the glasses were cooled in air to the glass transition temperature (Tg ~460˚C), then annealed at Tg for 2 h, and finally cooled to room temperature at 0.1˚C/min. Polished samples of 2 mm thick and 25 mm × 25 mm lateral size were prepared from each melt. It has been previously shown that the optical homogeneity of the samples plays a
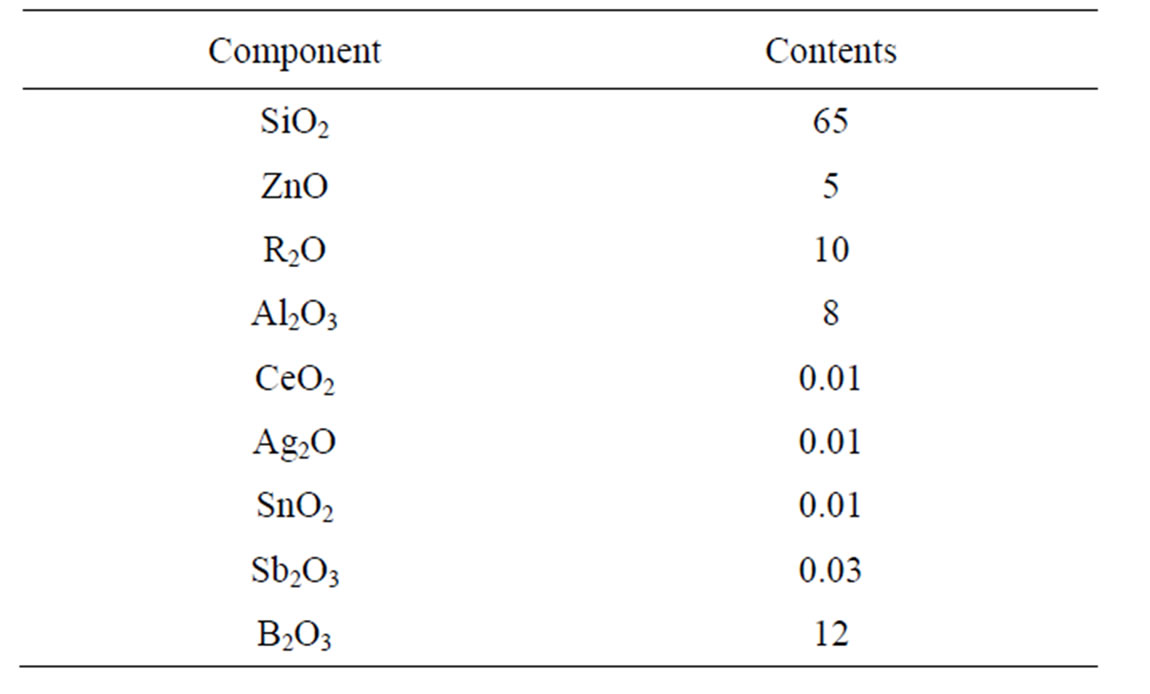
Table 1. Composition of photosensitive glass-ceramics (wt%).
key role in their crystallisation behaviour. The homogeneity was thus tested by the shadow method in a divergent beam of a He-Ne laser and was quantified by measurements with a commercial Zygo interferometer. The samples chosen for this study presented a degree of homogeneity of better than 40 ppm (peak to valley variation of refractive index). Finally, chemical analyses were carried out on all the glass melts that were studied in this paper.
2.2. Chemical Reaction Mechanism
In our study, we induce Ag as out-of-phase crystal nucleus. Ag doesn’t participate in forming glass, only existing in the status of Ag+ or Ag0. We hope that most of Ag are uniform distribution with the status of Ag+ in the form stage, and only a fat lot of Ag0 exist as the part of deoxidized previously. When using the ultraviolet light to expose, the Ce3+ lose a electron which will be captured by some particular locus [8,9]. Then it to be a latent image,
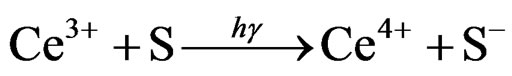 (1)
(1)
(where S is the active locus in glass) which are different from the photochromic glass. In photochromic glass, the electrons are captured by Ag+ directly. In photosensitive glass, the electrons are re-released from these locus by heat treatment, and then combine with Ag+ to be deacidized.
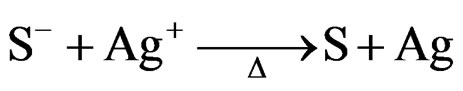 (2)
(2)
It is a pity that the essence of these locus is not clear. When the temperature approach the yield point, the silver atoms begin to assemble to be aggregations.
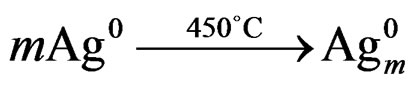 (3)
(3)
At the same time, the silver atom aggregations can be the nucleus to make the compounds precipitate with the form of crystal.
When the precipitable compounds are sodium metasilicate or sodium fluoride, if the amount is many enough and the volume is big enough, the UV-exposed area become milk white which are subtransparent or non-transparent, and the others are transparent.
2.3. Heat Treatment
The annealed samples were divided into four parts. Three of them were exposured by UV radiation at 365 nm for 10 min, then put into muffle furnace for heat treatment. The heat treatment system was shown in Table 2.
2.4. The Spectra
XRD spectra are tested by a X-ray diffractometer. The test conditions are following: Cu target, ρ = 40 kV/30 mA, Step-width = 0.02, continuous scanning, scanning speed = 2/min. Absorption spectra were determined using a PERKIN-ELMER LAMBDA 900 UV/VIS/NIR spectrophotometer ranging from 200 nm - 3300 nm with the resolution of 1 nm. All the measurements were carried out at room temperature.
3. Results and Discussion
3.1. Adjustment of Glass Component
An outstanding problem of the normal photosensitive and nanocrystalline silicate glass is its very high melting temperature, which leads to serious volatilization of noble metals (photo sensitizer), high consumption of energy, environmental pollution and so on [10]. Therefore, we adjust the glass component. The SiO2-R2O-Al2O3-ZnO (R = Na, K) system is selected, and make sure SiO2 + R2O ≥ 90 mol% and 1.6 ≤ SiO2/R2O ≤ 2.2. The reason is as follows:
1) The melting temperature can be drastically lowered.
2) It is propitious to form fine microcrystallite, which may be crystallized from phase splitting, by inducing photosensitive crystal nucleus, in the case of certain immiscible trend.
3) The ultraviolet intrinsic absorption of silicate glass is influenced by inducing a mass of alkali oxide as network modifier. Because lots of non-bridging oxygen ions are generated, the intensity of network average chemical bond is weaken, and electron activation energy decreases, which makes the ultraviolet absorption edge move to the long wavelength band. The glass can be adjusted in the best ultraviolet absorption area.
4) With a considerable number of alkali metal oxide adjusting the density and thermal expansion coefficient difference between glass and crystallinesubstance, the micro-relief structure of characteristics of geometrical optics is produced. Besides steadying the glass, in the alkalinity system, Al2O3 and ZnO can increase the degree of network cross-linked in the form of [AlO4] and [ZnO4]. Due to their volume are larger than [SiO4], it is conducive to the ionic diffusion. R2O is propitious to the melting of glass and adjust the coefficient of thermal expansion and density. The melting temperature is controlled at 1450˚C ~ 1480˚C after adjustment. Experiments show that the viscosity of glass has been reduced to a certain extent, and the bubbles have been eliminated, and the quality of the final glass products have been improved.
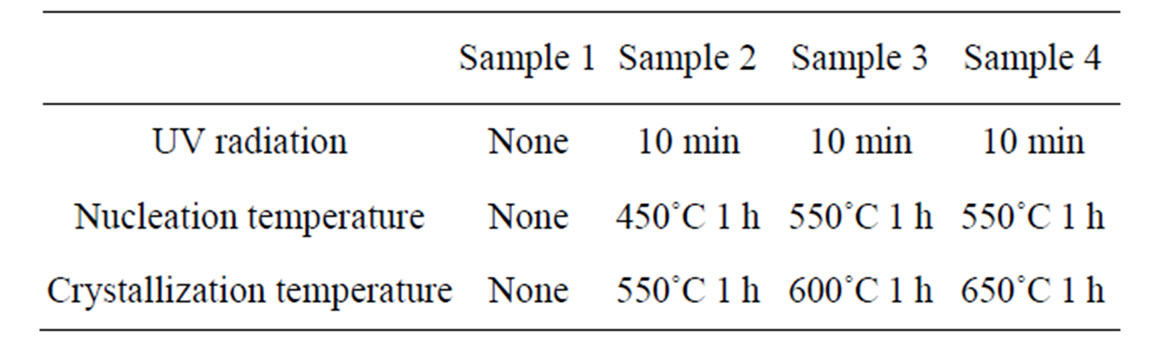
Table 2. Heat treatment system.
3.2. XRD Analysis
Figures 1-4 show the X-ray diffraction of the samples. It is can be seen from the above figures that there is a marked wave packet, which is typical glass state. There is just one peak at 2θ = 50.05˚ in the Figure 4 but not found in the Figure 1, and it may be lithium orthosilicate. The colour of lithium orthosilicate is white, and the Sample 4 is a little white too, which accord with the colour of lithium orthosilicate. Figure 1 and Figure 4 have no change basically, it means that the heat treatment system of Sample 4 is unreasonable. Diffraction peaks of Sample 2 and Sample 3 are many and sharper, which shows that polycrystalline appear. The angular width of diffraction peaks is wider than angular resolution of the experimental setup, and the bigger diffraction peak half width, the smaller crystalline grain. One peak value of Sample 2 is at 2θ = 26.59˚, while Sample 3 is at 2θ = 26.59˚. Two diffraction peaks appear for the same crystalline phase, that is, diffraction peaks have a little translation, only 0.3%, which suggests that different heat treatment affects lattice distance. In the X-ray diffraction of Sample 3, the peak value appears at 2θ = 38.78˚, which is the diffraction peak of NaF crystalline. It is preliminary determined that heat treatment of Sample 2 is more reasonable.
3.3. Absorption Spectrum Analysis
Absorption spectra of the studied samples are shown in Figure 5. The intrinsic absorption spectrum of the glass matrix is seen as a strait line in Figure 5 in the short wavelength region λ < 225 nm. This part of the absorption spectrum usually corresponds to excitations to the conduction band resulting in generation of free moving electrons [11]. Absorption which looks as a long wavelength tail of intrinsic absorption in a region down to 325 nm is the well-known absorption band of impurity of Fe3+ [12]. This absorption band near 230 nm has a specific absorption in a soda-lime silicate glass of 3130 cm–1/W% Fe3+ [13]. No measurements of the specific absorption of iron were made for the glass but the number

Figure 1. X-ray diffraction of Sample 1.

Figure 2. X-ray diffraction of Sample 2.
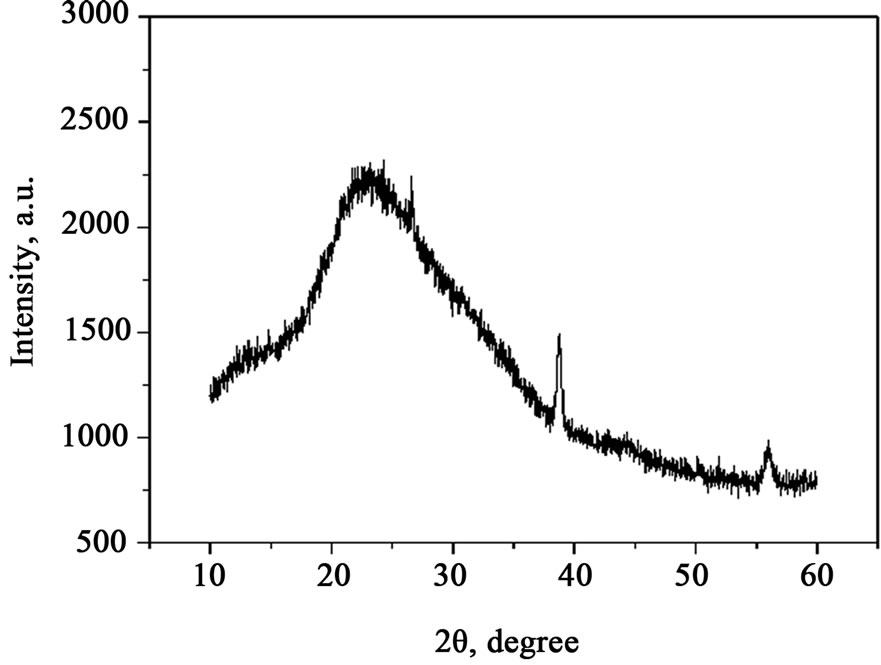
Figure 3. X-ray diffraction of Sample 3.

Figure 4. X-ray diffraction of Sample 4.

Figure 5. Absorption spectra of Sample 1 and Sample 2 in UV part.
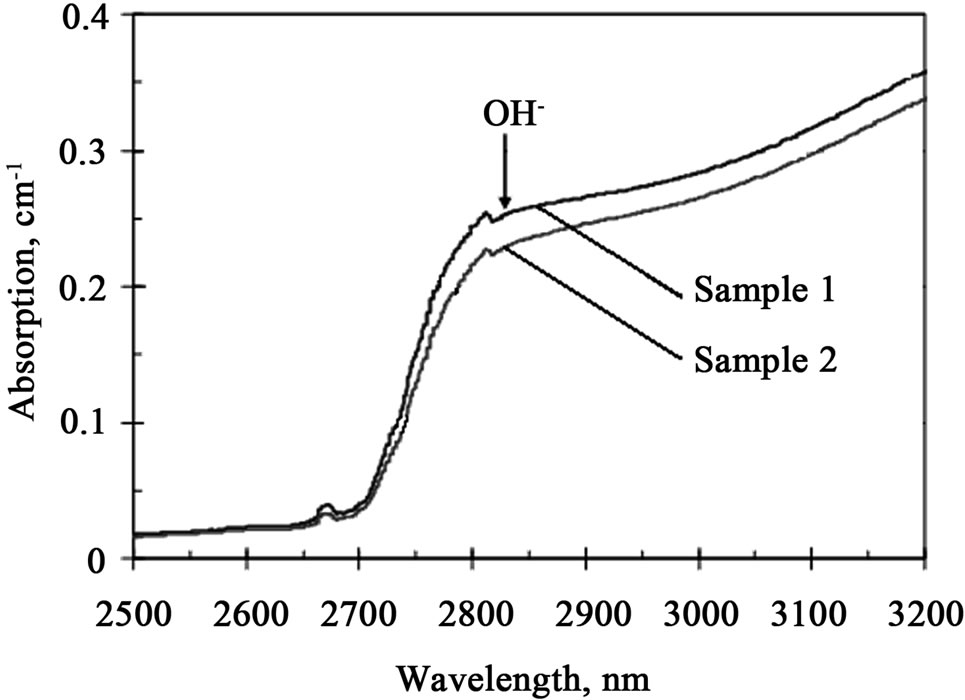
Figure 6. Absorption spectra of Sample 1 and Sample 2 in IR part.
above can be used for rough estimations, which gives the total concentration of ferric ions of about 3 ppm. This value confirms a high purity of materials and the melting technology used in this work.
Figure 5 shows that the photosensitive additives significantly increase the UV absorption of the glass as compared to that of the glass matrix. One can see the wellknown absorption band of Ce3+ with the maximum at 305 nm which is responsible for the photosensitivity of the glass ranged from 280 nm to 350 nm. The short wavelength absorption is a superposition of absorption bands of Ce4+ and other dopants which completely mask intrinsic absorption of glass matrix.
Absorption edge of the glass matrix in the IR region is formed by a band of hydroxyl groups having maximum at 2850 nm (Figure 6). Usually this absorption for silicate glasses is in the range of several inverse centimeters. A low intensity of the hydroxyl absorption in the studied glass could be related to additives of fluorine, which can produce such volatile components as HF. The IR absorption of the glass with photosensitive components has a slightly smaller value than that could be resulted from the contribution of variable valence ions in forming of volatile hydrogen containing components. Small bumps at 2675 nm and 2815 nm are known Cary-500 artifacts but not real absorption bands. The absorption coefficient between 500 nm and 2500 nm is below 0.01 cm–1 and can not be reliably measured with the use of conventional spectrophotometers.
The most important practical observation is that after exposure to a high dose, induced absorption in the near IR region does not exceed 0.1 cm–1. This means that typical holographic element with thickness of about 1 mm has transmittance exceeding 99% and even 1 cm of the glass in an optical device would provide 90% transmission after such exposure to ionizing radiation.
4. Conclusions
1) The best heat treatment system is to keep 450˚C for 1 h then rise to 550˚C for 1 h, and exposure time is 10 minutes.
2) Different heat treatment make diffraction peak of the same lattice translate and change the lattice distance.
3) Induced absorption in the near IR region does not exceed 0.1 cm–1.
REFERENCES
- V. I. Sukhanov, D. N. Sitnik, I. V. Tunimanova and V. A. Tsekhomsky, “Photochromic Glasses as Hologram Recording Media,” Soviet Journal of Optical Technology, Vol. 37, No. 12, 1970, pp. 796-797.
- Y. Z. Xu, H. Y. Tam, S. Y. Liu and M. S. Demokan, “Pump-Induced Thermal Effects in Er-Yb Fiber Grating DBR Lasers,” IEEE Photonics Technology Letters, Vol. 10, No. 9, 1998, pp. 1253-1255. doi:10.1109/68.705607
- J. Lumeau, A. Sinitskii, L. Glebova, L. B. Glebov and E. D. Zanotto, “Method to Assess the Homogeneity of Partially Crystallized Glasses: Application to A Photo-Thermo-Refractive Glass,” Journal of Non-Crystalline Solids, Vol. 355, No. 34-36, 2009, pp. 1760-1768. doi:10.1016/j.jnoncrysol.2009.05.054
- J. W. Zhou and X. Q. Song, “Theory and Application of Photosensitive Glass,” University Chemistry, Vol. 10, No. 2, 1995, pp. 27-30.
- J. Lumeau, L. Glebova, V. Golubkov, E. D. Zanotto and L. B. Glebov, “Origin of Crystallization-Induced Refractive Index Changes in Photo-Thermo-Refractive Glass,” Optical Materials, Vol. 32, No. 1, 2009, pp. 139-143. doi:10.1016/j.optmat.2009.07.007
- M. Efimov, L. B. Glebov and H. P. Andre, “Measurement of the Induced Refractive Index in a Photo-Thermo-Refractive Glass by a Liquid-Cell Shearing Interferometer,” Applied Optics, Vol. 41, No. 10, 2002, pp. 1864-1871. doi:10.1364/AO.41.001864
- L. Glebova, J. Lumeau, M. Klimov, E. D. Zanotto and L. B. Glebov, “Role of Bromine on the Thermal and Optical Properties of Photo-Thermo-Refractive Glass,” Journal of Non-Crystalline Solids, Vol. 354, No. 2-9, 2008, pp. 456- 461. doi:10.1016/j.jnoncrysol.2007.06.086
- S. Santran, M. M. Rosas, L. Canioni, L. Sarger, L. Glebova, A. Tirpak and L. Glebov, “Nonlinear Refractive Index of Photo-Thermo-Refractive Glass,” Optical Materials, Vol. 28, No. 4, 2006, pp. 401-407. doi:10.1016/j.optmat.2005.02.004
- G. H. Sigel and R. J. Ginther, “The Effect of Iron on the Ultraviolet Absorption of High Purity Soda-Silica Glass,” Glass Technology, Vol. 9, 1968, pp. 66-70.
- K. Sivaiah, K. N. Kumar, V. Naresh and S. Buddhudu, “Structural and Optical Properties of Li+: PVP & Ag+: PVP Polymer Films,” Materials Sciences and Applications, Vol. 2, No. 11, 2011, pp. 1688-1696.
- F. H. ElBatal and M. A. Azooz, “Preparation and Characterization of Some Multicomponent Silicate Glasses and Their Glass-Ceramics Derivatives for Dental Applications,” Ceramics International, Vol. 35, No. 3, 2009, pp. 1211-1218. doi:10.1016/j.ceramint.2008.06.009
- M. Efimov, L. B. Glebov, L. N. Glebova, K. C. Richardson and V. I. Smirnov, “High-Efficiency Bragg Gratings in Photo-Thermo-Refractive Glass,” Applied Optics, Vol. 38, No. 4, 1999, pp. 619-627. doi:10.1364/AO.38.000619
- H. J. Pan, C. Y. Lin, U. S. Mohanty and J. H. Chou, “Synthesis of Sn-3.5 Ag Alloy Nanosolder by Chemical Reduction Method,” Materials Sciences and Applications, Vol. 2, No. 10, 2011, pp. 1480-1484. doi:10.4236/msa.2011.210199
NOTES
*Corresponding author.