Journal of Modern Physics
Vol.3 No.5(2012), Article ID:19265,8 pages DOI:10.4236/jmp.2012.35056
Mn Effect on Nonlinear and Structural Properties of <110> Oriented PZN-4.5PT Single Crystals
1Laboratoire de Chimie et de Physique des Matériaux (LCPM), Département de Physique, Université de Ziguinchor, Ziguinchor, Sénégal
2Ecole Nationale des Sciences Appliquées d’El Jadida, EL Jadida, Morocco
3Laboratoire Génie Electrique et Ferroélectricité, Institut National des Sciences Appliquées de Lyon, Villeurbanne, France
Email: dkobor@univ-zig.sn
Received October 26, 2011; revised November 15, 2011; accepted December 1, 2011
Keywords: XRD; Dielectric; Piezoelectric; EPR; Raman; Spectroscopy
ABSTRACT
Ferroelectric single crystals Pb(Zn1/3Nb2/3)O3-PbTiO3 (PZN-PT) are promising full materials for non resonant or large bandwidth transducers due to the large values of their piezoelectric properties (dij, kij) and their low mechanical quality factor (Qij). Many studies on <001> oriented PZN-4.5PT single crystals were carried out but it is very difficult to find research findings on <110> oriented Mn doped PZN-PT. Thus, investigations were made using XRD, Raman and EPR characterization for <110> oriented PZN-4.5PT grown through the Flux method. Mn doping effect on structural, dielectric, mechanical and piezoelectric properties with two values of Mn percentage (1 and 2 mol%) are also reported in this paper. Through the XRD study, the lattice parameters of doped PZN-PT crystals are slightly increased compared to the undoped one but the Mn didn’t change its structure. The room temperature dielectric permittivity along <110> direction is about 1572 and 1626 (respectively 1% and 2% Mn doped crystals) which are much lower than that of the undoped PZN-4.5PT (2553). The remnant polarization and coercive field of <110> oriented doped crystal measured at 1 KHz are respectively 30 µC/cm2 and 4.30 kV/cm (PZN-4.5PT), 32 µC/cm2 and 6.10 kV/cm (PZN-4.5PT + 1% Mn) and 28 µC/cm2 and 7.30 kV/cm (for the 2% Mn doped crystal). The mechanical quality factor Qm changed from 139 to 441 respectively for the pure and 1% Mn doped single crystals at room temperature while it decreases slightly to 336 for the 2 mol% Mn doped.
1. Introduction
The performance of transducers can be significantly increased by the use of active materials with large piezoelectric coefficients (dij) and large coupling factors (kij) [1]. High levels of piezoelectricity have been published in Pb(Mg1/3Nb2/3)O3-PbTiO3 (PMN-PT) and Pb(Zn1/3Nb2/3)O3- PbTiO3 (PZN-PT) single crystals: d33 > 2500 pC/N, d31> –1500 pC/N, k33 > 90%, k31 > 80% and kt > 60% [1-5]. Though these crystals have excellent piezoelectric constants and electromechanical coupling factors, they have very low mechanical quality factor values (Qm < 100) which in turn reduces their potential for high power applications or resonant based transducers [1,2,4]. Defects and substituents are known to affect the electromechanical properties of the normal ferroelectrics in both poled and unpoled conditions [6]. In the case of polycrystalline Pb(ZrxTi1-x)O3 (PZT) ceramics, substituting B4+ cations with lower valence ions can highly increase Qm. Besides, Mn doping in Pb(Mg1/3Nb2/3)O3-PbTiO3 ceramics resulted in improved Qm while Fe-doping had almost no effect on Qm [4,7]. Analagous to acceptor doping in polycrystalline PZT ceramics PZN-4.5PT single crystals were doped with Manganese.
The aim of this paper was to investigate the effect of Mn doping (with different rate) on the structure, dielectric and mechanical properties of PZN-4.5PT single crystals.
2. Experimental Procedure
The single crystals were prepared using the conventional high temperature flux method described elsewhere [8]. The amount of dopant was fixed 1% and 2% mol. This choice corresponds to a high increase of Qm for polycrystalline PZT ceramics without significantly decreasing piezoelectric coefficients [9] and can give an idea on the influence of the dopant rate.
3. Measurement Method
3.1. Structural Analysis
X-Ray powder Diffraction was performed on ground single crystals with the help of a Philips X’pert Pro diffractometer using a monochromatic selecting CuKa radiation (l = 1.5418 Å). Measurements for XRD characterization were realized by using a HTK16 high temperature chamber. The lattice parameters were determined in ambient conditions for the rhombohedral structure. A spectrometer EPR VARIAN E9 was used to determine the Mn valences. Raman spectra were measured with the incident light targeting the middle of a face (“milieu”) and on the edge (“bord”) of the sample to see consistency and purity of the crystal. In doing so, we used sidebars form of PZN-4.5PT single crystals (undoped and Mn doped) sam-ples oriented along [110].
3.2. Dielectric and Piezoelectric Characterization
Samples of PZN-4.5PT and Mn (1 and 2 mol%) doped PZN-4.5PT single crystals for the dielectric properties measurements were oriented along its crystallographic direction [110]. The samples are bars with two parallel faces sputtered with Gold. Poling was performed with an electric field of 12 kV/cm at room temperature. Dielectric properties with temperature were determined at 1 kHz using a multi-frequency LCR meter (HP4284A) and a computer controlled temperature chamber. From the curves, two phase transitions temperatures (TRT and Tc) corresponding to changes in  were identified. Dielectric hysteresis were measured using a modified Sawyer-Tower circuit and associated strain measured using a linear variable displacement transducer (LVDT) driven by a lock-in amplifier (Stanford Research system model SR 830). From polarization-Efield curves, coercive field (Ec), remanent polarization (Pr) and spontaneous polarization (Ps) were determined. In order to delineate strain measurement the LVDT’s insulating probes were directly wired onto the <110> face electrodes and the computer plotted S-E curves. The coefficient charge d31, the elastic compliance
  and the piezoelectric coefficient representing the proportionality between the stress and the resulting electric field g31 were measured on bars using a HP4194A gain/phase Analyzer at room temperature, 24 h after poling in respect with IEEE standard [10]. The mechanical factor Qm was calculated with the following formula:
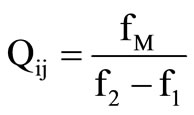 (1)
(1)
where fM represents the frequency for which the admittance modulus |Y|max is maximum and f1 and f2, the two frequencies for which |Y|max is devided by . The results are summarized in Table 1" target="_self"> Table 1.
4. Results and Discussion
Structural Analysis
The XRD diffraction patterns (Figure 1) confirm a pure perovskite phase for the three crystals within the X-ray powder diffraction’s sensitivity. It means that Pb(Zn1/3Nb2/3)O3 and PbTiO3 have formed a perfect perovskite structure solid solution. Generally, XRD diagrams are carried out over narrow angular regions centered about the six pseudo-cubic reflections (100), (110), (111), (200), (220) and (222), from which it is possible to determine unambiguously the crystal’s symmetry. In the rhombohedral symmetry, the (h00) pics are all singulets while the (hhh) pics become doubled. In our case, from the peak profiles of the pseudo-cubic (200) and (222) reflections, the symmetry is clearly seen to be rhombohedral [9]. These results show that the Mn doping didn’t change the single crystals structure at room temperature.
Figure 2 shows an illustration of the rhombohedral lattice parameter and the density evolution based on the rate of Mn in the crystal. The density value for the undoped single crystal and the 1% mol Mn doped is substantially the same as the calculated theoretical values (8393 and 8391 ± 41 respectively for the undoped crystal; 8399 and 8394 ± 130 for 1% Mn doped). The most important difference is the results from the 2 mol% Mn doped crystals (8377 and 8437 ± 140). This high value of the experimental density shows that the grown single crystals are of good quality. It is clear that the value of the lattice parameter remains almost the same for undoped to 1% doping (4.056 to 4.057 Å) before increasing
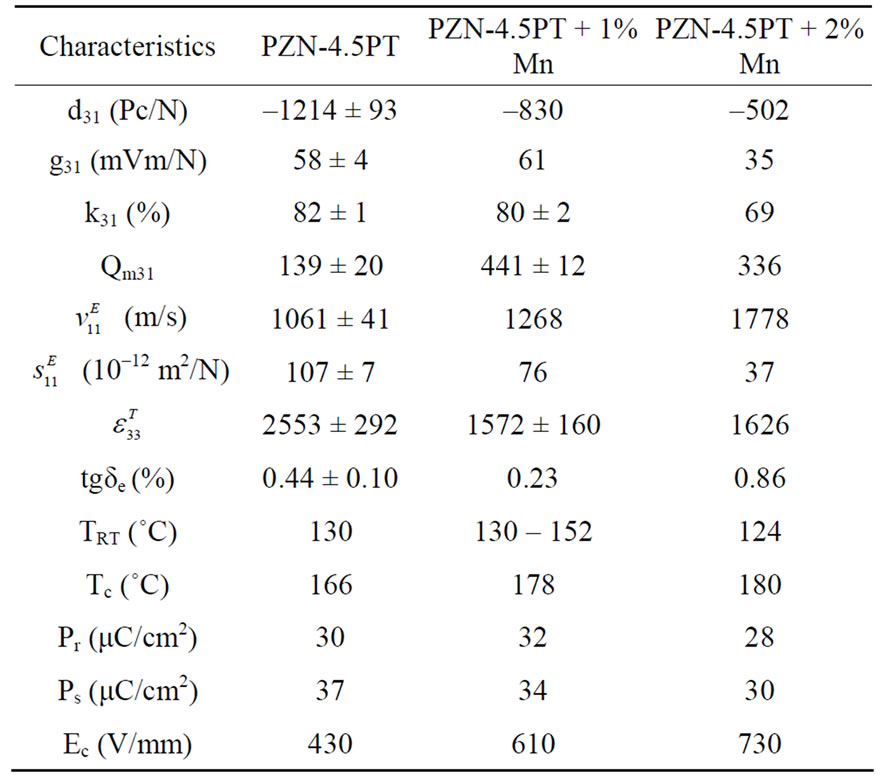
Table 1. Dielectric, ferroelectric and piezoelectric properties for <110> oriented Mn doped PZN-4.5PT.
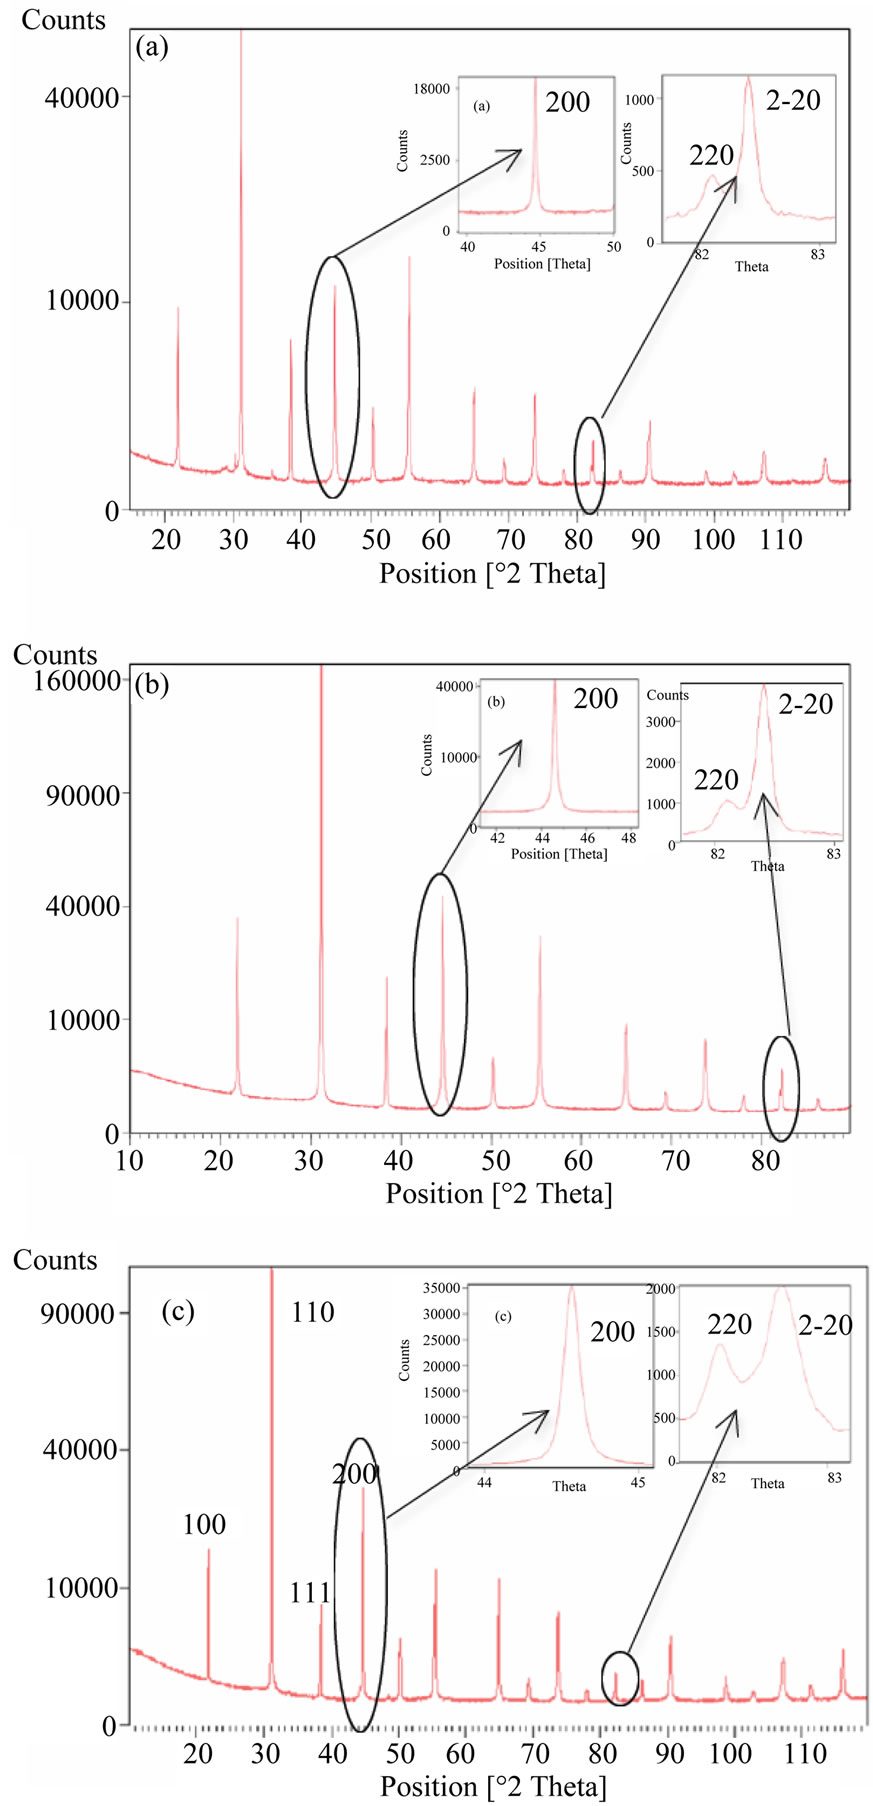
Figure 1. XRD reflexions of (a) undoped; (b) 1% Mn doped and (c) 2% Mn doped PZN-4.5PT single crytals and the (200) singled and (222) doubled peaks.
slightly to 4.060 Å (for 2%). It appears in the further EPR results that the majority of the Mn was in its Mn2+ valence. The ionic radius of Mn2+ is 67 pm with 6 coordination bonds in this ionic state. This ion substitutes the B site (0.955Zn1/3Nb2/3-0.045Ti) ions. The ionic radius of Ti4+ is 61 pm. Thus, in terms of ionic radius and assuming that only Mn replaces Ti, Mn2+ will tend to have an expansionary effect on the structure of the single crystal. This effect is in competition with another one which is the presence of oxygen vacancies due to the doping. The latter will tend to contract the crystal lattice [9]. Finally,
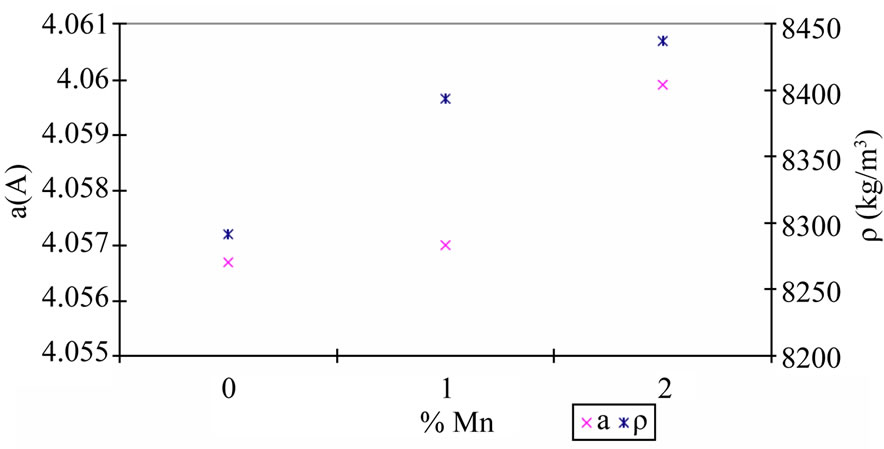
Figure 2. Evolution of the lattice parameter a and the density ρ versus the mol% Mn.
with a rate of 1% Mn, the created oxygen vacancies are enougth to inhibit the expansion effect, which explains why we obtain similar values for the 1% Mn doped and the undoped one. For 2% Mn doping, the Mn2+ ions effect becomes more important than that of oxygen vacancies, leading to the value of the cell parameter slightly higher for the 2% doped single crystal.
Figure 3 shows the EPR spectra. Two peaks are detected at about 1800 and 3200 Gauss which are attributed respectively to the Mn4+ and Mn2+ ions of the Manganese. The presence of the valence 4 can be seen, but it’s impossible to prove with this technique the presence of Mn3+ which has an anti-parallel spin. The ratio I Mn2+/ IMn4+ determined with the EPR spectrum is 9 and 8 respectively for the 1% mol Mn and the 2% mol Mn doped crystals where IMn2+ and IMn4+ are the intensities of the peaks attributed to Mn2+ and Mn4+. The Mn2+ amount in the crystals appeared to be around 90% and 80% of the Mn concentration (neglecting the Mn3+ ions). This spectrum is characterized by 6 asymetric peaks which are the signature of the Manganese. Compared to the first spectra obtained on classical perovskite components such as SrTiO3 [11,12] or PbTiO3 [13], its quality is bad. This can be explained by the Mn high concentration. Although low (around 1% and 2%) this concentration is very high for the EPR method, which is a very sensitive technique. While many studies are done on crystals without doping, impurities in the starting reagents are much sufficient to produce a clear signal. When the concentration of manganese increases, there is a line broadening that eventually drown completely the hyperfine structure which is attributed to the existence of magnetic coupling between manganese ions.
For the Raman spectroscopy in ambient temperature conditions (Figure 4), 6 spectral rays were observed, attributed to the bonds vibrations of Pb-O (125 cm–1), O-B-O (160, 270 cm–1 with B = Nb, Ti or Zn), Zn-O-Zn (410 cm–1), Nb-O-Nb (590 cm–1) and Nb-O-Zn (780 cm–1). This assignment is due to different reasons namely the frequency dependence and the mass of atoms, the vibration mode and the type of bonds. The peaks in-
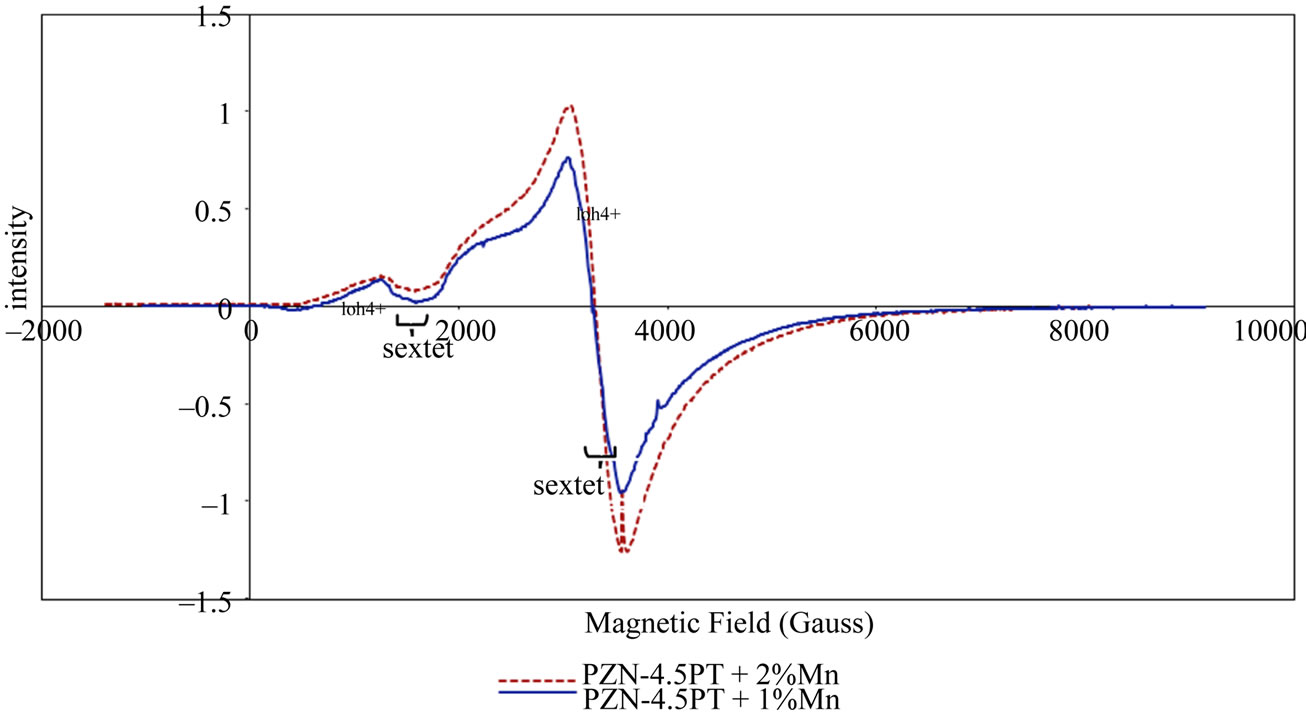
Figure 3. The EPR spectrum of Mn-doped PZN-4.5PT single crystals.
tensity remains unchanged regardless of the beam’s incidence direction for the undoped crystals.
This can be explained by the quality and the purity of the crystal but also an isotropic arrangement of crystal lattices, the local order which remains the same regardless of the chosen direction, by the nanorégions isotropy therefore no change in their volumes. For the Mn doped crystals, there are six spectral rays as in the undoped crystal’s curve. However we notice a difference in the intensity of the peaks and a dispersion between the spectra of the same single crystal as the incident point (edge or middle); the results are totally different on the undoped PZN-PT. The difference in the peaks intensity behavior could be explained by the presence of foreign elements (Mn) compared to the undoped single crystal, oxygen vacancies and inclusions in the perovskite structure of doped crystals. For the discrepancy observed between the spectra of the two incidence directions, it could be explained by the inhomogeneity and the existence of dipolar defects which may create non-uniformly distributed nanodomains. Indeed, it is known that Raman spectroscopy can be used to highlight changes in local structure by the peak intensity variation, the value at midheight and the shift of peaks at 780 and 270 [14]. This behavior is also explained by the peak intensity’s decrease at 270, 590 and 780 when Mn rate increases. The peaks assignment to precise vibration modes is made taking also into account the studies by Gupta et al. [15] on PZN-PT.
Figure 5 shows the relative dielectric permittivity evolution versus temperature at 1 kHz for undoped and 1 to 2 mol% Mn doped PZN-4.5PT single crystals polarized along the [110] direction. For all the crystals, the first transition temperature corresponds to a rhombohedraltetragonal transition and the last to a tetragonal-cubic transition. The second transition temperature, when it exists, corresponds to the orthorhombic-tetragonal transition (1% mol Mn). The existence of the orthorhombic phase as an intermediate state between the rhombohedral and tetragonal phases in the temperature diagram has already been observed by Renault [16] and Priya [2]. Beyond the conventional transitions rhombohedral-tetragonal-cubic inherent in this composition, poling along [110] direction may favor the existence of an ortogonal and/or orthorhombic macrosymetry associated with dipolar domains particular arrangement in the volume of the crystal.
This arrangement can promote the emergence and/or the volume of different present phases in temperature and their distribution in volume from a sample to an other one. This was described by Chen et al. [17] who believe that the presence of mixed valence (Mn3+ and Mn2+) destabilizes the orthorhombic phase. This would explain why in some cases this transition is not visible on the curves (2% mol Mn). It seems therefore difficult to interpret the transition temperatures evolution according to the doping level. It appears that doping increases clearly the ferro-para transition temperature. The ferro-para transition peak is much more diffuse with the doped materials. The diffuseness increases with doping suggesting that the interaction between depolar groups and random defects plays an important role in the relaxor behavior. Additionally, polarization versus electric (P-E) hysteresis measurements may provide some informations about the defects mobility and the internal field due to the defects. Figure 6 shows the P-E behavior for the doped and the pure PZN-4.5PT single crystals after 3 cycles to stabilize the cycle. The different ferroelectric values obtained from these curves are summarized in the Table 1. The coercive field (Ec) values increase in contrast to the saturation (Ps) and remanent (Pr) polarizations which decrease sharply with the doping level (except for Pr
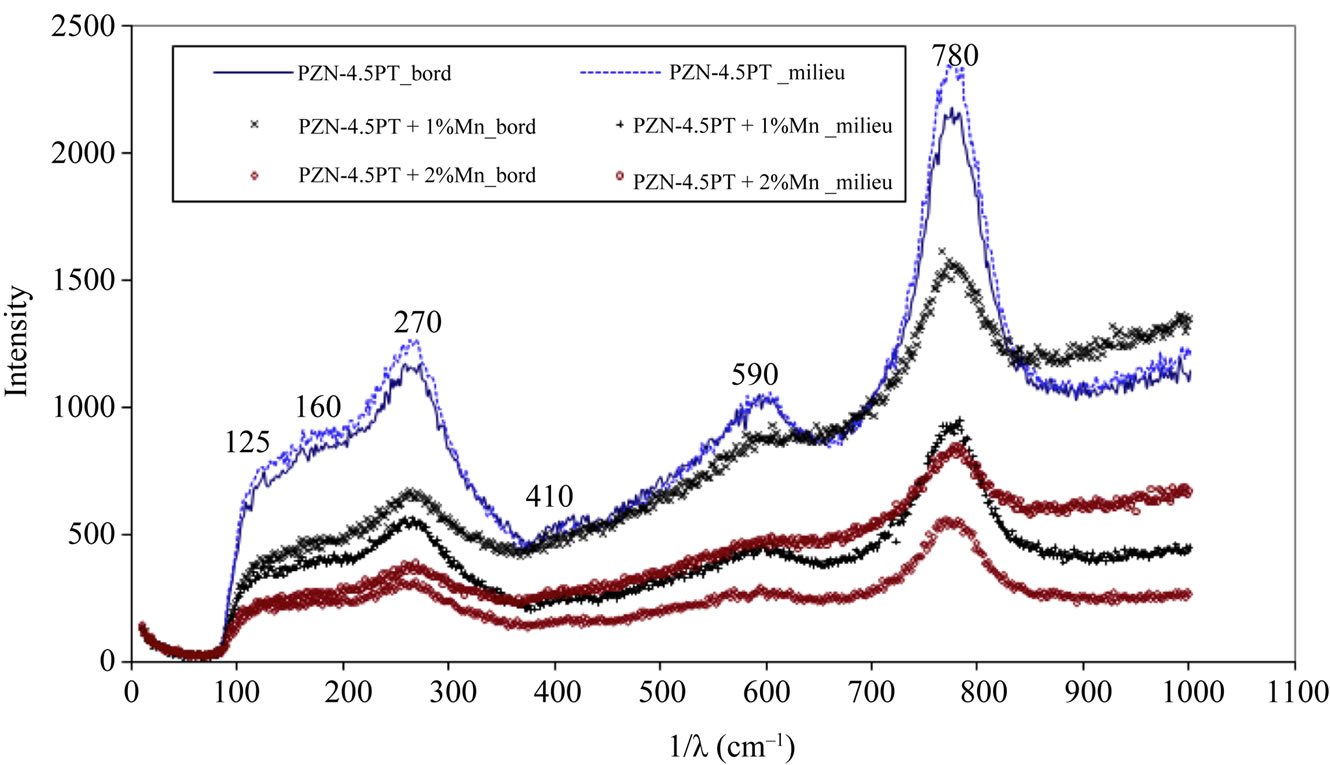
Figure 4. Raman spectrum of Mn doped PZN-4.5PT single crystals with parallel and orthogonal incident rays to the face (milieu: incident ray parallel to the z axis; bord: incident ray parallel to the y axis).
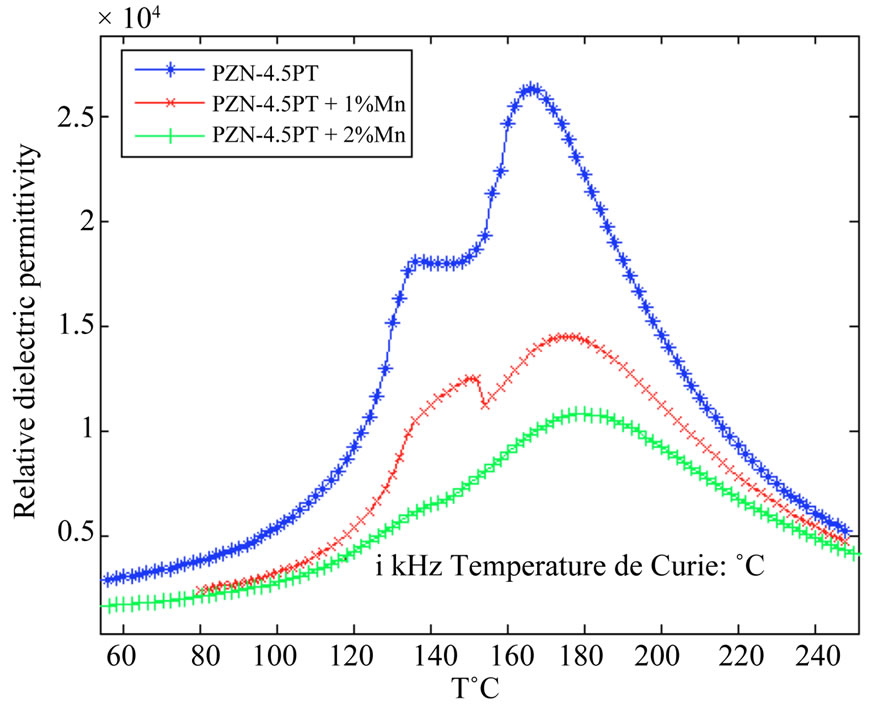
Figure 5. Relative dielectric permittivity versus temperature for undoped, 1% Mn doped and 2% Mn doped <110> oriented PZN-4.5PT single crystals.
value which increases slightly from 30 to 32 μC/cm2). One of the most marked effects of doping is also to foster a relationship Pr/Ps high. This effect can be explained by the fact that the blocked dipoles once released by a relatively high field are struggling to return to there initial state when the field vanishes. The acceptor dopants such as manganese are known to increase the values of coercive fields and stabilize the dipolar domains distribution within the material. The most common explanation is linked to the existence of mobile oxygen vacancies that come under stress and block the movement of domain walls making it more difficult to reverse the polarization and promoting stability of domains induced by the polarization [18]. The higher value of coercive fields obtained on the polarization direction [110] is in good agreement with previous results of C. Jullian [19]. This author has shown that at equivalent time’s polarization, it took just a field of 8 kV/cm to achieve maximum polarization for <001> while it took a 13 kV/cm field polarization for <110>. This is explained by the existence of nucleation points at the domain walls that depend on the domains number. Knowing that this number in the [001] direction is more important than that of [110], the nucleation starts more quickly and requires little energy to reverse polarization in that direction.
Electric field cycling produces butterfly shaped strainelectric field (S-E) curve (butterfly hysteresis loops). The process is described in Figure 7. The initial loading cycle starts at the point (0, 0). There is no strain response until the electric field reaches the coercive field and the material switches to the polarized state. At point A the material has positive remanent polarization and remanent strain. When a negative electric field is applied, the ions in the crystal structure experience a force that moves them toward a cubic state. This distorts the structure toward that of the unpoled crystal. When the coercive field is reached at point E, the field value is equal to –Ec, the polarization direction begins to switch. After the polarization has switched to the direction of the applied electric field, this latter acts to stretch the unit cell, giving a positive strain at point F. When the electric field is then reduced to zero, the remanent strain at point D coincides with that at point A but the remanent polarization is negative. Thus, as a positive electric field is applied to the negatively polarized material, the ions in the crystal structure again experience a force that moves them toward a cubic state. The coercive field is reached at point B, and the polarization has completely switched direction again at point C. The electric field is reduced to zero and the
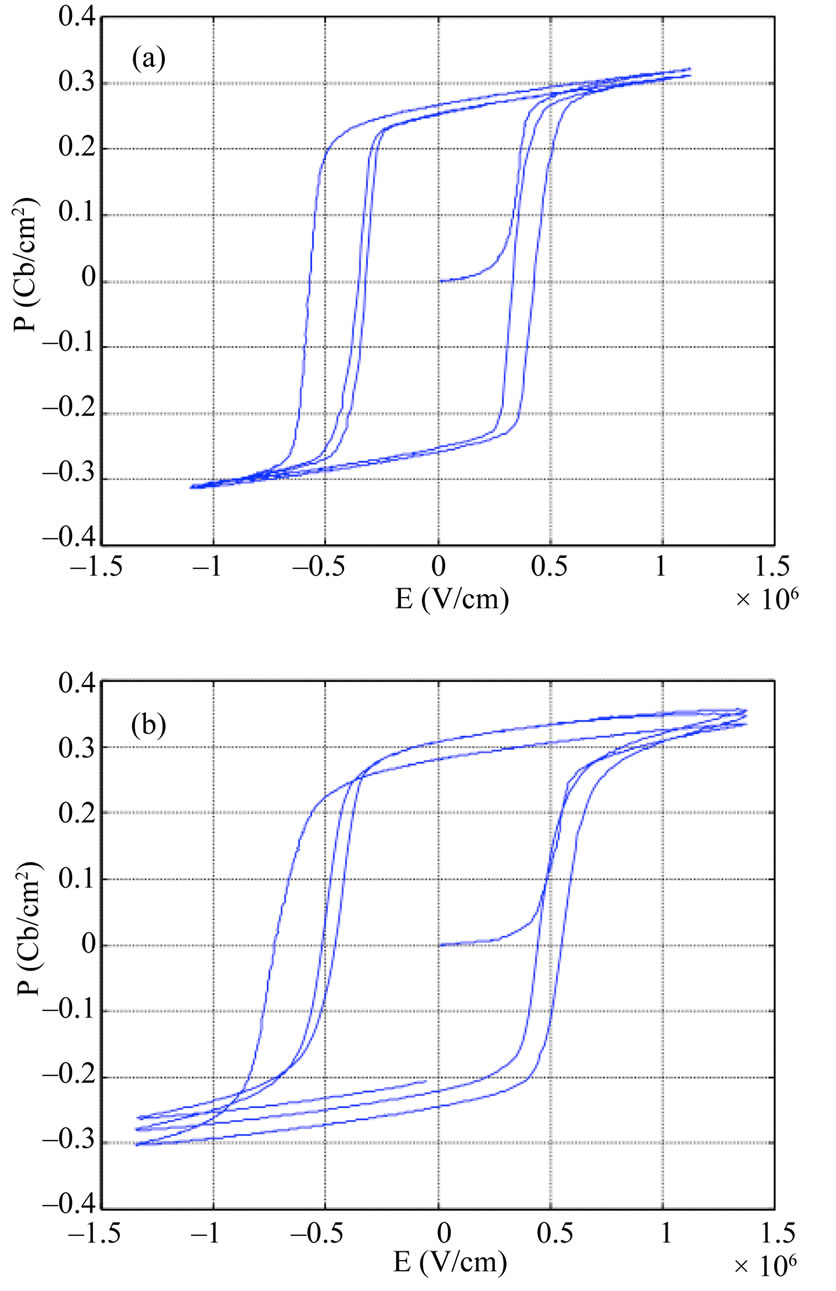

Figure 6. Hysteresis loops of (a) undoped, (b) 1% Mn doped and (c) 2% Mn doped PZN-4.5PT% single crystals.
material returns to point A with positive remanent polarization and remanent strain [20]. It was found that [110] oriented doped crystals show the onset of a strain-field asymmetry, which grows as doping continues as shown in Figures 7(b) and (c). In contrast, undoped crystals shows symmetrical strain-field curve throughout cycling, as seen in Figure 7(a). This latter suggests that no net
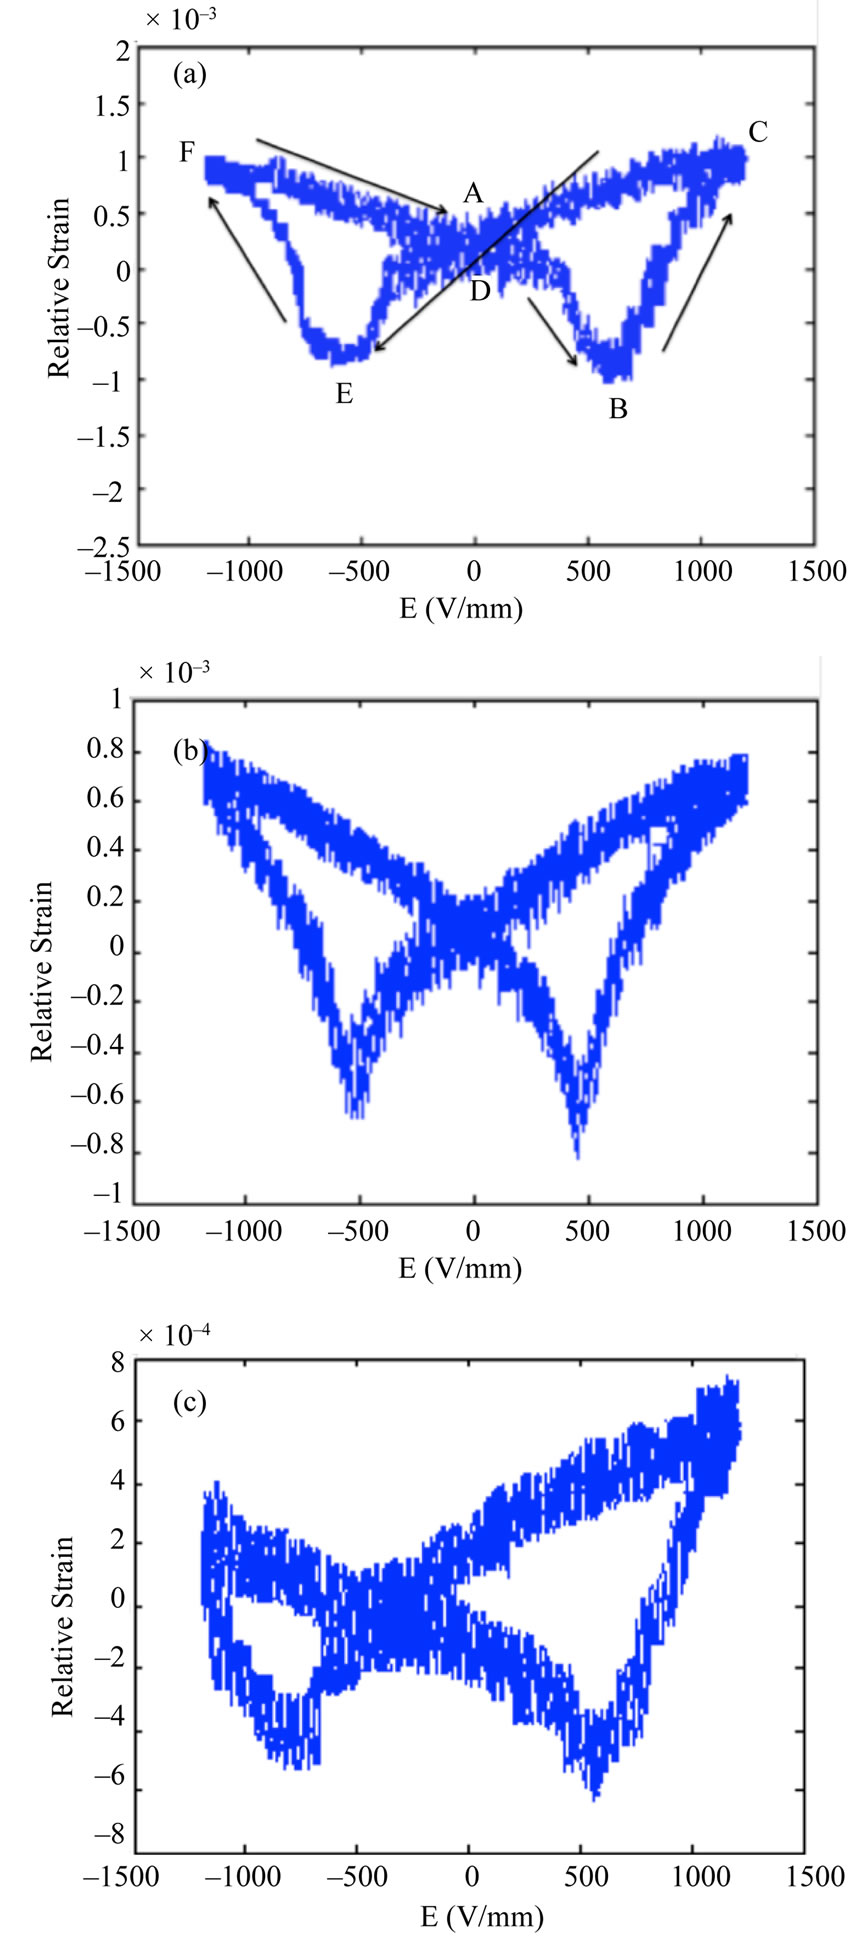
Figure 7. Relative Strain versus electric field for (a) undoped; (b) 1% Mn doped and (c) 2% Mn doped <110> PZN-4.5PT single crystals.
internal fields develop in the undoped [110] oriented single crystal. The internal fields that develop in doped crystals are locally inhomogeneous. The Mn doping creates local internal fields sufficiently large that the asymmetry in the strain-field increases with the doping rate. The deformation value decreases when the doping increases confirming that Mn create a hardness behavior for PZN-PT single crystals. This result confirms the compliance values variation and the Raman spectroscopy results with the doping.
In Table 1, the increase of the coercive field Ec, Tc and decrease of TRT can be explained by the domain walls pinning which make difficult subsequent reorientation poling versus field due to the presence of Mn ions. They create a large temperature interval for the crystal’s application by increasing the Tc and Ec values. This behavior confirms the role of Mn which is the crystal’s stabilization. These results show that Mn is acting as a hardener, by decreasing the piezoelectric and dielectric properties and increasing the mechanical properties in the <110> PZN-PT crystals. The Q31 (139), the  (1061 m/s) increased largely with Mn doping (441, 1268 m/s for 1% Mn and 336 and 1776 m/s for the 2% Mn doping). This shows that the doping rate increase could have undesirable effects on the properties.
5. Conclusions
Mn modification of PZN-4.5PT single crystal imparts hard and soft characteristics. The results show that Mn substituting:
1) Improves Qm,  , Tc and Ec.
2) decreases, strain, d31, g31, k31, relative dielectric permittivity, Ps and Pr.
3) increases the crystals using temperature.
The choice of an approriate Mn doping rate is important because it affects the properties. The strain-field curves show that the Mn doping creates local internal fields which cause an asymetric behavior. This result is in agreement with our explanation for the Raman’s spectroscopy results. Further investigations are needed, varying the dopant concentration from 0 to 2, to understand the limit of Mn doping increasing effects on <110> PZN- 4.5PT single crystals.
6. Acknowledgements
This work is supported by the Senegalese Ministry of Higher Education and Scientific Research.
REFERENCES
- L. Lebrun, et al., “Morphotropic Phase Boundary Perovskites, High Strain Piezoelectrics and Dielectric Ceramics,” Ceramics Transaction, Vol. 136, 2002, pp. 117- 126.
- S. Prya and K. Uchino, “Dielectric and Piezoelectric Properties of the Mn-Substituted PZNT Single Crystal,” Journal of Applied Physics, Vol. 91, No. 7, 2002, pp. 4515-4520. doi:10.1063/1.1459101
- T. Liu and C. S. Lynch, “Ferroelectric Properties of [110], [001] and [111] Poled Relaxor Single Crystals: Measurements and Modeling,” Acta Materiala, Vol. 51, No. 2, 2003, pp. 407-416. doi:10.1016/S1359-6454(02)00422-6
- S. Prya, K. Uchino and D. Viehland, “Crystal Growth and Piezoelectric Properties of Mn-Substituted Pb(Zn1/3Nb2/3) O3 Single Crystals,” Japanese Journal of Applied Physics, Vol. 40, 2001, pp. L1044-L1047. doi:10.1143/JJAP.40.L1044
- W. Chen and Z.-G. Ye, “Top-Cooling-Solution-Growth and Characterization of Piezoelectric 0.955Pb(Zn1/3Nb2/3) O3-0.045PbTiO3 [PZNT] Single Crystals,” Journal of Materials Science, Vol. 36, No. 8, 2001, pp. 4393-4399. doi:10.1023/A:1017914331989
- B. Jaffe, W. R. Cook and H. Jaffe, “Piezoelectric Ceramics,” Academic Press, London, 1971.
- S. Zhang, et al., “Growth and Characterization of FeDoped Pb(Zn1/3Nb2/3)O3-PbTiO3 Single Crystals,” Journal of Applied Physics, Vol. 93, No. 11, 2003, pp. 9257-9262. doi:10.1063/1.1571966
- A. Benayad, et al., “Characteristics of Pb[(Zn1/3Nb2/3)0.955 Ti0.045]O3 Single Crystals versus Growth Method,” Journal of Crystal Growth, Vol. 270, No. 1-2, 2004, pp. 137-144. doi:10.1016/j.jcrysgro.2004.06.017
- L. Lebrun, et al., “Dielectric and Piezoelectric Propertries of (La, Mg, F) and (Mg, Mn, F) Doped PZT Ceramic under Low and High Solicitations,” Journal of the European Ceramic Society, Vol. 21, No. 10-11, 2001, pp. 1357- 1360. doi:10.1016/S0955-2219(01)00018-8
- IEEE Standard on Piezoelectricity, ANSI/IEEE Std 176- 1987.
- R. A. Serway, et al., “Electron Paramagnetic Resonance of Three Manganese Centers in Reduced SrTiO3,” Physical Review B, Vol. 16, No. 11, 1977, pp. 4761-4768. doi:10.1103/PhysRevB.16.4761
- K. A. Müller, “Electron Paramagnetic Resonance of Manganese IV in SrTiO3,” Physical Review Letters, Vol. 2, 1959, pp. 341-343.
- D. Hennings and H. Pomplun, “Evaluation of Lattice Site and Valence of Mn and Fe in Polycrystalline PbTiO3 by Electron Spin Resonance and Thermogravimetry,” Journal of the American Ceramic Society, Vol. 57, No. 12, 1974, pp. 527-530. doi:10.1111/j.1151-2916.1974.tb10802.x
- J. E. Spanier, et al., “Single Crystal Mesoscopic Films of Lead Zinc Niobate—Lead Titanate: Formation and Micro-Raman Analysis,” Applied Physics Letters, Vol. 79, No. 10, 2001, pp. 1510-1512. doi:10.1063/1.1397761
- S. Gupta, et al., “Study of Structural Phase Transitions in Solid-Solution (1–x)PZN–xPT Relaxor Ferroelectric Using Raman Scattering,” Journal of Raman Spectroscopy, Vol. 31, No. 10, 2000, pp. 921-924. doi:10.1002/1097-4555(200010)31:10<921::AID-JRS622>3.0.CO;2-G
- A. Renault, “Propriétés Piézoélectriques Géantes dans les Moncristaux PZN-x%PT (x = 4,5 et 9): Relation Conditions de Polarization—Structure en Domaines,” Thesis Ecole centrale de Paris, Paris, 2002.
- Y. H. Chen, K. Uchino and D. Viehland, “Substituent Effects in 0.65Pb(Mg1/3Nb2/3)O3-0.35PbTiO3 Piezoelectric Ceramics,” Journal of Electroceramics, Vol. 6, No. 1, 2001, pp. 13-19. doi:10.1023/A:1011413518237
- Y. H. Chen, et al., “Mn Modified Pb(Mg1/3Nb2/3)O3- PbTiO3 Ceramics: Improved Mechanical Quality Factors for High-Power Transducers Applications,” Japanese Journal of Applied Physics, Vol. 39, 2000, pp. 4843-4852. doi:10.1143/JJAP.39.4843
- C. Jullian, J. F. Li and D. Viehland, “Investigation of Polarization Switching in (001)c, (110)c and (111)c Oriented 0.955Pb(Zn1/3Nb2/3)O3-4.5PbTiO3 Crystals,” Journal of Applied Physics, Vol. 95, No. 10, 2004, pp. 5671- 5678. doi:10.1063/1.1699500
- C. S. Lynch, “The Effect of Uniaxial Stress on the Electro-Mechanical Response of 8/65/35 PLZT,” Acta Materiala, Vol. 44, No. 10, 1996, pp. 4137-4148. doi:10.1016/S1359-6454(96)00062-6