Journal of Modern Physics
Vol.3 No.1(2012), Article ID:16743,9 pages DOI:10.4236/jmp.2012.31007
Investigations of Ion Confinement by Direct Current Coaxial Glow Discharge
1Physics Department, Faculty of Science, Benha University, Benha, Egypt
2Physics Department, Education College of Afif City, Shaqra University, Riyadh, KSA
3Applied Physics Department, Faculty of Applied Sciences, Taibah University, Madinah, KSA
4Plasma Physics Department, Atomic Energy Authority, Cairo, Egypt
Email: hassouba@yahoo.com
Received June 15, 2011; revised August 10, 2011; accepted September 9, 2011
Keywords: Inertial Electrostatic Confinement; Virtual Anode; Coaxial Glow Discharge
ABSTRACT
A cylindrical dc coaxial glow discharge system with inner grid cathode was designed for ion confinement, and successfully operated with low discharge current. The plasma is formed inside the cylindrical grid cathode. The discharge current-voltage characteristic curves and Paschen curve are obtained at different gas pressures. Langmuir probes are used to determine the electron temperature and the plasma density. The electron energy distribution functions indicated that, two groups of electrons, appear in radial interval from r = 12 mm up to r = 5 mm. One group of electrons with most probable energy around 1 eV appeared from r = 5 mm up to r = 0 mm. The electron temperature Te is increased with increasing the current and also with moving from the center toward the grid cathode. Poisson’s equation is used to calculate the plasma density at different radial positions. The plasma density measured by the single probe is around 1015 m–3. A comparison is obtained between calculated plasma density and that measured by Langmuir probes. Experimental and calculated results have the same profile.
1. Introduction
Inertial electrostatic confinement (IEC), originally, was proposed by Farnsworth, the inventor of electronic television [1]. The cylindrical dc coaxial glow discharge system is used to give inertial electrostatic confinement for ions. A cylindrical grid cathode is put inside a cylindrical vacuum vessel (anode), when a low dc voltage is applied on the coaxial electrodes; the plasma is formed around the axis inside the grid cathode. In a negative grid dc coaxial glow discharge, ions of the gas species are produced by electron-impact ionization. The ion beam is accelerated and passes through the grid cathode, forming a virtual anode which decelerates the ions to arrive at the center of the device [2]. The ion beam collides with the neutral gas atoms after it passes the grid cathode, causing secondary electrons to be emitted. These secondary electrons enter the trapping region and cause sufficient ionization to maintain the discharge. Most of the discharge voltage causing the ion and electron acceleration is across the region near to the cathode [3]. Wendt et al. [4] reported that the impact of the ions on the cathode produces secondary electron emission and the electrons are accelerated towards the plasma and confined near the cathode.
Inertial electrostatic confinement has been studied by Miley et al. [5], who studied the breakdown voltage characteristics as a function of pressure-electrode separation (pd), using a spherical cathode grid mounted concentrically within a grounded spherical vacuum vessel, which served as the anode. Yamauchi et al. [2], using a pulsed discharge confirmed, by experimental measurements and simulation calculations, that a virtual anode is formed in the central part inside the grid cathode in a spherical glow discharge for a portable neutron source.
Popov et al. [6] studied the electron energy distribution function and the temperature of the electron groups using a Langmuir single probe, in a dc discharge tube with coaxial electrodes, for argon plasma. They studied the relation of gas pressure to both the electron groups’ temperatures and their concentrations. Gu and Miley [7] designed a pulsed spherical inertial electrostatic confinement system to focus and accelerate ions and electrons radially inward towards the center of a negatively biased, highly transparent spherical grid. The converging ions create a high-density plasma core where a high fusion rate occurs. In addition, under proper conditions, the ion and electron flows create a space charge induced double potential well (a negative potential well within a positive potential well). This structure traps high-energy ions within the virtual anode created by the double potential.
Most of studies on inertial electrostatic confinement were occurred by spherical discharge. The cylindrical discharge is different from planar discharge as well as from spherecal one, and it was lacked in inertial electrostatic confinement studies. In the present work, to study the cylindrical dc coaxial glow discharge, authors carried out an experimental device, diagnosed helium plasma. Authors described the positive ions motion during its converging from near the grid cathode up to the center of the device. Authors showed also in this work that, at different conditions and with using any technique, the plasma density have the same behavior, which is increased at the center. Also the electron temperature has the same behavior, which is always decreasing at the center.
2. Experimental Setup
Figure 1 shows a schematic drawing of the cylindrical dc coaxial glow discharge device. The device consists of two hollow coaxial cylinders made of stainless steel. The inner electrode is a grid cathode 90% transparency, 0.1 m in length and 0.04 m in diameter. The outer electrode is the anode and forms the vacuum vessel of length 0.15 m and diameter 0.05 m. The two cylindrical electrodes are isolated from each other by two glass discs.
Pure helium gas is used as the working gas and its pressure (p) is varied from 1 to 6 mbar, and the gas pressure measured using a dial gauge model Edwards capsule gauge CG16. The discharge current is varied between 10 and 20 mA. The device is operated using 1000 V stabilized dc power supply. The cylindrical glow discharge device is fixed in the horizontal position, and the obtained plasma is formed at the axis inside the grid cathode. The single and double cylindrical Langmuir probes, made of Tungsten wire, are used to determine the plasma parameters. Each probe has a radius of 0.14 mm and 3 mm in length. The distance between the two probes in the double probe is 2 mm. The probes are immersed into the plasma and can be moved radially from the grid cathode (r = 20 mm) up to the axis (r = 0).
3. Results and Discussion
3.1. Plasma Potential and Electric Field Structures
In the solid parallel plates and even solid coaxial glow discharges, plasma is formed between the two electrodes. This work deals with the case of cylindrical coaxial grid cathode glow discharge, which is different from the solid electrodes glow discharge [8], where the distance between the coaxial electrodes is less than the mean free path of the charged particles, so the plasma is formed at the axis inside the inner grid cathode. When an external dc voltage is applied between the cylindrical transparent grid cathode and cylindrical vacuum chamber (anode), the ion beam will be accelerated toward the grid, crosses through it and moves in the radial direction toward the center, forming a central virtual anode with high ion density. This virtual anode decelerates ions to reach the center by reflecting some of the ions toward its injection position [2]. The electrical characteristics of the virtual anode cylindrical glow discharge for Helium gas are measured. The formation of a bright plasma core inside the grid cathode and continuous radiation are observed. Source of the light emission was expected to be from excitation collisions between the ion beam and the neutral gas atoms.
Figure 2 shows the I-V characteristic curves for He discharge at different gas pressure with constant anode-cathode separation (d = 5 mm). The current essentially remained zero below the breakdown voltage VB. After breakdown the current increased as the discharge voltage increased. Also, it is clear from these curves that, VB decreased when the gas pressure was increased. A plot of VB versus pd (p is the gas pressure and d is the separation distance between the two electrodes) is shown in Figure 3. When the gas pressure increased, the mean free path is decreased and more neutral atoms are available for more collisions, then

Figure 1. Schematic drawing of the experimental setup.
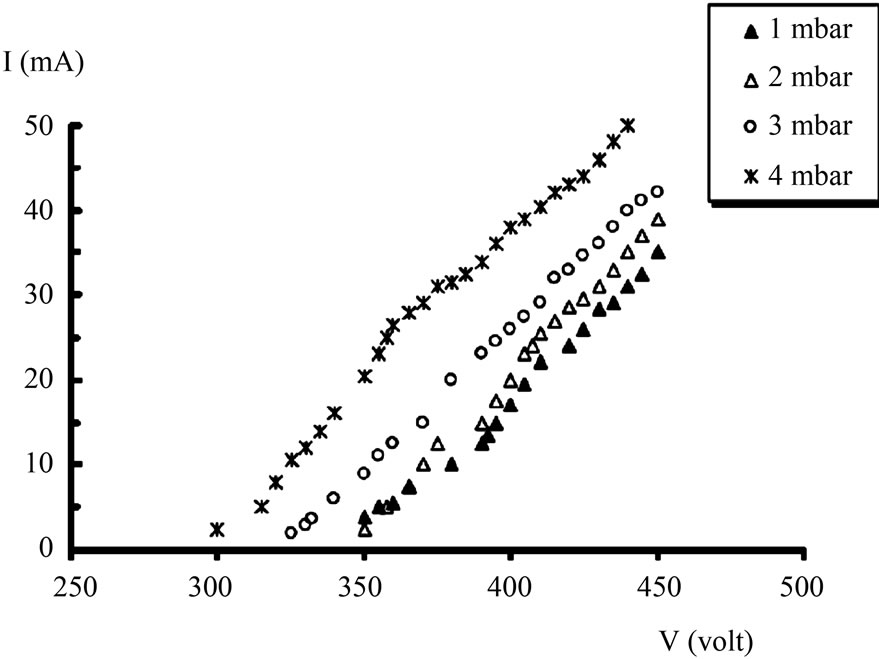
Figure 2. I-V characteristic curve of the dc coaxial cylindrical glow discharge for helium at different values of gas pressures.
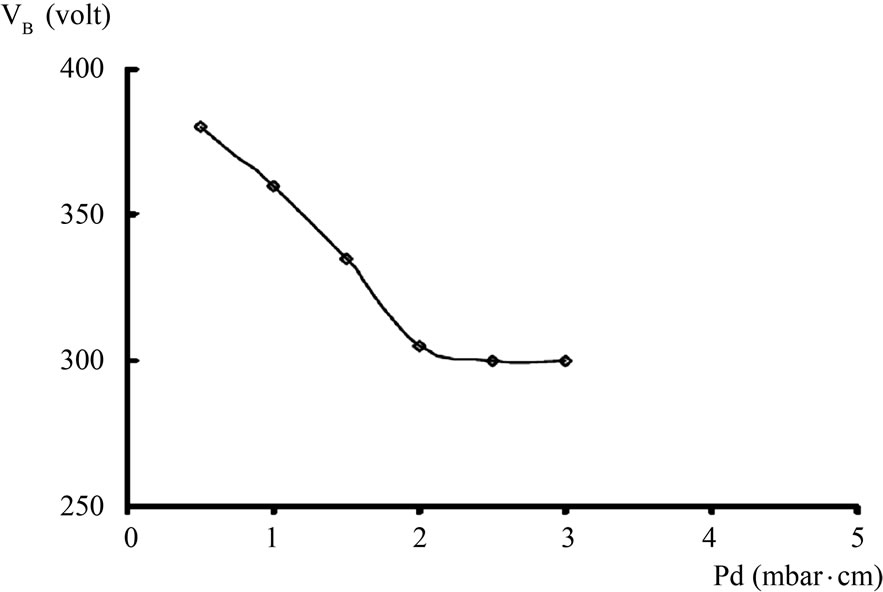
Figure 3. Paschen curve (the relation between the breakdown voltages as a function of pd) for helium discharge.
lower breakdown voltages are required. This was typical to the region on the left hand side of the Paschen curve.
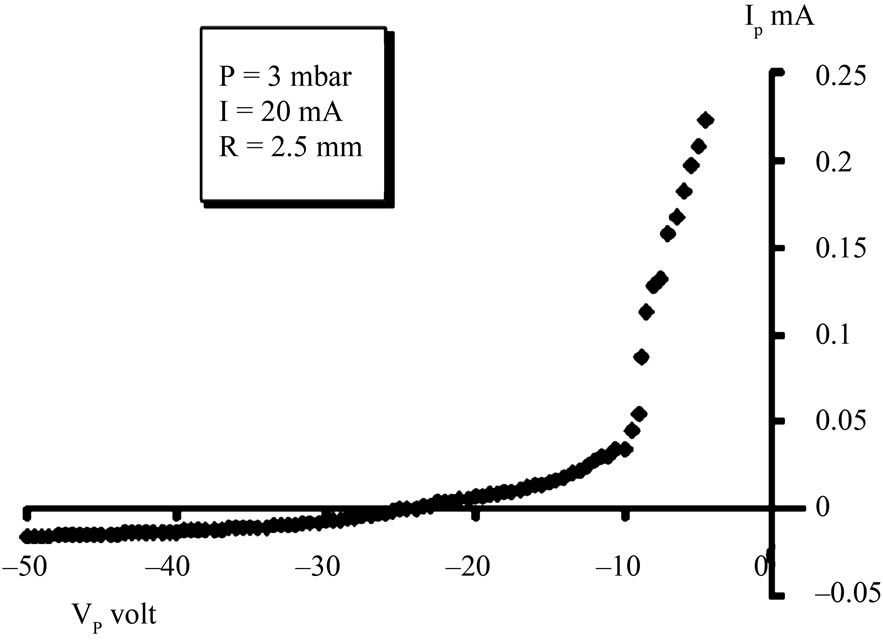
The plasma potential has been calculated from the zerocrossing point of the second derivative of the single probe I-V characteristic curves [9]. Figure 4" target="_self"> Figure 4(a) shows sample of the I-V curves of the single electric probe, at radial position 2.5 mm and constant helium pressure for constant discharge current, while Figure 4(b) gives the first and second derivatives of the previous curve. Figure 5 shows radial distribution of the plasma potential from the grid to the axis, at gas pressure of 3 mbar for 10 and 20 mA discharge currents. The electric field distribution as a function of radial position is shown in Figure 6, for the same conditions of discharge currents and gas pressure. After the ion beam starts to collide neutral gas atoms producing large number of secondary electrons and positive ions. A virtual anode is formed and decelerates these ions to reach the axis, means their kinetic energy is decreased and hence the potential increased as the probe moves from r = 12 mm inward toward the plasma core until reaching its maximum value at location of the virtual anode [2], i.e. at 2 mm and 8 mm, for discharge currents 10 and 20 mA respecttively (right hand side in Figure 5). When ions pass the virtual anode location they move direct toward the center and their kinetic energy is increased hence the potential is decreased. The rate of decrease of the potential for discharge current 10 mA is too small, because the velocity of ions moved toward the center is less than that for 20 mA discharge current. Presence of the virtual anode causes an electric field opposite to the original electric field so it called reversal field [10]. The effect of the reversal field increased as the probe moves from r = 12 mm directed to the plasma core (see the increase in the negative direction of the electric field in Figure 6). Then the reversal field is decreased with further movement inward until reaching the location of the virtual anode, where the total electric field is zero, and then it increases until reaching the center at r = 0 as shown in Figure 6.
 (a)
(a)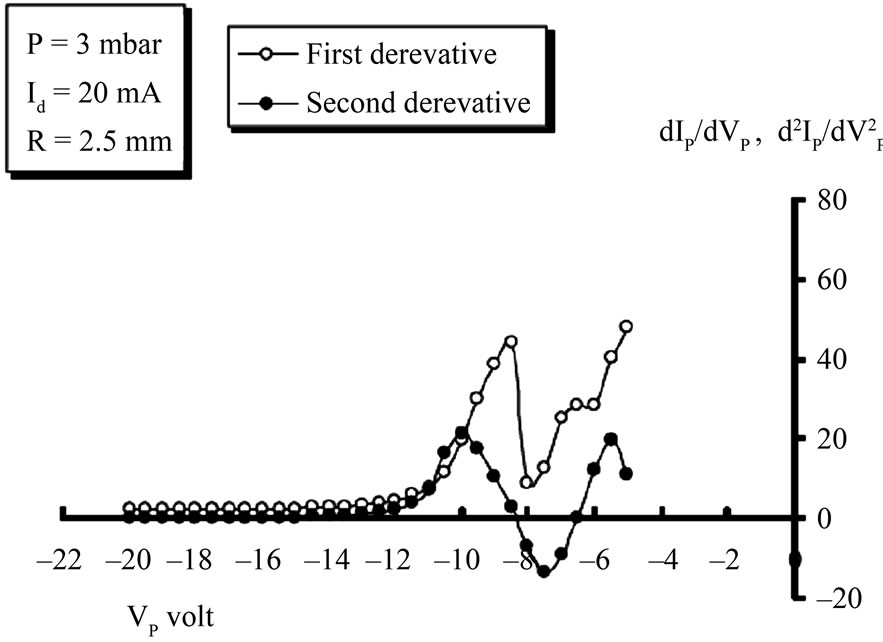 (b)
(b)
Figure 4. (a) The I-V characteristic curve of the single electric probe at radial position 2.5 mm at constant pressure 3 mbar for discharge current 20 mA; (b) The first and second derivatives for curve in Figure 4(a).
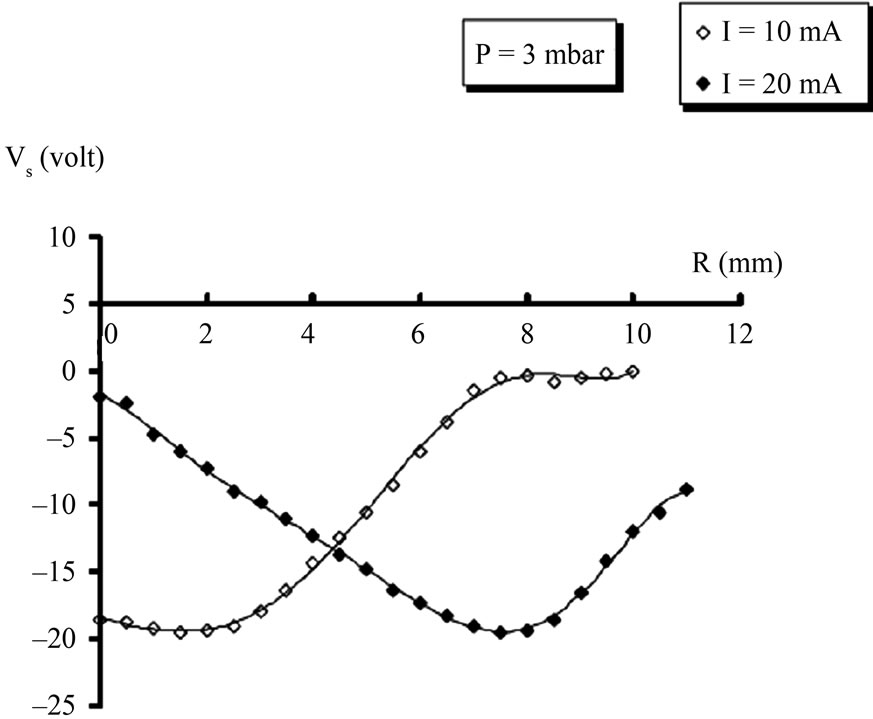
Figure 5. The plasma potential as a function of the radial position for two different discharge currents 10 and 20 mA at constant helium pressure 3 mbar.
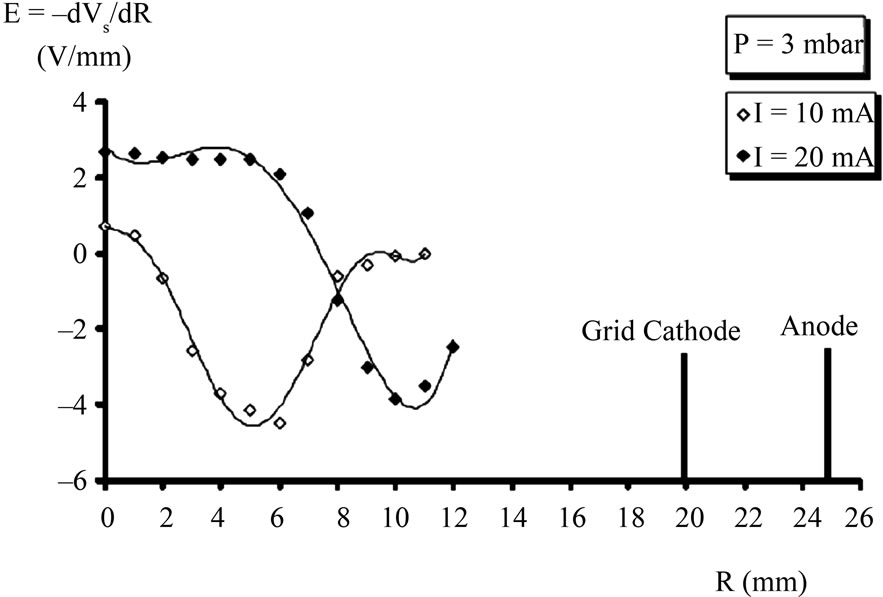
Figure 6. The radial electric field distribution of the dc cylindrical glow discharge with grid cathode for two different discharge currents and constant helium pressure 3 mbar.
3.2. The Electron Energy Distribution Function Measurements
The electron energy distribution function can be determined from the I-V curve of the single electric probe using the relation [11]:
 (1)
(1)
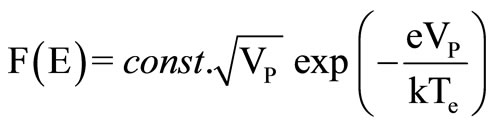
where m is the electron mass, A is the probe surface area, Vp is the probe potential with respect to the plasma potential and  is the second derivative of the electron probe current with respect to the probe potential. For the Maxwillian energy distribution the following relation is valid [12]
 (2)
(2)
Thus, the Maxwillian energy distribution is given by
 (3)
(3)
where k is the Boltzmann constant and Te is the electron temperature.
The electron energy distribution function is determined using Equation (1) at different radial positions from r = 12 mm to r = 0 mm (center of the system). Figure 7" target="_self"> Figure 7 shows the electron energy distribution function at radial positions r = 7.5 mm and r = 10 mm, measured from the center under gas pressure of 3 mbar and for two discharge currents (a) I = 10 mA and (b) I = 20 mA. From Figure 7" target="_self"> Figure 7 there are two peaks with different energies, are obtained which confirm existence of two groups of electrons (one with low energy and the other has high energy) at the radial positions 7.5 and 10 mm. The source of the high energy group may be due to the large number of ionizing collisions, occurred between the neutral gas atoms and the accelerated
 (a)
(a)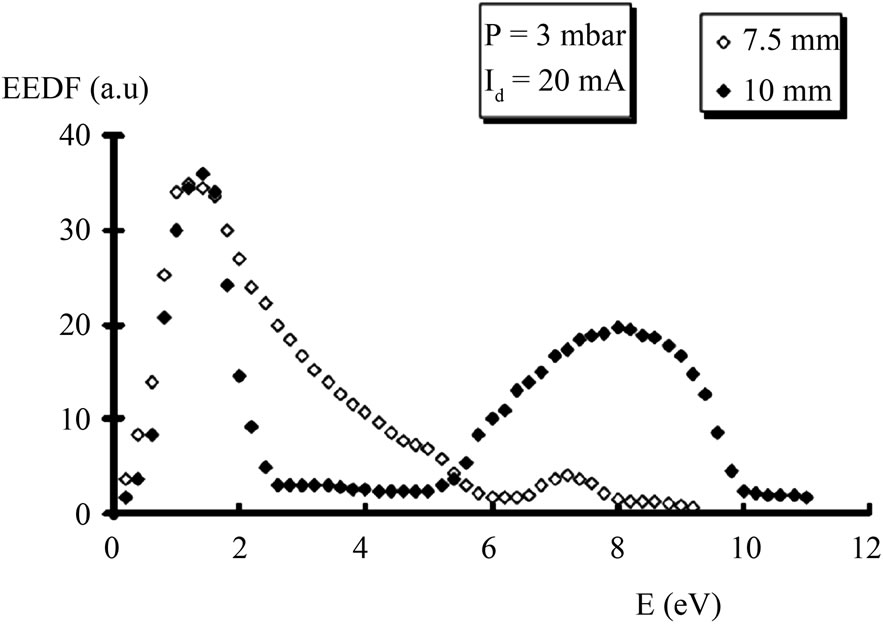 (b)
(b)
Figure 7. The electron energy distribution function for the dc coaxial cylindrical glow discharge at two radial positions 7.5 mm and 10 mm, with constant helium pressure 3 mbar for two constant discharge currents (a) 10 mA and (b) 20 mA.
ions which pass through the grid cathode toward the center. These collisions produce secondary electrons which gain energy from the strong electric field near the cathode, and represent the high energy group [10].
The low energy group of electrons may be formed due to the high energy group electrons which repelled by the grid cathode and accelerated inward by the virtual anode. These electrons moving rapidly toward the center of the system, making many of inelastic collisions with the neutral gas atoms, loosing most of their energy for collisions forming the low energy group. The presence of the two groups of electrons is confirmed theoretically by [10] and obtained experimentally by [13].
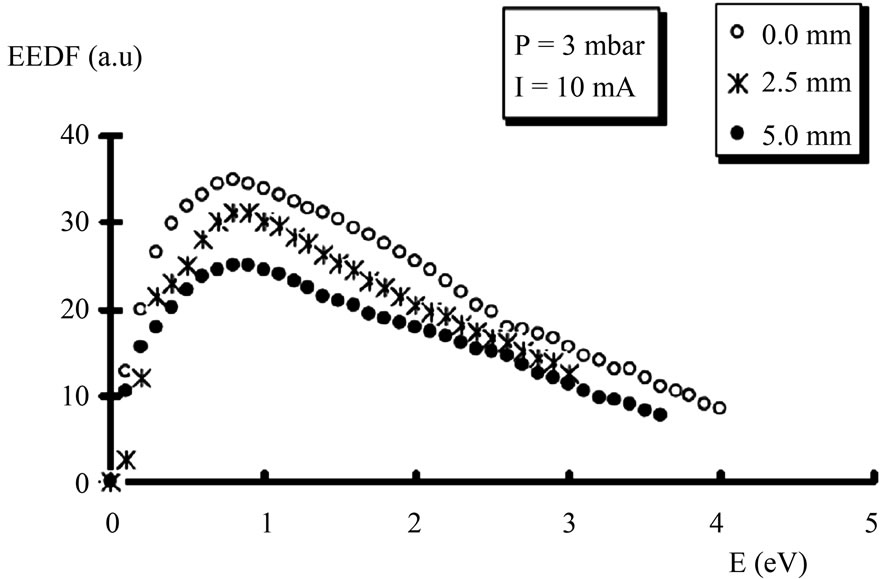
Figure 8 shows the electron energy distribution function at radial positions r = 0, 2.5 and 5 mm, under the same pressure 3 mbar for the same discharge currents. One peak found in all curves of Figure 8, indicates that there is one group of electrons in these radial positions, and the distribution of this group is found to be Maxwellian. The Maxwellian distribution is tested by a comparison between the
 (a)
(a)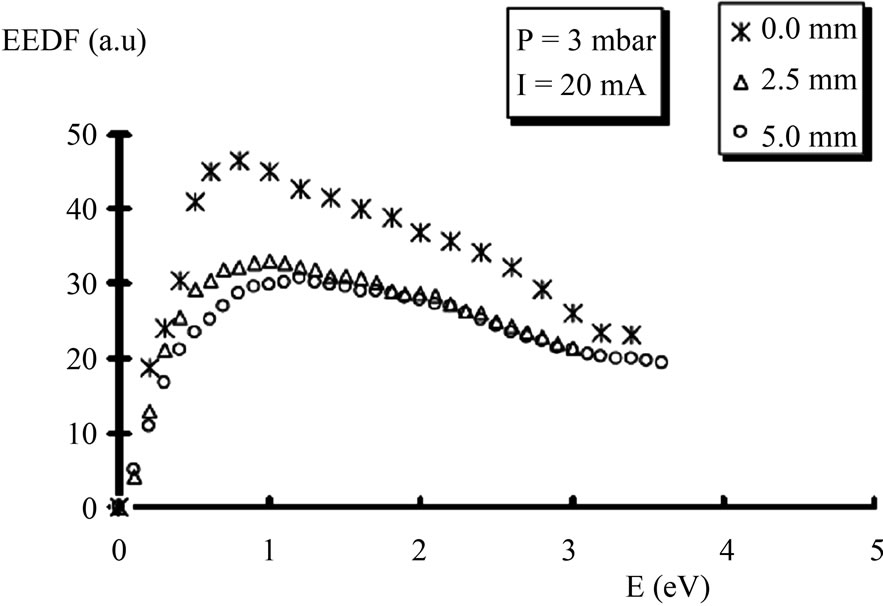 (b)
(b)
Figure 8. The electron energy distribution function for the dc coaxial cylindrical glow discharge at different radial positions 0, 2.5 and 5 mm, with constant helium pressure 3 mbar for two constant discharge currents (a) 10 mA and (b) 20 mA.
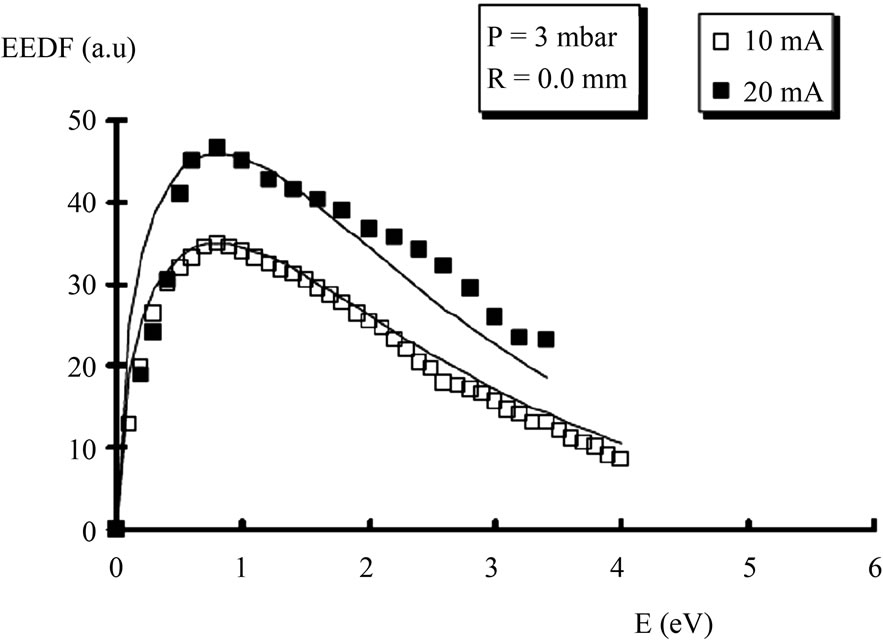
Maxwellian distribution function, calculated using Equation (3), and the experimental electron energy distribution function for the same discharge currents at two different radial positions (a) r = 0 mm and (b) r = 5 mm, under the same pressure 3 mbar as shown in Figure 9. An agreement between the measured and calculated electron energy distribution functions has been obtained, indicating the formation of one group of electrons, and indicating also the presence of the Maxwellian distribution for all electrons in radial interval from r = 5 mm to r = 0 mm.
3.3. Electron Temperature and Plasma Density
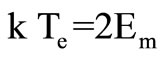
The electron temperature for helium dc coaxial cylindrical glow discharge is calculated using the single probe at different radial positions by multiplying the most probable energy Em by two, according to the following equation [14]:
 (4)
(4)
where K is the Boltzmann constant, Te is the electron temperature and Em is the most probable energy for the
 (a)
(a)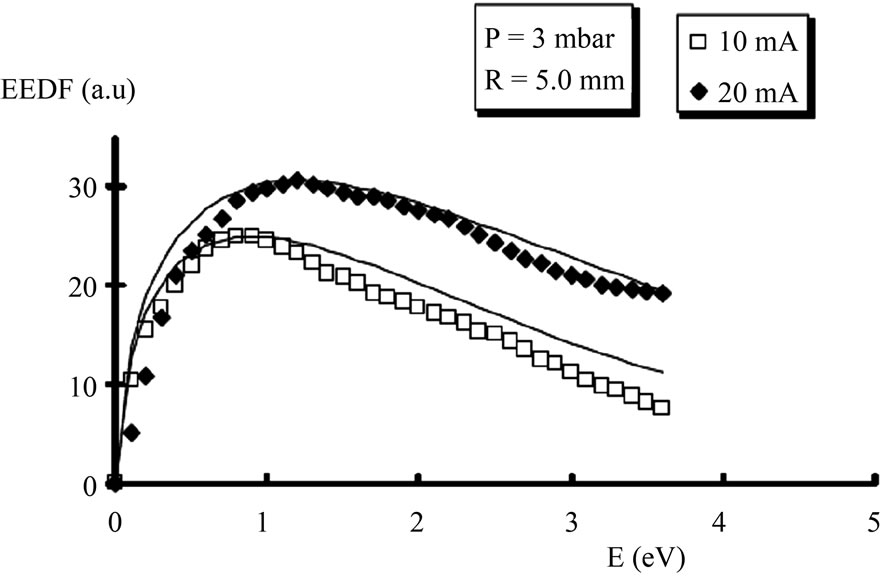 (b)
(b)
Figure 9. A comparison between the Maxwellian distribution function with the experimental electron energy distribution function for two discharge currents 10 and 20 mA at two radial positions (a) r = 0 mm and (b) r = 5 mm. Symbols represent experimental results while solid lines represent Maxwellian results. The helium-pressure is constant at 3 mbar.
electrons, which can be obtained from the peaks of the electron energy distribution function curves. The most probable energies for low energy group in radial interval from r = 12 mm to r = 5 mm, and the Maxwellian group of electrons in radial interval from r = 5 mm to r = 0 mm, are varied in the range from 1.3 eV to 0.8 eV for 10 mA discharge current. They also varied from 1.5 eV to 0.88 eV for discharge current 20 mA. So the radial electron temperatures Te from near the grid cathode (r = 12 mm) to the center (r = 0 mm) under constant helium pressure 3 mbar are varied from 2.6 eV to 1.6 eV, for 10 mA discharge current, while they are varied from 3 eV to 1.76 eV for discharge current of 20 mA. The most probable energies for the high energy group are varied from 6 eV to 8 eV, for the same two discharge currents at all radial positions in radial interval from r = 12 mm to r = 5 mm.
The electron temperature Te is obtained also by the double probe at different radial positions from the grid cathode up to the axis. The electron temperature values measured by the double probe are fair agreed with that measured by the single probe. Figure 10 shows a comparison between the electron temperature measurements, obtained by the single and double probes, as a function of the radial positions with constant helium pressure 3 mbar, for two different discharge currents (a) 10 mA and (b) 20 mA. The agreement between the single and double probe measurements may be due to the fact that, the Te measured by the single probe represents the energy of the low energy group of electrons. The density of this low energy group is high and it is the source of the measured current by the double probe. It is noticed from Figure 10 that the electron temperature has the lowest value at the center (r = 0) and increased with moving radially away toward the edge of the grid. This may be because the electron density is increased at the center and hence, the collision frequency for the electrons and the neutral atoms at the center is larger than that at the grid. This results in decrement in the electron temperature with moving toward the center. The electron temperature increased also with the increase of the discharge current may be because the increment of the discharge current leads to increase in the discharge voltage which causes an increase in the electric field and hence, the electron energy gained by the electric field is increased.
The ion density can be determined by the ion saturation current method that depends mainly on the values of the ion saturation current and the electron temperature, which obtained using the I-V characteristic of the single probe. The ion part of the single probe characteristic is frequently used in determination of the plasma density, according to the following equation [15]:
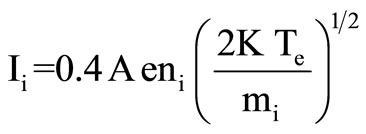 (5)
(5)
where Ii is the ion saturation current, A is the probe surface area, mi is the helium ion mass, ni is the plasma ion density and Te is the electron temperature. The ion saturation current is obtained from the extrapolation of the ion part of the single probe I-V curves toward the probe current axis. The ion density is measured by the single probe using Equation (5), for helium dc coaxial cylindrical glow discharge at constant pressure, and is found to vary from the grid to the center in the range of 2.3 ´ 1015 m–3 to 7.8 ´ 1015 m–3 for discharge current 10 mA and varied from 5 ´ 1015 m–3 to 5.3 ´ 1015 m–3 for discharge current 20 mA.
Also, the ion density is measured by the double probe at different radial positions at the same conditions of pressure and discharge currents. Values of plasma density measured by the double probe are varied from 2 ´ 1016 m–3 near the grid to 4.3 ´ 1016 m–3 at the center, for discharge
 (a)
(a)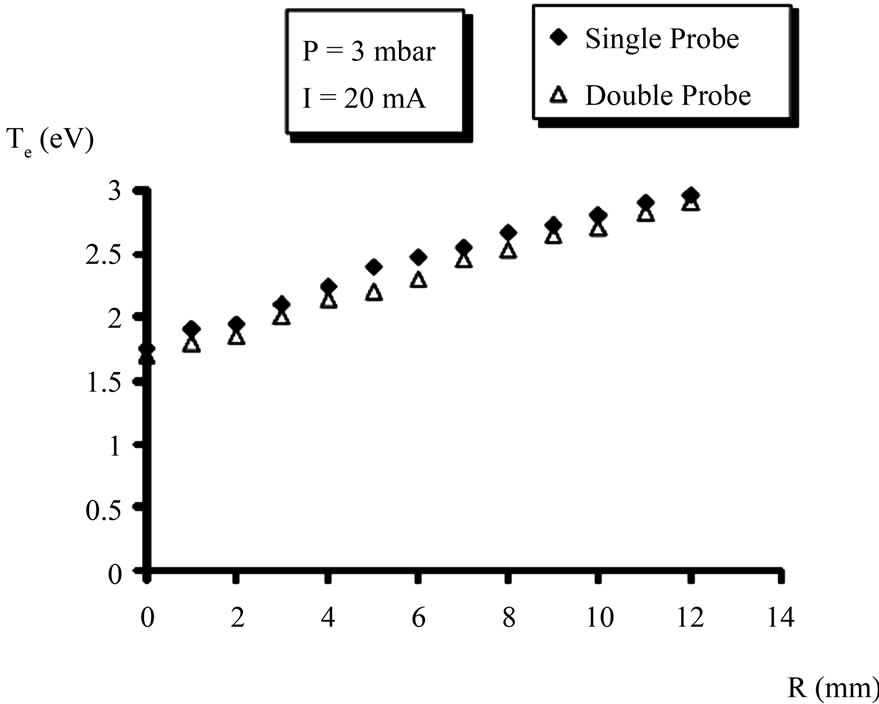 (b)
(b)
Figure 10. A comparison between the electron temperature measured by the single probe and that by the double probe as a function of the radial position, at constant pressure 3 mbar for two discharge currents, (a) 10 mA and (b) 20 mA.
current 10 mA, and varied from 1.6 ´ 1016 m–3 near the grid to 4.1 ´ 1016 m–3 at the center, for 20 mA discharge current.
Poisson equation in cylindrical coordinates is used to calculate the plasma ion density. The square potential gradient  in cylindrical coordinates (r,
  and z) is given by [16]
 (6)
(6)
because of the symmetry, there is no change occurred for the electric potential in  coordinate from 0 to 2π and so in z coordinate from 0 to 0.1 m (length of the grid cathode). This means the potential changes only with varying the radial position which is represented by the coordinate r. So
  and
and  are cancelled and hence Equations (6) can be rewritten as:

 (7)
(7)
But Poisson equation is given by:
 (8)
(8)
where εo is permittivity of the vacuum and ρ is the volume charge density which is defined by ρ = Q/v. The total charge Q is given by (N e), where N is the difference between the total number of ions and electrons inside the system and e is the elementary charge. So ρ= N e/v, but [(N/v) = n] hence ρ = n e, where n is the difference between ion density and electron density (n = ni – ne). Then Equation (8) is rewritten as:
 (9)
(9)
From Equations (7) and (9), we can write

and so
 (10)
(10)
The plasma electron density ne can be estimated from the I-V curves of the single probe according to the following equation [17]
 (11)
(11)
where Io, A, e, ne, K, Te and m are the electron current at local plasma potential, probe area, elementary charge, electron density, Boltzmann’s constant, electron temperature and the electron mass respectively. From Equations (5) and (11), the ratio between the ion density and the electron density ni/ne is given by
 (12)
(12)
By knowledge of the ion saturation current Ii and the electron current at local plasma potential Io, which can be estimated from the I-V curves of the single probe, the ratio ni/ne can be calculated. The experimental results showed that the average of the ratio between the ion density and the electron density at different radial positions is around to 14 and 20 for discharge currents 10 and 20 mA respectively as shown in Table 1. This means that, in our work, the ion density is larger than the electron density, at different radial positions inside the grid cathode, by 14 times for discharge current 10 mA and 20 times for 20 mA discharge current.
So by approximation we can neglect ne and rewrite Equation (10) as
 (13)
(13)
Equation (13) gives the ion density by knowledge first and second derivatives of the plasma potential with respect to radial position which carried out using the radial potential distribution curves shown in Figure 5.
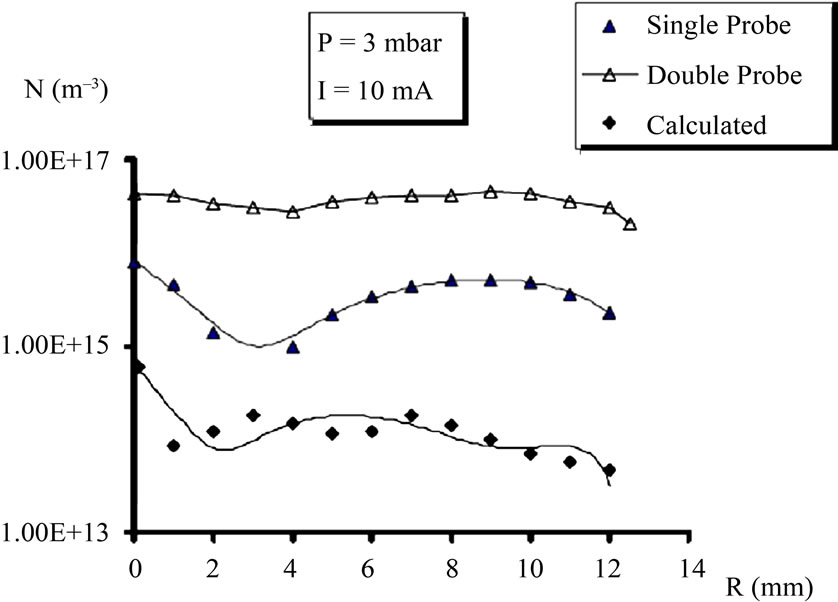
The ion density calculated by Poisson equation using Equation (13) was varied from 5 ´ 1013 m–3 near the grid to 6 ´ 1014 m–3 at the center, at discharge current of 10 mA and varied from 4 ´ 1013 m–3 near the grid to 3 ´ 1014 m–3 at the center, at discharge current of 20 mA. Figure 11 shows a comparison between values of the ion density

Table 1. The average of the ratio between the ion density and the electron density at different radial positions.
 (a)
(a)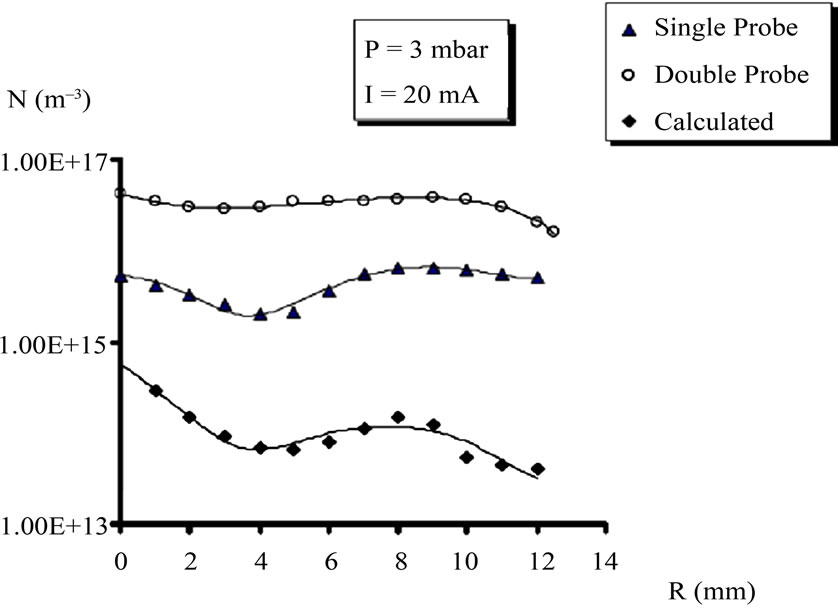 (b)
(b)
Figure 11. A comparison between the plasma ion density, calculated using Poisson equation, and that measured using the single and double probes at constant helium pressure 3 mbar for two different discharge currents (a) 10 mA and (b) 20 mA, as a function of radial position.
calculated using Poisson equation, with that measured by the single and double probes, as a function of radial position, at the same gas pressure 3 mbar for the same discharge currents (a) 10 mA and (b) 20 mA. The radial distribution of the ion density obtained by the three methods has the same profile, where the ion density increases as moving from the grid cathode directed inward until it reaches a certain point, then it decreases slightly with moving toward the center and finally it is increased gradually until reaches the center of the system at r = 0. This behavior can be explained as the ions which generated by the discharge, move toward the cathode and pass the grid toward the center under the effect of the electric field. Since the mobility of ions is low comparing with electrons, so they spend long time before they reach the center. Since the electric field at the grid cathode is higher than other regions, consequently ion velocity near the grid cathode is higher than that at other regions. Hence the ion density is small at the grid cathode and it increases with moving toward the center. When the virtual anode is formed, it causes recirculation for some of positive ions toward the grid cathode and decelerates more of ions to converge at the center; hence ion density is slightly decreased. After that ions are converged at the center from all directions, so the ion density is increased again until it reaches the center at r = 0 [2,7].
It is noticed from Figure 11 that values of ion density calculated using Poisson equation are different from and less than that obtained using the single and double probes. This related to Poisson equation gives the ion density with neglecting the term of electron density. It is known earlier that, the ion density is larger than the electron density at low pressures [18-20]. Also values of the ion density obtained using the single probe is less than that obtained by the double probe. This related to both single and double probe theories depend on the collisions between positive ions with the neutrals, within the sheath around the probe. In the single probe the scattering of ions due to collisions with the neutrals, leads to a decrease in the positive-ion current, means a decrease in the ion density, and this is not occurred in the double probe. So the single probe measurements must be different from and less than that obtained using the double probe [9].
4. Conclusions
A cylindrical dc coaxial glow discharge system with inner grid cathode was designed for ion confinement, and successfully operated with low discharge current. Pure helium gas was used as the working gas. The positive ions will move rapidly toward the grid cathode passing through it inward directed to the center, and the plasma was formed inside the inner grid cathode. A virtual anode is formed near the cylindrical center by the convergence of ions. The I-V characteristic curves and Paschen curve of the discharge were studied in pressure range of 1 - 6 mbar. Results confirmed that with increasing the gas pressure, the discharge current increased (at constant discharge voltage), and the breakdown voltage was decreased. The electric potential and electric field distributions were obtained radially. The magnitude of the potential increased with decreasing radial position until reaching its maximum value behind the grid, then it decreased with moving up to the axis. The virtual anode caused a reversal field which was opposite to the original one. So the location of the virtual anode is obtained from the zero point on the electric field distribution curves.
Results of the electron energy distribution function were shown that, within radial interval from near the grid cathode (r = 12 mm) until r = 5 mm, two groups of electrons were found and their energy distribution was nonMaxwellian. A single group of electrons with Maxwellian distribution was detected, in the radial interval from r = 5 mm to r = 0 mm. Fair agreement was obtained between the electron temperature Te measurements estimated by the single and double probes, from r = 12 mm to r = 0 mm, under constant helium pressure 3 mbar, for two discharge currents 10 and 20 mA. The electron temperature Te increased with increasing the radial position toward the grid, and also increased with increasing the discharge current.
The plasma ion density was measured experimentally by the single and double probes and compared with that calculated from Poisson equation, for the same conditions. Plasma ion density measured by the single probe were varied radially and was less than that measured by the double probe, and larger than that calculated from Poisson equation within an order of magnitude. Experimental results and calculated values have the same profile, where plasma density was increased with moving inward until reaching the virtual anode location, then it was decreased slightly with moving toward inside. Finally it was increased gradually until reaches the center of the system.
REFERENCES
- P. Farnsworth, “Electrical Discharge Device for Producing Interaction between Nuclei,” US Patent No. 3258402, 1966.
- K. Yamauchi, Y. Takenchi, Y. Ogino, M. Watanabe, A. Okino, Y. Sunaga and E. Hotta, “Neutron Production Rate and Plasma Characteristics of Spherically Convergent Beam Fusion,” Electrical Engineering in Japan, Vol. 135, No. 2, 2001, pp. 1-8. doi:10.1002/eej.1
- H. Shao, G. Lui, Z. Yang, C. Chen, Z. Song and W. Huang, “Characterization of Modes in Coaxial Vircator,” IEEE Transactions on Plasma Science, Vol. 34, No. 1, 2006, pp. 7-13. doi:10.1109/TPS.2005.863895
- A. E. Wendt, M. A. Liberman and H. Meuth, “Radial Current Distribution at a Planar Magnetron Cathode,” Journal of Vacuum Science & Technology A, Vol. 6, No. 3, 1988, pp. 1827-1831. doi:10.1116/1.575263
- G. H. Miley, Y. Gu, J. M. DeMora, R. A. Stubbers, T. A. Hochberg, J. H. Nadler and R. A. Anderl, “Discharge Characteristics of the Spherical Inertial Electrostatic Confinement (IEC) Device,” IEEE Transactions on Plasma Science, Vol. 25, No. 4, 1997, pp. 733-739. doi:10.1109/27.640696
- Tsv. K. Popov, M. Dimitrova and F. M. Dias, “Determination of the Electron Density in Current-Less Argon Plasma Using Langmuir Probe Measurements,” Vacuum, Vol. 76, No. 2-3, 2004, pp. 417-420. doi:10.1016/j.vacuum.2004.07.079
- Y. Gu and G. H. Miley, “Experimental Study of Potential Structure in a Spherical IEC Fusion Device,” IEEE Transactions on Plasma Science, Vol. 28, No. 1, 2000, pp. 331-346. doi:10.1109/27.842929
- A. Von Engel, “Electric Plasmas, Their Nature and Uses,” Taylor and Francis, London, 1983.
- E. Passoth, P. Kudrna, C. Csambal, J. F. Behnke, M. Tichy and V. Helbig, “An Experimental Study of Plasma Density Determination by a Cyliderical Langmuir Probe at Different Pressures and Magnetic Fields in a Cylindrical Magnetron Discharge in Heavy Rare Gases,” Journal of Physics D: Applied Physics, Vol. 30, No. 12, 1997, pp. 1763-1777. doi:10.1088/0022-3727/30/12/013
- V. I. Kolobov and L. D. Tsendin, “Analytic Model of the Cathode Region of a Short Glow Discharge in Light Gases,” Physical Review A, Vol. 46, No. 12, 1992, pp. 7837-7852. doi:10.1103/PhysRevA.46.7837
- V. A. Godyak, R. B. Piejak and B. M. Alexandrovich, “Measurements of Electron Energy Distribution in Low Pressure RF Discharges,” Plasma Sources Science Technology, Vol. 1, No. 1, 1992, pp. 36-58. doi:10.1088/0963-0252/1/1/006
- F. F. El-akshar, M. A. Hassouba and A. A. Graramoon, “Measurements of the Electron Energy Distribution Function in Two Different Regions of DC-Magnetron Sputtering Device,” Fizika A, Vol. 9, No. 4, 2000, pp. 177-186.
- B. Koo, N. Hershkowitz and M. Sarfaty, “Langmuir Probe in Low Temperature Magnetized Plasmas: Theory and Experimental Verification,” Journal of Applied Physics, Vol. 86, No. 3, 1999, pp. 1213-1220. doi:10.1063/1.370873
- J. R. Roth, “Industrial Plasma Engineering, Volume 1,” Institute of Physics Publishing, London, 1995. doi:10.1201/9781420050868
- R. Hippler, S. Pfau, M. Schmidt and H. K. Schoenbach, “Low Temperature Plasma Physics,” Wiley-VCH, Berlin, 2001.
- L. G. Grechko, V. I. Sugakov, O. F. Tomasevich and A. M. Fedorchenko, “Problems in Thermal Physics,” Mir Publishers, Moscow, 1977.
- D. Fang and R. K. Marcus, “Use of Cylindrical Langmuir Probe for the Characterization of Charged Particle Populations in a Planar Diode Glow Discharge Device,” Spectrochimica Acta, Vol. 45 B, No. 9, 1990, pp. 1053-1074
- M. B. Hopkins and W. G. Graham, “Langmuir Probe Technique for Plasma Parameter Measurement in a Medium Density Discharge,” Review of Scientific Instruments, Vol. 57, No. 9, 1986, pp. 2210-2217. doi:10.1063/1.1138684
- B. M. Annaratone, M. W. Allen and J. E. Allen, “Ion Currents to Cylindrical Langmuir Probes in RF Plasmas,” Journal of Physics D: Applied Physics, Vol. 25, No. 3, 1992, pp. 417-424. doi:10.1088/0022-3727/25/3/012
- I. D. Sudit and R. C. Woods, “Study of the Accuracy of Various Langmuir Probe Theories,” Journal of Applied Physics, Vol. 76, No. 8, 1994, pp. 4488-4498. doi:10.1063/1.357280