Applied Mathematics
Vol.5 No.11(2014), Article
ID:47065,8
pages
DOI:10.4236/am.2014.511163
Sub-Grouping Healthy Subjects’ Sensitivity to Pain and Its Relationship to Personality Traits: Results of a Cluster Analysis
Dorit Pud1*, Roi Treister2, Elon Eisenberg3,4
1Faculty of Social Welfare and Health Sciences, University of Haifa, Haifa, Israel
2Department of Neurology, Massachusetts General Hospital, Harvard Medical School, Boston, USA
3The Rappaport Faculty of Medicine, Technion-Israel Institute of Technology, Haifa, Israel
4Institute of Pain Medicine, Rambam Health Care Campus, Haifa, Israel
Email: *doritpud@research.haifa.ac.il
Copyright © 2014 by authors and Scientific Research Publishing Inc.
This work is licensed under the Creative Commons Attribution International License (CC BY).
http://creativecommons.org/licenses/by/4.0/


Received 22 February 2014; revised 5 April 2014; accepted 13 April 2014
ABSTRACT
Objective: Individual differences in the sensitivity to pain and the factors that may contribute to these differences are well studied. Nevertheless, there is no single test that can reliably classify subjects as being sensitive or insensitive to pain. Methods: In the present study, hierarchical clustering and K-means cluster analysis was used to identify subgroups among 191 healthy subjects (105 females, 86 males) according to their sensitivity to pain. Group determination was based on the subjects’ response to experimental noxious stimuli of heat (pain intensity), cold (cold pain threshold, tolerance, and intensity), and conditioned pain modulation (CPM, tested by co-administering repeated short painful heat stimuli and a conditioning tonic cold pain stimulation). In addition, in order to determine if the subjects in these subgroups differed on personality traits scores on Cloninger’s Tridimensional Personality Questionnaire (TPQ, outcome measure) for the three dimensions of personality: Novelty Seeking (NS); Harm Avoidance (HA); and Reward Dependence (RD) were calculated. Results: Based on pain scores, subjects were grouped as low pain (57%) with a low level of sensitivity in pain parameters, or high pain (43%) cluster members. The high pain had significant higher scores of HA (p = 0.05) and RD (p = 0.05) than the low pain group. Conclusions: This method of sub-grouping may be useful for identifying the mechanisms underlying individual variability in the sensitivity to pain and may point to groups at risk for experiencing high levels of clinical pain.
Keywords:Cluster Analysis, Cold Pressor Test, Experimental Pain, Human, Personality Traits

1. Introduction
It is widely agreed that pain is uniquely experienced by each person. According to the biopsychosocial approach, the experience of pain consists of complex and dynamic interactions between the biological, socio-cultural, and psychological domains [1] . Each of these domains consists of several factors that can contribute to the entire experience of pain, including gender [2] , ethnicity [3] , age [4] , tendency for catastrophizing and anxiety [5] , personality traits [6] and genetic factors [7] -[9] .
Conducting experimental pain tests on healthy volunteers is a common way of demonstrating inter-individual differences in the sensitivity to pain. However, the studies employing these methods have yielded inconsistent results due to their use of different experimental pain modalities, diverse pain measurements, and varying experimental settings [10] . Hence, these methodological variations preclude the generalization of conclusions from one study to another and create the need for a multi-dimensional approach to determining a typical constellation of pain phenotype.
One way of overcoming this problem is the use of cluster analysis, which is a statistical method of subgrouping subjects based on their similarities in a number of characteristics within each subgroup, while identifying the dissimilarities in the same characteristics between the subgroups. The use of cluster analysis has become common in multiple medical fields. One example is the successful subgrouping of cancer patients into clusters (i.e., mild, moderate, severe, etc.) based on the severity of their multiple symptoms. By creating these clusters, additional significant differences between the subgroups, such as quality of life and level of functioning, can be demonstrated [11] -[14] . Another use of cluster analysis is for the identification of subgroups of patients with neuropathic pain according to characteristic symptom constellation. For example, Baron and his colleagues [15] revealed five distinct clusters (subgroups) of patients with various combinations of sensory symptoms and distinct symptom profiles. Scholz and his colleagues [16] identified six subgroups of patients with neuropathic pain and two subgroups of patients with non-neuropathic pain, based on the patterns of symptoms and signs revealed by their interviews and physical examinations.
To the best of our knowledge, only one attempt has been made using cluster analysis to subgroup healthy subjects according to their sensitivity to multiple modalities of pain [17] . Subgrouping these subjects into distinct profiles has not yet proven to be successful. In the present study, cluster analysis was used to identify subgroups of healthy subjects with different levels of sensitivity to pain, based on their response to experimental noxious heat and cold stimuli. Moreover, there was an attempt to determine if the subjects in these subgroups differed in their Cloninger’s three dimensions of personality scores [18] (i.e., outcome measure). Given the complexity of the pain experience and the associations found with personality traits in previous research [6] we deemed it worthwhile to further explore this issue in an attempt to strengthen earlier findings.
2. Methods
2.1. Subjects
Participants were 191 healthy paid students, including 105 females and 86 males, ranging in age from 18 to 39 (mean age ± SEM 24.5 ± 0.25). Subjects were enrolled in the study after meeting the following inclusion criteria: 1) healthy and free from chronic pain of any type; 2) no medication use (except for oral contraceptives); 3) able to understand the purpose and instructions of the study. Subjects who were suffering from any medical or painful condition, using medications or pregnant were excluded from the study. The study was approved by the local ethics committee.
2.2. Instruments and Tests
2.2.1. Noxious Cold Perception
The cold pressor test (CPT) apparatus (Heto CBN 8-30 Lab equipment, Allerod, Denmark) is a temperaturecontrolled water bath with a maximum temperature variance of ±0.5˚C, which is continuously stirred by a pump. Subjects were asked to place their right hand in the CPT (1˚C) in a still position with their fingers spread wide apart. A stopwatch was simultaneously activated, and the subjects were requested to maintain their hand in the cold water for as long as they could. A cut-off time of 180 seconds was set for safety reasons. Subjects were instructed to indicate the exact point in time when the cold sensation began to elicit pain. The time until the first perception of pain, measured in seconds (s), was defined as the threshold of cold pain. Immediately after hand withdrawal, the subjects were asked to mark their maximal pain intensity on a 0 - 100 visual analogue scale (VAS), where 0 represents “no pain” and 100 represents the “worst pain one can imagine.” The latency of intolerability (spontaneous hand removal), as measured in seconds (s), was defined as the level of pain tolerance. The tolerance for subjects who did not withdraw their hand for the entire 180 s was recorded as 180 s.
2.2.2. Noxious Heat Perception
A thermal testing analyzer (TSA) thermode of 30 × 30 mm (Medoc TSA-2001 device, Ramat Ishai, Israel) was attached to the skin of the left hand above the thenar eminence. A phasic heat pain stimulation of 47˚C for three seconds was delivered, starting from 37˚C and increasing at the rate of 1˚C/sec. The subjects were asked to mark their maximal heat pain intensity on a VAS (0 - 100).
2.2.3. Conditioned Pain Modulation (CPM)
In order to induce CPM, the heat stimulation was considered as the “test stimulation”, whereas the noxious cold stimulation was used as a “conditioning” stimulation. After the first heat stimulus provided the baseline heat pain rating, subjects were asked to immerse their right hand into the CPT at 12˚C. Following 15 seconds of immersion and again at 30 seconds, while the hand was still in the CPT, the second and third heat pain stimuli were delivered and pain intensities were recorded (test 1 and test 2, respectively). Subjects were then asked to remove their hand from the CPT. Two additional heat stimulations were administered 15 and 30 seconds subsequent to removal of the hand from the CPT, and pain intensities were again recorded (test 3 and test 4, respectively). A numerical pain scale (NPS, 0 - 100), was used by subjects to rapidly rate the pain intensities experienced during each heat stimulus. The NPS was used verbally since both hands were occupied by the two different devices (TSA and CPT). Since the maximal CPM was expressed after 30 seconds of hand immersion in the CPT (test 2), all CPM related analyses were based on the reduction of pain scores obtained in test 2 from the baseline pain scores.
2.2.4. Outcome Measure—The Tridimensional Personality Questionnaire (TPQ)
Cloninger’s Tridimensional Personality Questionnaire (TPQ) is a 100-item true/false self-report inventory [19] . It is based on the hypothesis that neurotransmitters determine stimulus-response characteristics. Accordingly, three sets of behavioral manifestations and their corresponding neurotransmitters are hypothesized: 1) Novelty Seeking (NS), which is described as a tendency to respond with intense excitement to novel stimuli, is associated with dopamine; 2) Harm Avoidance (HA), which is defined as a tendency to respond intensely to previously established signals of aversive stimuli and to passively avoid novelty, is associated with serotonin; and 3) Reward Dependence (RD), which is characterized as a tendency to respond intensely to signals of reward and to maintain behavior previously associated with reward or relief of punishment, is associated with noradrenaline. The total score for each dimension is calculated. Test-retest correlations are found to be moderately high [20] . The questionnaire has been translated into several languages and used in a variety of studies.
2.3. Study Design
Subjects were recruited through advertisements posted on notice boards at local universities. Responders received a full explanation about the purpose and design of the study. Potential participants who met the inclusion criteria were asked to sign a written informed consent and were enrolled in the study. After completing the Hebrew version of the TPQ, subjects were administered the pain tests. All tests were conducted during the morning hours in random order, with an interval of at least 10 min between the tests (CPT, TSA, CPM). A training session was provided 10 min prior to the beginning of the experiment in order to familiarize the subjects with the pain tests.
2.4. Statistical Analyses
All analyses were conducted using the SPSS for Windows Version 19 statistical package (SPSS, Inc., Chicago, IL). Descriptive statistics and frequency distributions were generated for the sample characteristics. Hierarchical cluster analyses were done to identify subgroups of subjects based on their responses to the five pain tests (i.e., heat pain intensity, cold pain threshold, tolerance, and intensity, CPM). Prior to cluster analysis, scores were standardized using Z-scores to adjust for the value ranges of the different scales in order to “equalize” the scales of all parameters [21] .
Determination of the “stopping rule” for the number of clusters was conducted using a two-stage process: hierarchical clustering to identify large inconsistent increase of coefficients in the agglomeration schedule and dendrogram; and K-means cluster analysis to confirm and optimize results [21] [22] .
The cluster analyses yielded two clusters were obtained for the data. Independent Sample two tailed t-test was employed to test differences in pain scores between the two subgroups. Multiple Analyses of Variance (MANOVA) were used to determine if there were significant differences between the two clusters-derived subgroups based on the scores of the TPQ. Results were considered significant at the 0.05 levels. All results are given as mean ± SEM.
3. Results
Table 1 depicts the descriptive values of the eight examined parameters (five pain tests and three personality traits) for the entire sample (n = 191).
Based on the classifications of the two-cluster solution, 57% of the sample (n = 109; 50 F and 59 M) was categorized as a “low pain” subgroup and 43% (n = 82; 55 F and 27 M) as a “high pain” subgroup.
Table 2 shows the differences between the two clusters in the pain scores. As can be seen, subjects in the low pain subgroup reported a significantly lower heat pain intensity (p < 0.001), a higher cold pain threshold (p = 0.010), a longer cold pain tolerance (p < 0.001); a lower cold pain intensity (p < 0.001); and lower magnitude of CPM (p < 0.001) than the high pain subgroup. The standardized scores (Z) of all parameters for the two subgroups are shown in Figure 1.
Differences in subjects outcomes-Significant differences between the two groups were found in regard to the TPQ (MANOVA, F = 2.933, p = 0.035). Specifically, HA scores were significantly lower (p = 0.05) at the “low

Table 1. Descriptive values of the examined parameters for the entire sample (n = 191).
CPM: conditioned pain modulation (negative values represent pain increase); NS: novelty seeking; HA: harm avoidance; RD: reward dependence.
Table 2. Differences in pain responses between the two subgroups.
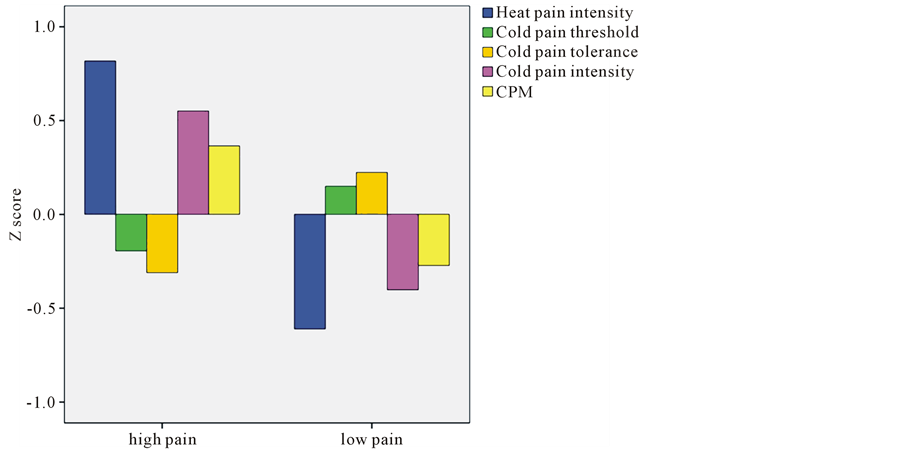
Figure 1. Standardized scores (Z scores) of pain for the two subgroups.
pain” subgroup than at the “high pain” subgroup (11.6 ± 0.6 vs. 13.5 ± 0.8, respectively); RD scores were significantly lower (p = 0.05) at the “low pain” subgroup than at the “high pain” subgroup (18.9 ± 0.5 vs. 20.2 ± 0.5, respectively); no significant difference in NS scores was found (Table 3).
4. Discussion
By using a cluster analysis to combine sensitivity to multiple modalities of experimental pain parameters, we have been able to identify two distinct subgroups of subjects. The “low pain group” (57% of the sample) reported low levels in response to all five pain stimuli, indicating low degree of sensitivity to pain and the “high pain group” (43% of all subjects) reported high levels in response to all five pain stimuli, indicating high degree of sensitivity to pain. In addition, the high pain had significant higher scores of HA and RD than the low pain group.
While cluster analysis can be a valuable strategy for identifying lowand high-risk groups of patients with pain who warrant different pain management interventions, only limited studies have used it in this regard thus far. Bruehl and his colleagues [23] used a cluster analysis and identified three distinct subtypes of patients with complex regional pain syndrome based on similarity of signs and symptoms. Hurtig and her colleagues [24] categorized two subgroups of fibromyalgia patients based on their heat and cold thermal pain thresholds. Also working with fibromyalgia patients, Giesecke and his colleagues [25] determined their subgroups based on pressure-pain sensitivity, mood (evaluated by depression and state-trait anxiety levels), and cognition (assessed by the level of catastrophizing and coping strategies). In contrast, only one study used cluster analysis with healthy volunteers to identify distinct subgroups of sensitivity to pain based on the response to multiple (thermal, mechanical, and ischemic) experimental pain modalities. The results revealed one group of “overall pain sensitive” subjects, but failed to demonstrate any other subgroups that were consistently “mildly” or “moderately” sensitive to all of the pain modalities. The authors noted that their findings highlight the need for further investigation in order to identify patterns of responses across different pain modalities and thereby characterize individual differences in response to experimental pain [17] .
There are further findings in the present study that deserve consideration. First, the mean cold pain tolerance of the total sample in the present study was almost 40 seconds, with a large interpersonal variability (~37 SD). Approximately 20% of the subjects were able to tolerate the cold water for more than 50 seconds. This finding is in line with prior reports on tolerance ratios in healthy subjects [26] [27] . When dividing the sample into clusters, the low pain subgroup exhibited a longer cold pain tolerance than the high pain subgroup, with a significantly and exceptionally longer time for hand withdrawal from the cold water. The fact that the low pain cluster was based on four additional pain parameters, suggests that tolerance is an integral part of this pattern. Thus, these
Table 3. Differences in personality trait scores between the two subgroups.
findings highlight the relevance of pain tolerance as a measure of responsiveness to pain, rather than just as a psychological factor. The findings also emphasize the importance of clustering several parameters into subgroups, as individual parameters sometimes overlap and cannot distinguish between those subgroups.
Another notable point refers to the fact that the magnitude of CPM was also differed between the groups. CPM paradigms are often used to assess the diffuse noxious inhibitory control (DNIC) system [28] [29] . The results of the present study indicate that the high pain cluster includes individual with high magnitude of CPM and vice versa. One explanation to this finding is the fact that significant difference in the initial heat pain test was found between the two groups. Specifically, the high pain group had significant higher baseline heat test pain scores than the low pain group. This finding is in the same line of our previous report indicating that one of the main factors affecting the magnitude of CPM is the intensity of baseline pain test perceived, such that higher initial pain levels were significantly correlated with high magnitudes CPM and was the strongest predictor for its magnitude [30] . To the best of our knowledge, literature search did not raise any other study that examined the relations between sensitivity to experimental pain in healthy subjects and the magnitude of CPM. Therefore, further studies are warranted to support this finding. According to the current results, it is suggested that both static and dynamic QST have the potential to become useful in subgrouping individuals’ sensitivity to pain.
An additional finding relates to our outcome measure, personality traits. Although it is widely recognized that pain is influenced by personality [31] in [32] , different studies employing a variety of personality tools have yielded conflicting results. During the last decade, several studies have applied Cloninger’s theory to the area of pain perception in healthy subjects as well as to various clinical pain conditions. We have previously demonstrated that a high HA level was the major trait determining heightened cold pain perception in healthy volunteers [6] . Even more so, in that previous study we also found that individuals with a high score of HA in combination with a low score of RD appear to be the most sensitive to pain, whereas those with a low score of HA and a low score of RD appear to be the least sensitive to pain. This finding led us to claim that the principal factor that seems to determine pain perception is the scoring of HA. In the clinical setting, one study showed that chronic pain patients scored higher on HA than did pain-free controls [33] . Glazer and his colleagues [34] also showed that patients with fibromyalgia and their relatives had higher HA scores than the controls. Along the same line, another study showed that cutaneous allodynia was associated with HA, depression, and anxiety in migraine patients [35] . Granot [36] found that higher scores of HA and RD were associated with enhanced heat pain ratings and had an impact on pain perception in healthy subjects as well as in women with vulvar vestibulitis syndrome. All these findings indicate that HA scores seem to predict sensitivity to pain. According to Cloninger’s theory, HA individuals tend to be fearful and anticipate harm even under supportive circumstances [18] [19] . Furthermore, HA is viewed as a personality dimension that predisposes one to fear-avoidance behavior [33] and consequently worsens the pain problem [37] . As for the RD, according to Cloninger’s theory high RD scores represent individuals who respond intensely to signals of reward, sensitive to social cues, tend to share their feelings and motivated to please others [19] . It may be that since RD includes components of social cues and pleasing others, it is hard to draw conclusions from this trait into pain behavior and pain sensitivity.
Our previous research [6] and the current study demonstrate associations between sensitivity to pain and personality traits in two different prisms which make the findings hard to compare, even if some of them go in the same line (e.g., high pain relates to high scores of HA). More specifically, while at the former study the subgroups were based on combined mean of HA and RD scores and the analyses were performed separately for each pain parameter, at the present study the subgroups were based on clusters each composited by five different pain parameters and the analyses were based on correlations with each trait.
The second noteworthy point is on pain tolerance, which refers to the maximal time that a subject can endure the noxious stimulation [10] . There are numerous QST studies that assess tolerance in relation to one of the variables evaluating pain perception. However, some authors tend to criticize this parameter and argue that tolerance is influenced by motivation and psychosocial factors to a greater extent than direct scaling [38] . Moreover, it has been suggested that tolerance is not an equivalent measure of responsiveness to pain [26] . These claims relegate tolerance to the level of a questionable variable in the assessment of sensitivity to pain.
5. Conclusion
In conclusion, the present study identified clusters of healthy subjects based on their pain response and demonstrated their relationship with personality traits. This method of phenotyping pain responsiveness may be valuable in the selection of subjects for experimental and clinical trials. Furthermore, it may be useful for identifying the mechanisms underlying individual variability in the sensitivity to pain and may point to groups at risk for experiencing high levels of clinical pain. As such, this method of subgrouping may contribute to predicting clinical outcomes and to individualizing pain treatment regimens [10] . Notably, these findings warrant replication in future studies with patients who have a variety of other painful conditions before clinical relevance can be definitively determined.
References
- Fillingim, R.B. (2005) Individual Differences in Pain Responses. Current Rheumatology Reports, 7, 342-347. http://dx.doi.org/10.1007/s11926-005-0018-7
- Fillingim, R.B., King, C.D., Ribeiro-Dasilva, M.C., et al. (2009) Sex, Gender, and Pain: A Review of Recent Clinical and Experimental Findings. The Journal of Pain, 10, 447-485. http://dx.doi.org/10.1016/j.jpain.2008.12.001
- Edwards, C.L., Fillingim, R.B. and Keefe, F. (2001) Race, Ethnicity and Pain. Pain, 94, 133-137. http://dx.doi.org/10.1016/S0304-3959(01)00408-0
- Gibson, S.J. and Helme, R.D. (2001) Age-Related Differences in Pain Perception and Report. Clinics in Geriatric Medicine, 17, 433. http://dx.doi.org/10.1016/S0749-0690(05)70079-3
- Sullivan, M.J., Thorn, B., Haythornthwaite, J.A., et al. (2001) Theoretical Perspectives on the Relation between Catastrophizing and Pain. Clinical Journal of Pain, 17, 52-64. http://dx.doi.org/10.1097/00002508-200103000-00008
- Pud, D., Eisenberg, E., Sprecher, E., et al. (2004) The Tridimensional Personality Theory and Pain: Harm Avoidance and Reward Dependence Traits Correlate with Pain Perception in Healthy Volunteers. European Journal of Pain, 8, 31-38. http://dx.doi.org/10.1016/S1090-3801(03)00065-X
- Mogil, J.S., Wilson, S.G., Bon, K., et al. (1999) Heritability of Nociception II. Types’ of Nociception Revealed by Genetic Correlation Analysis. Pain, 80, 83-93. http://dx.doi.org/10.1016/S0304-3959(98)00196-1
- L?tsch, J. and Geisslinger, G. (2007) Current Evidence for a Modulation of Nociception by Human Genetic Polymorphisms. Pain, 132, 18-22. http://dx.doi.org/10.1016/j.pain.2007.06.024�
- Nielsen, C.S., Stubhaug, A., Price, D.D., et al. (2008) Individual Differences in Pain Sensitivity: Genetic and Environmental Contributions. Pain, 136, 21-29. http://dx.doi.org/10.1016/j.pain.2007.06.008
- Nielsen, C.S., Staud, R. and Price, D.D. (2009) Individual Differences in Pain Sensitivity: Measurement, Causation, and Consequences. The Journal of Pain, 10, 231-237. http://dx.doi.org/10.1016/j.jpain.2008.09.010
- Dodd, M.J., Miaskowski, C. and Paul, S.M. (2001) Symptom Clusters and Their Effect on the Functional Status of Patients with Cancer. Oncology Nursing Forum, 28, 465.
- Miaskowski, C., Cooper, B.A., Paul, S.M., et al. (2006) Subgroups of Patients with Cancer with Different Symptom Experiences and Quality-of-Life Outcomes: A Cluster Analysis. Oncology Nursing Society, 33, E79-E89.
- Barsevick, A.M. (2007) The Elusive Concept of the Symptom Cluster. Oncology Nursing Society, 34, 971-980.
- Pud, D., Ben Ami, S., Cooper, B.A., et al. (2008) The Symptom Experience of Oncology Outpatients Has a Different Impact on Quality-of-Life Outcomes. Journal of Pain and Symptom Management, 35, 162-170. http://dx.doi.org/10.1016/j.jpainsymman.2007.03.010
- Baron, R., T?lle, T.R., Gockel, U., et al. (2009) A Cross-Sectional Cohort Survey in 2100 Patients with Painful Diabetic Neuropathy and Postherpetic Neuralgia: Differences in Demographic Data and Sensory Symptoms. Pain, 146, 34-40. http://dx.doi.org/10.1016/j.pain.2009.06.001�
- Scholz, J., Mannion, R.J., Hord, D.E., Griffin, R.S., Rawal, B., et al. (2009) A Novel Tool for the Assessment of Pain: Validation in Low Back Pain. PLoS Medicine, 6, Article ID: e1000047. http://dx.doi.org/10.1371/journal.pmed.1000047
- Hastie, B.A., Riley III, J., Robinson, M.E., Glover, T., Campbell, C.M., et al. (2005) Cluster Analysis of Multiple Experimental Pain Modalities. Pain, 116, 227-237. http://dx.doi.org/10.1016/j.pain.2005.04.016
- Cloninger, C.R. (1986) A Unified Biosocial Theory of Personality and Its Role in the Development of Anxiety States. Psychiatric Developments, 4, 167-226.
- Cloninger, C.R. (1987) A Systematic Method for Clinical Description and Classification of Personality Variants: A Proposal. Archives of General Psychiatry, 44, 573-588. http://dx.doi.org/10.1001/archpsyc.1987.01800180093014
- Cloninger, C.R., Thomas, R.P. and Dragan, M.S. (1991) The Tridimensional Personality Questionnaire: US Normative Data. Psychological Reports, 69, 1047-1057. http://dx.doi.org/10.2466/pr0.1991.69.3.1047
- Milligan, G.W. and Cooper M.C. (1985) An Examination of Procedures for Determining the Number of Clusters in a Data Set. Psychometrika, 50, 159-179. http://dx.doi.org/10.1007/BF02294245
- McQuitty, L.L. (1966) Similarity Analysis by Reciprocal Pairs for Discrete and Continuous Data. Educational and Psychological Measurement, 26, 825-831. http://dx.doi.org/10.1177/001316446602600402
- Bruehl, S., Harden, R.N., Galer, B.S., Saltz, S., Backonja, M. and Stanton-Hicks, M. (2002) Complex Regional Pain Syndrome: Are There Distinct Subtypes and Sequential Stages of the Syndrome? Pain, 95, 119-124. http://dx.doi.org/10.1016/S0304-3959(01)00387-6
- Hurtig, I.M., Raak, R.I., Kendall, S.A., Bj?rn, G. and Karin, W.L. (2001) Quantitative Sensory Testing in Fibromyalgia Patients and in Healthy Subjects: Identification of Subgroups. Clinical Journal of Pain, 17, 316-322. http://dx.doi.org/10.1097/00002508-200112000-00005�
- Giesecke, T., Williams, D.A., Harris, R.E., Cupps, T.R., Tian, X., et al. (2003) Subgrouping of Fibromyalgia Patients on the Basis of Pressure-Pain Thresholds and Psychological Factors. Arthritis & Rheumatism, 48, 2916-2922. http://dx.doi.org/10.1002/art.11272
- Harris, G. and Rollman, G.B. (1983) The Validity of Experimental Pain Measures. Pain, 17, 369-376. http://dx.doi.org/10.1016/0304-3959(83)90168-9
- Cleeland, C.S., Nakamura, Y., Howland, E.W., Morgan, N.R., Edwards, K.R. and Backonja, M. (1996) Effects of Oral Morphine on Cold Pressor Tolerance Time and Neuropsychological Performance. Neuropsychopharmacology, 15, 252-262. http://dx.doi.org/10.1016/0893-133X(95)00205-R
- Arendt-Nielsen, L. and Yarnitsky, D. (2009) Experimental and Clinical Applications of Quantitative Sensory Testing Applied to Skin, Muscles and Viscera. The Journal of Pain, 10, 556-572. http://dx.doi.org/10.1016/j.jpain.2009.02.002
- Pud, D., Granovsky, Y., Yarnitsky, D. (2009) The Methodology of Experimentally Induced Diffuse Noxious Inhibitory Control (DNIC)-Like Effect in Humans. Pain, 144, 16-19. http://dx.doi.org/10.1016/j.pain.2009.02.015
- Treister, R., Eisenberg, E., Gershon, E., Haddad, M. and Pud, D. (2010) Factors Affecting–And Relationships between—Different Modes of Endogenous Pain Modulation in Healthy Volunteers. European Journal of Pain, 14, 608- 614. http://dx.doi.org/10.1016/j.ejpain.2009.10.005
- Phillips, J.M. and Gatchel, R.J. (2000) Extraversion—Introversion and Chronic Pain.
- Gatchel, R.J. and Weisberg, J.N. (2000) Personality Characteristics of Patients with Pain. American Psychological Association. http://dx.doi.org/10.1037/10376-000
- Conrad, R., Schilling, G., Bausch, C., Nadstawek, J., Wartenberg, H.C., et al. (2007) Temperament and Character Personality Profiles and Personality Disorders in Chronic Pain Patients. Pain, 133, 197-209. http://dx.doi.org/10.1016/j.pain.2007.07.024
- Glazer, Y., Buskila, D., Cohen, H., Ebstein, R.P. and Neumann, L. (2010) Differences in the Personality Profile of Fibromyalgia Patients and Their Relatives with and without Fibromyalgia. Clinical and Experimental Rheumatology, 28, S27-S32.
- d’Agostino, V., Francia, E., Licursi, V. and Cerbo, R. (2010) Clinical and Personality Features of Allodynic Migraine. Neurological Sciences, 31, 159-161. http://dx.doi.org/10.1007/s10072-010-0316-3
- Granot, M. (2005) Personality Traits Associated with Perception of Noxious Stimuli in Women with Vulvar Vestibulitis Syndrome. The Journal of Pain, 6, 168-173. http://dx.doi.org/10.1016/j.jpain.2004.11.010
- Vlaeyen, J.W. and Linton, S.J. (2006) Are We “Fear-Avoidant”? Pain, 124, 240-241. http://dx.doi.org/10.1016/j.pain.2006.06.031
- Feldner, M.T. and Hekmat, H. (2001) Perceived Control over Anxiety-Related Events as a Predictor of Pain Behaviors in a Cold Pressor Task. Journal of Behavior Therapy and Experimental Psychiatry, 32, 191-202. http://dx.doi.org/10.1016/S0005-7916(01)00034-9
NOTES

*Corresponding author.