Applied Mathematics
Vol.5 No.2(2014), Article ID:42169,7 pages DOI:10.4236/am.2014.52029
Manpower Systems Operating under Heavy and Light Tailed Inter-Exit Time Distributions
1Statistics Department, University of Botswana, Gaborone, Botswana
2Department of Statistics, Pondicherry University, Puducherry, India
Email: ramasamysr@mopipi.ub.bw, drtrpadi@gmail.com, thagak@mopipi.ub.bw
Received July 22, 2013; revised August 22, 2013; accepted August 29, 2013
ABSTRACT
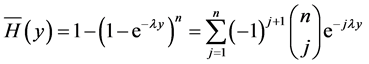
This paper considers a Manpower system where “exits” of employed personnel produce some wastage or loss. This system monitors these wastages over the sequence of exit epochs {t0 = 0 and tk; k = 1, 2,∙∙∙} that form a recurrent process and admit recruitment when the cumulative loss of man hours crosses a threshold level Y, which is also called the breakdown level. It is assumed that the inter-exit times Tk = tk−1 − tk, k = 1, 2,∙∙∙ are independent and identically distributed random variables with a common cumulative distribution function (CDF) B(t) = P(Tk < t) which has a tail 1 – B(t) behaving like t−v with 1 < v wang#Bracket## 2 as t → ∞. The amounts {Xk} of wastages incurred during these inter-exit times {Tk} are independent and identically distributed random variables with CDF P(Xk < X) = G(x) and Y is distributed, independently of {Xk} and {tk}, as an exponentiated exponential law with CDF H(y) = P(Y < y) = (1 − e−λy)n. The mean waiting time to break down of the system has been obtained assuming B(t) to be heavy tailed and as well as light tailed. For the exponential case of G(x), a comparative study has also been made between heavy tailed mean waiting time to break down and light tailed mean waiting time to break down values. The recruitment policy operating under the heavy tailed case is shown to be more economical in all types of manpower systems.
Keywords:Manpower System; Recruitment Policy; Inter-Exit Time; Wastage; Waiting Time to Breakdown; Heavy Tailed Inter-Exit Time Distribution and Light Tailed Distribution
1. Introduction
According to [1-3], the cumulative losses occurring over a period of time in any human resource organization can be minimized through a “Recruitment Policy”. This paper considers a manpower system which monitors exit times of personnel who are the employees of the organization, the wastage incurred over a period of time and the cost of recruiting new people.
In [4], shock models pertaining to cumulative wastage, threshold level and their link with the breakdown status of devices have been surveyed. For more details on recruitment policies employed by various manpower organizations, the readers refer to [5-8].
This paper is organized as follows: Section 2 describes various features of a manpower system. Section 3 deals with survival aspects of the manpower system under study. Section 4 provides numerical illustrations which support the main results obtained in Section 3. Section 5 is devoted to providing some remarks and the future scope.
2. Description of the Manpower System
Assume that the organization under study monitors the sequence  of exit times (called renewal epochs or decision epochs) over a period of time
  where t is some positive and finite real value subject to the following features:
• The time durations  of inter-exit/inter-renewal epochs are independent and identically distributed (iid) random variables with a common cumulative distribution function (CDF)
  and probability density function (pdf)
 .
.
• Let the amount of wastage observed during![]() , be denoted by
, be denoted by  such that the process
  forms a sequence of iid random variables with CDF
  and pdf
 .
.
• At each exit epoch , a decision is also made based on the cumulative damage or wastage incurred as compared with a threshold level, say Y, to the occurrence of break down state of the manpower system. Independent of
  and
and  sequences and other features, Y is assumed to vary continuously with CDF
  and pdf
  while the tail is
• The event of Breakdown state of the manpower system is assumed to occur at an exit epoch, say , provided the observed cumulative damage
  exceeds the random threshold level Y. It means that a few personnel must be recruited at this epoch
  to avoid the immediate breakdown status.
3. Distribution of Waiting Time till Breakdown
For any CDF  or the probability density function (PDF)
  of a non-negative random variable (rv) say X, use the notation
  for the
  convolution of F with itself and
 , for the tail of
  and the tail of the distribution of sum of k independent random variables by
 ,
,  the k-fold convolutions and
 (1)
(1)
where ![]() means the real part of s.
means the real part of s.
Gupta and Kundu have discussed various applications of generalized exponential distributions inclusive of an “Exponentiated Exponential Distribution (EED)” [9,10]. Here, the random threshold level Y is assumed to follow the EED with CDF :
:
 (2)
(2)
 (3)
(3)
Let “τ” denote the waiting time to breakdown state of the system under study and let continuous function  be the CDF of
![]() . Then, the distribution tail of τ is
. Then, the distribution tail of τ is
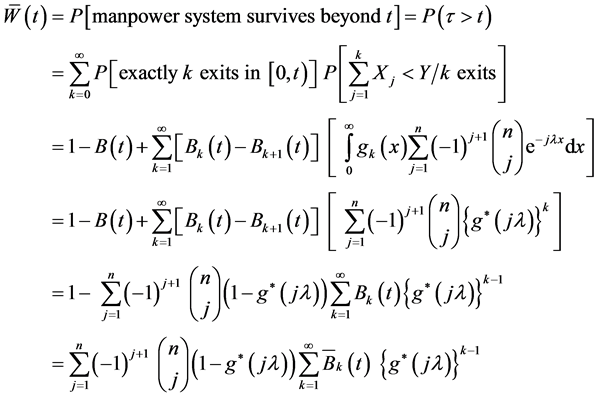 (4)
(4)
Where .
.
3.1. Heavy Tailed Distribution B(t)
Following is some useful notation and terminology on “Heavy” tailed distributions that are usually characterized by extremely high variability as against with light tailed distributions. The term “heavy tailed distribution of a non-negative rv ‘X’” refers to absence of all moments after the  moment of X for some
 .
.
Definition: The CDF  of X on
  is called heavy tailed if and only if (iff)

And the same  is called light tailed iff

For any two real valued and positive functions  and
and  defined on
 , use the notational convention
  to denote
 .
.
Definition: If there exists some  such that
  for all
  then
then  is said to be regularly varying at infinity with index
 ; if
; if ,
,  is said to be slowly varying at infinity. If
  is regularly varying at infinity with index
  then there exists a slowly varying function
  such that

Thus the properties of regularly varying functions  can be deduced from those slowly varying functions
  which will not be unique. One of the wider classes of heavy tailed distributions is called subexponential family of distributions, denoted by the symbol “
 ”.
”.
Definition: A CDF  on
on  is called regularly varying with index ν if

Where  is a function of slow variation. All moments of order
  are finite and all moments of order
  are infinite; further if
  for all
  and if
  then 1)
 uniformly over compact y-sets and 2)
 (5)
(5)
3.2. Heavy Tailed Mean of Waiting Time to Breakdown Distribution
This section is devoted to derive an asymptotic expression to (4) of the rv  = waiting time to breakdown for which the inter-exit time T follows a heavy-tailed distribution with index ν
 i.e.
i.e.
 (6)
(6)
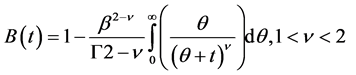
Where c and θ are positive constants. Obviously  is finite and
  if
if![]() . The readers may refer to [11-13] and the references found there in for finding asymptotic waiting time distributions where the heavy tailed distribution (6) has been considered as the service time distribution.
. The readers may refer to [11-13] and the references found there in for finding asymptotic waiting time distributions where the heavy tailed distribution (6) has been considered as the service time distribution.
It is observed that (6) is satisfied by the non-negative rv “![]() ” with the Pareto distribution: for
” with the Pareto distribution: for![]() ,
,
 (7)
(7)
where δ is real with ![]() and θ is a rv with Gamma PDF m(θ):
and θ is a rv with Gamma PDF m(θ):
 (8)
(8)
Using (7) and (8), it can be shown that 
is simplified to
 (9a)
(9a)
 (9b)
(9b)
Using (5), (6) and (12) in (4), it is proved that W(t) follows a heavy tailed distribution since
 (10)
(10)
From (10), using the facts ,
,  and (9), it can be shown that
 (11)
(11)

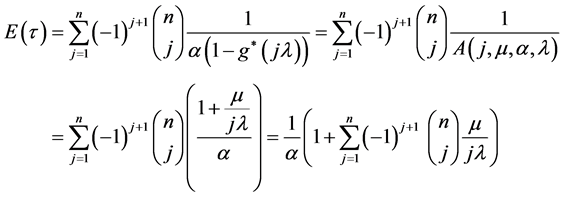
Let the common random amount of damage X measured during an inter-exit time be exponentially distributed with PDF  for the rest of the discussions. The LT of
  is then
 . Thus it is simplified from (11) that the mean of
  is as derived below:
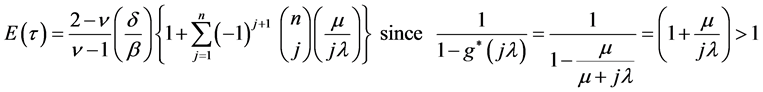 (12)
(12)
and

When , it is interesting to observe from (12) that
 (13)
(13)
3.3. Light Tailed Exponential Distribution to Inter-Exit Times
For the case of exponential inter-exit time T with PDF  or
or , together with
 , the PDF
  of
of  from (4) is derived as below:
 (14)
(14)
where
 .
.
It is remarked that the expression obtained in (14) to the PDF of the rv, τ = waiting time to breakdown of the manpower system is a linear and convex combination of “n” non-identically and exponentially distributed random variables and  of
of  is given by
 (15)
(15)
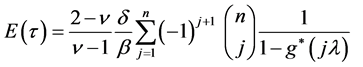
and this result (15) agrees with that of [5]. Thus the expected value  is obtained from (14) or (15) as below:
Let . Then comparing the result (16) on
  derived from the light tailed exponential distribution
  assigned to the inter-exit times with mean =
 ![]() with that of the result (12)
with that of the result (12)
on the same  derived from the heavy tailed inter-exit time distribution
  satisfying the property

It is concluded that
 and
and .
.
4. Better Recruitment Policy under Heavy and Light Tailed Cases
All these results relating to  obtained above have been considered for a numerical study with specific input values “ν = 1.2, β = 0.75, α =1.2,
 ![]() = 2.0, and µ = 0.8” allowing n to vary from 1 to 10 and the outcome of this exercise on the value of
= 2.0, and µ = 0.8” allowing n to vary from 1 to 10 and the outcome of this exercise on the value of  computed for both light tailed and heavy tailed distributions of B(t) has been reported in Table1
Inspection of the numerical values of the above Table 1 reveals that each value of δ lies between 0 and 1 and increases with increase in n values from 1 to 10 as expected. Further the mean waiting time till breakdown is longer with heavy tailed inter-exit times than with that of the lighter tailed inter-exit time periods and the variations among the mean values of the heavy tailed environment is much higher as compared with that of a lighter tailed exponential distribution.
5. Remarks and Scope
One of the primary tasks of an efficient hiring process of a manpower system is to create a suitable recruitment policy. It specifies the objectives of recruitment and provides a framework for the implementation of a recruit

Table 1. Input values for ν = 1.2, β = 0.75, α = 1.2, λ = 2.0, and µ = 0.8.
ment programme by filling up vacancies with best qualified people.
This paper obtains few results relating to expected waiting time to break down i.e.  of a human resource management system or manpower system. To support the theoretical results obtained, a numerical study with specific input values “ν = 1.2, β = 0.75, α = 1.2,
 ![]() = 2.0, and µ = 0.8” allowing n to vary from 1 to 10 has been carried out. Two values of
= 2.0, and µ = 0.8” allowing n to vary from 1 to 10 has been carried out. Two values of  are computed: 1) for light tailed inter-exit time distribution
  giving E(τlight) and 2) for a specific heavy tailed distribution
  giving E(τheavy). It is remarked that similar numerical investigation can also be carried out to other cases like the rv. Y follows exponentiated gamma law of [9,10] or the Weibull family of [14], or the inter-exit time follows any other light tailed and generalized exponential distribution and so on.
The numerical values of E(τheavy) are found to be larger with larger variations than that of E(τlight) values. This fact ensures that the cost of recruitment with the case of heavy tailed inter-exit times would be smaller than the cost associated with a lighter case of the inter-exit times of employed personnel. Thus it is more advantageous in terms of recruitment costs if more people whose inter-exit time distribution follows a heavy tailed distribution are recruited in all types of manpower systems.
There is much scope to extend the analysis of this paper to the cases of heavy tailed distribution for the amount of wastages i.e.  or for the threshold level
  or to both of
  and
and .
.
Acknowledgements
The first author gratefully acknowledges the authorities of the University of Botswana for granting research leave from June to July months, 2013, to do collaborative research work with the second author of this paper.
REFERENCES
- D. J. Bartholomew and A. F. Forbes, “Statistical Techniques for Manpower Planning,” Wiley, New York, 1979.
- J. D. Esary, A. W. Marshall and F. Proschan, “Shock Models and Wear Processes,” Annals of Probability, Vol. 1, No. 4, 1973, pp. 627-649. http://dx.doi.org/10.1214/aop/1176996891
- D. J. Bartholomew, “The Statistical Approach to Manpower Planning,” Statistician, Vol. 20, No. 1, 1971, pp. 3-26. http://dx.doi.org/10.2307/2987003
- J. S. Edwards, “A Survey of Manpower Planning Models and Their Application,” The Journal of the Operational Research Society, Vol. 34, No. 11, 1983, pp. 1031-1040.
- K. Thaga and R. Sivasamy, “Best Recruitment Policy (BRP) under a Random Threshold Level,” Recent Research in Science and Technology, Vol. 5, No. 5, 2013. http://recent-science.com/
- P. Pandian, K. Kannadasan and R. Vinoth, “An Effective Manpower Planning Approach in an Organization through Two Grade System,” International Journal of Research in Management, Vol. 2, No. 3, 2012, pp. 110-115.
- S. Parthasarathy and R. Vinoth, “Determination of Expected Time to Recruitment in Manpower Planning,” Recent Research in Science and Technology, Vol. 1, No. 3, 2009, pp. 147-150.
- D. Damodaran and G. Gopal, “A Parametric Empirical Bayesian Software Reliability Model,” International Journal of Performability Engineering, Vol. 5, No. 3, 2009, pp. 259-266.
- R. D. Gupta and D. Kundu, “Generalized Exponential Distributions,” Australian and New Zealand Journal of Statistics, Vol. 41, No. 2, 1999, pp. 173-188. http://dx.doi.org/10.1111/1467-842X.00072
- R. D. Gupta and D. Kundu, “Exponentiated Exponential Family: An Alternative to Gamma and Weibull,” Biometrical Journal, Vol. 43, No. 1, 2001, pp. 117-130. http://dx.doi.org/10.1002/1521-4036(200102)43:1<117::AID-BIMJ117>3.0.CO;2-R
- O. J. Boxma and J. W. Cohen, “Heavy-Traffic Analysis for the GI/G/1 Queue with Heavy-Tailed Distributions,” Queueing Systems, Vol. 33, No. 1, 1999, pp. 177-204. http://dx.doi.org/10.1023/A:1019124112386
- O. J. Boxma and J. W. Cohen, “The M/G/1 Queue with Heavy Tailed Service Time Distribution,” IEEE Journal on Selected Areas in Communications, Vol. 16, No. 5, 1998, pp. 749-763. http://dx.doi.org/10.1109/49.700910
- J. W. Cohen, “On the M/G/1 Queue with Heavy-Tailed Service Time Distributions,” Report PNA-R9702, CWI, Amsterdam, 1997.
- G. S. Mudholkar and D. K. Srivastava, “Exponentiated Weibull Family for Analysing Bathtub Failure Data,” IEE Transactions on Reliability, Vol. 42, No. 2, 1993, pp. 299-302. http://dx.doi.org/10.1109/24.229504