Applied Mathematics
Vol.4 No.5A(2013), Article ID:31906,8 pages DOI:10.4236/am.2013.45A007
Use of Finite Element Analysis for the Prediction of Driver Fatality Ratio Based on Vehicle Intrusion Ratio in Head-On Collisions
1TASS International, Livonia, USA
2Department of Mechanical Engineering, Wichita State University, Wichita, USA
Email: r_moradi_ir@yahoo.com, setpally334@gmail.com, hamid.lankarani@wichita.edu
Copyright © 2013 Rasoul Moradi et al. This is an open access article distributed under the Creative Commons Attribution License, which permits unrestricted use, distribution, and reproduction in any medium, provided the original work is properly cited.
Received March 1, 2013; revised April 1, 2013; accepted April 8, 2013
Keywords: Finite Element Modeling; Driver Fatality Ratio; Aggressive Crash; Head-On Collisions; Passenger Compartment Intrusion; Occupant Injury Potential
ABSTRACT
To estimate the aggressivity of vehicles in frontal crashes, national highway traffic safety administration (NHTSA) has introduced the driver fatality ratio, DFR, for different vehicle-to-vehicle categories. The DFR proposed by NHTSA is based on the actual crash statistical data, which makes it difficult to evaluate for other vehicle categories newly introduced to the market, as they do not have sufficient crash statistics. A finite element (FE) methodology is proposed in this study based on computational reconstruction of crashes and some objective measures to predict the relative risk of DFR associated with any vehicle-to-vehicle crash. The suggested objective measures include the ratios of maximum intrusion in the passenger compartments of the vehicles in crash, and the transmitted peak deceleration of the vehicles’ center of gravity, which are identified as the main influencing parameters on occupant injury. The suitability of the proposed method is established for a range of bullet light truck and van (LTV) categories against a small target passenger car with published data by NHTSA. A mathematical relation between the objective measures and DFR is then developed. The methodology is then extended to predict the relative risk of DFR for a crossover category vehicle, a light pick-up truck, and a mid-size car in crash against a small size passenger car. It is observed that the ratio of intrusions produces a reasonable estimate for the DFR, and that it can be utilized in predicting the relative risk of fatality ratios in head-on collisions. The FE methodology proposed in this study can be utilized in design process of a vehicle to reduce the aggressivity of the vehicle and to increase the on-road fleet compatibility in order to reduce the occupant injury outcome.
1. Introduction
Light trucks and vans (LTVs) account for one-third of all passenger cars in United States. Over 50% of vehicle accidents occur between LTVs and cars, out of which 81% of fatal injuries are in passenger cars [1]. This is due to the fact that LTVs and passenger cars are incompatible in road accidents, and LTVs are more aggressive compared to passenger cars [1-3].
Compatibility of a vehicle is a combination of its crash worthiness and aggressivity with other on-road vehicles. Crashworthiness is capability of a vehicle to protect its occupants involved in a crash where as aggressivity is a measure of how dangerous a vehicle can be in injuring occupants of the other vehicle involved in a collision. It is known that the ideal compatibility scenario is achieved only when the crash energy is shared equally between two cars involved in an accident [2,4]. This is only possible between two vehicles where they have identical load paths, stiffness and mass. These similarities result in lower cabin intrusions and identical decelerations and subsequently low injury potential to the occupants of each vehicle. An incompatible collision leads to a quite high injury potential to the occupant in relatively smaller vehicle.
Summers et al. [5] introduced a statistical measure called as “aggressivity metric” (AM), and calculated for individual vehicle categories in different impact configurations. This metric implies how aggressive a particular type of LTV is when compared to passenger car which is given based on statistical data collected by fatality analysis reporting system (FARS) and general estimates system (GES). They also conducted a number of experimental crash tests to investigate a relation between aggressivity metric and weight of and ride height of the car. It is found out that aggressivity metric will vary according to the vehicle design parameters such as weight, ride height, and structural stiffness of the vehicle [6,7].
An approach was proposed by Gabler et al. [6] to evaluate aggressivity of a car as:
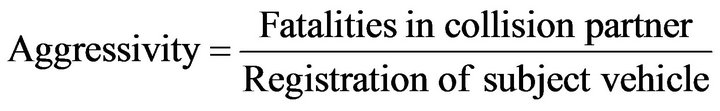 (1)
(1)
Normalization is done to prevent from penalizing vehicles with high registrations. The fatalities in the subject vehicles are only taken for two vehicle crashes, where both vehicles are either a car or an LTV. Using this method and the evaluating statistics, it was found out that the LTVs are twice more aggressive than the passenger cars and absorb less crash energy than the other vehicle contributed in a crash [2].
On the other hand, accidents are dependent on the drivers’ behavior, and generally aggressive drivers are prone to more accidents when compared to less aggressive drivers. Considering this point, a new metric was proposed [6], where the total number of fatalities in the collision was normalized by number of crashes in which the subject vehicle was involved as:
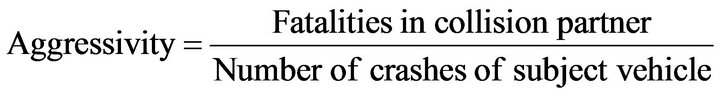 (2)
(2)
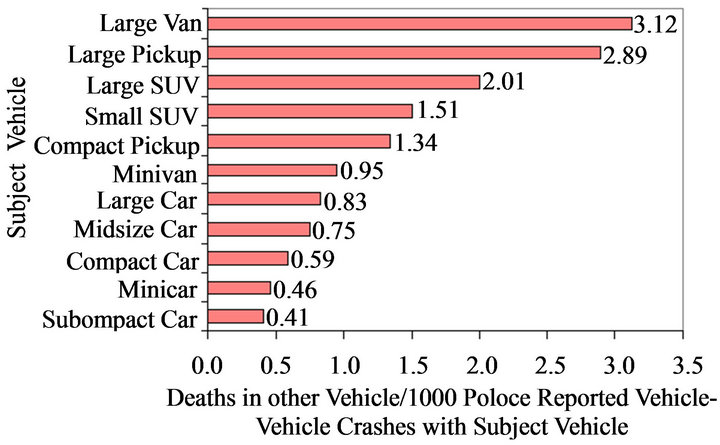
The aggressivity metric for different vehicle crashes is shown in Figure 1(a) for combined impact modes; i.e., frontal, rear, and side impact [8]. It shows that the large van is the most aggressive vehicle and the subcompact car is the least aggressive vehicle. AM for some vehicle crashes in frontal impact is shown in Figure 1(b), in which it can be interpreted that large pickup category vehicles have the AM of 0.069 which is more than that of mid-size cars with the AM of 0.011.
Aggressivity metrics are based on vehicle categories and depend on statistics, when one vehicle impacts any other vehicle in a specific impact mode. It is often desirable to have aggressivity metric for specific vehicle category-to-category which will assist in understanding the compatibility issues between specific vehicle categories. The aggressivity metric when calculated for specific vehicle category-to-category has not produced reliable data. Instead, NHTSA introduced the driver fatality ratio (DFR) based on statistics reported by FARS for specific vehicle category-to-category for different impact modes [8]. DFR values have been quite reliable and were only calculated for vehicles manufactured after 1990. In calculating the driver fatality ratio, driver age has also been taken into consideration; drivers with age less than 25 and greater than 55 were eliminated in calculation. Figure 2 shows the DFR against passenger car in frontal impact configuration [8].
The DFR proposed by NHTSA is based on the actual crash statistical data between specific vehicle categoryto-category crashes. In addition, there are differences between the mass, geometry, and stiffness of the different vehicles in each category. This makes it difficult to evaluate or use it for other vehicle categories newly introduced to the market, as they do not have sufficient crash statistics. In addition, there are not enough data for all
 (a)
(a)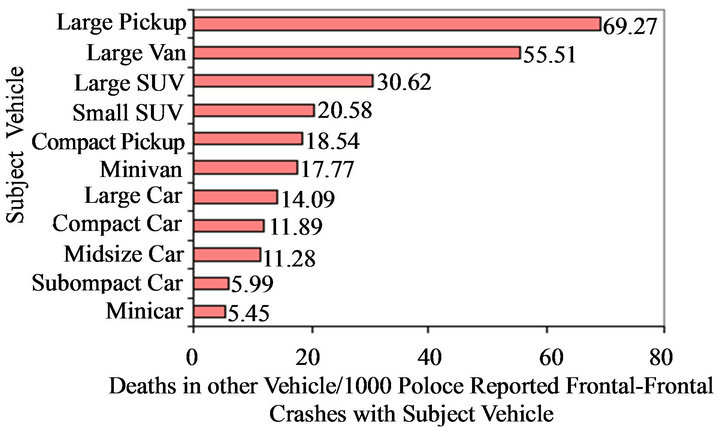 (b)
(b)
Figure 1. Aggressivitymetric of different vehicles in (a) combined crash mode, and (b) frontal crash [8].
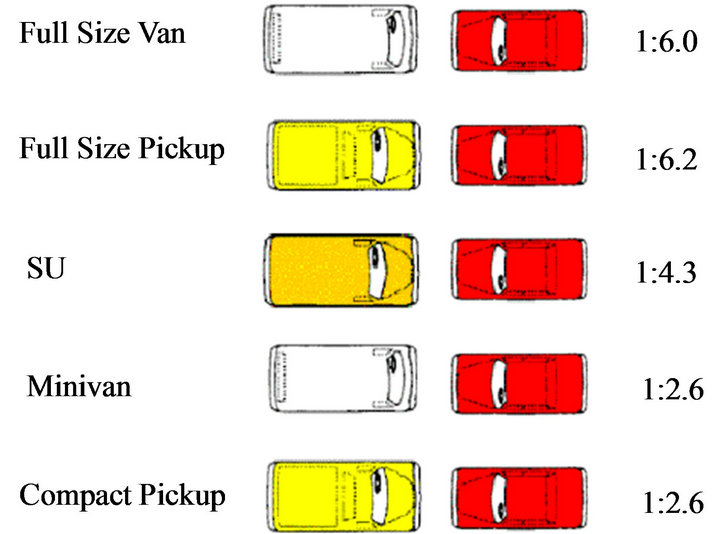
Figure 2. DFR of LTVs in frontal impacts against a passenger car [8].
vehicle category-to-category crashes to predict the DFR for them. Furthermore, due to lack of a unique procedure and baseline for the actual test of DFR evaluation, it is not possible to differentiate the DFR between different cars of each category. The computational finite element methodology introduced in this study can be utilized to estimate the DFR for each specific vehicle-to-vehicle crashes.
2. Methodology
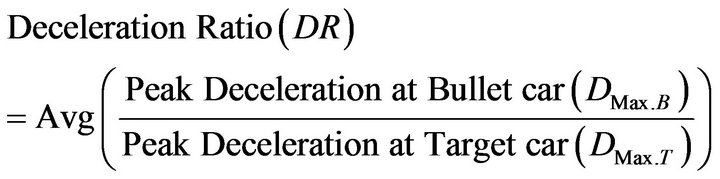
Today’s engineering and technology is vastly dependent on computational tools. A finite element methodology is proposed in this study based on computational reconstruction of crashes and objective measures to predict the DFR associated with vehicle-to-vehicle crashes. The suggested objective measures include the ratios of maximum permanent intrusions in the passenger compartments of the vehicles in crash, and the transmitted peak decelerations of the vehicles’ center of gravity, which are identified as the main influencing parameters on occupant injury [9].
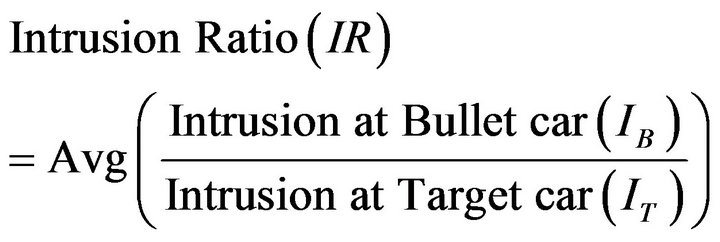
According to the insurance institute for highway safety, IIHS, the passenger compartment should keep its shape in the event of a crash. The passenger compartment intrusions are measured at different parts which are crucial in determination of the injury to the occupants [9-11], as shown in Figure 3. The instrument panel, roof pillars, pedals and floor panels should not be deformed excessively inwards, where they are more likely to injure the occupants. The measurements used by the IIHS represent the residual movement (pre-crash/post-crash difference) of interior structures in front of the driver dummy. In this study, for each vehicle utilized in a computational accident reconstruction, the residual intrusions (after crash) are measured at three different areas of each car, namely the firewall, the footwell, and the A-pillar. The intrusion ratios are averaged to come up with an estimate of the DFR. Due to the design specification of each car, some parts might be in the loading path of the crash (stiff part, less deformation) or be as an energy absorbing part (less stiff part, more deformation). In such cases, when due to the geometric incompatibility, one of the ratios is not in the same ball park as the other two (more than double or less than half), that ratio is considered as unreliable estimate and eliminated from the average intrusion ratio for DFR estimation. Along with these, the ratio of left seat and right seat decelerations are also measured representing the transmitted deceleration on each car’s occupant. The average ratio of intrusion and deceleration are calculated using the ratios at each point of both cars as:
 (3)
(3)
 (4)
(4)
where  and
and  are the permanent intrusions in each of three locations of bullet and target vehicles respectively,
  and
and  are the decelerations in right and left seats of bullet and target vehicles’ center of gravity. These ratios are subsequently compared with the statistical values for validation or substantiation. With the same methodology followed by Moradi et al. [9], the criterion is then used to predict the driver fatality ratio of bullet car with respect to target car,
  , for each vehicle-to-vehicle crashas:
 (5)
(5)
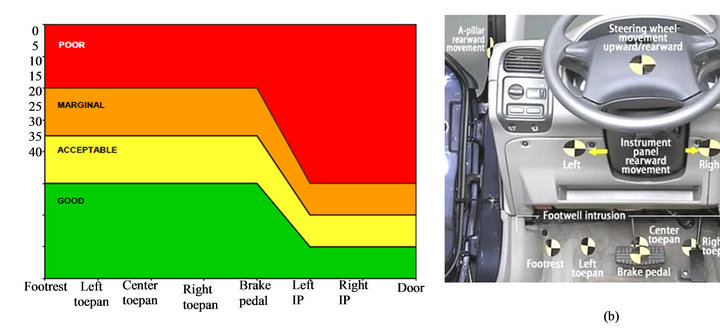
Figure 3. (a) IIHS guidelines for rating occupant compartment intrusion (cm) at (b) different locations according to IIHS.
In which ![]() and
and  are some unknown weight factors of the passenger compartment intrusion and transmitted deceleration of the vehicle center of gravity.
In this methodology, validated finite element models of all bullet and target cars from national crash analysis center (NCAC) are utilized [12]. LS-DYNA explicit code is utilized to construct and solve the non-linear contact problem while Hypermesh and LS-Prepost are the preand post-processing tools to create the crash scenarios and extract the results. Initial and boundary conditions are defined for each case, and the appropriate contact definitions are set to detect and apply the impact contact forces to participating components. Required controls are defined to control the stability of the finite element problem and time step are set small enough to capture all impact events.
In all crash simulations of this study, target car is held identical and bullet car is varied. Dodge-Neon is selected to represent a target passenger car, while Chevy-S10 as a compact pick-up, Dodge-Grand Caravan as a minivan, Ford-Explorer as a sports utility vehicle, Ford-F250 as a full size pick-up, and Ford-Econoline as a full size van are utilized as bullet vehicles. The methodology for intrusion results extraction and energy absorption comparisons between vehicles are quite similar to what was found in literature [13]. Figure 4 shows the FE models selected to represent different vehicle categories.
3. Results and Discussions
3.1. Substantiation of the Proposed Method
A series of virtual crash tests are conducted in LS-Dyna by having an identical target car, and varying the bullet cars representing a range of LTV’s, where both vehicles travelling at a speed of 35mph and having full width frontal impact. The speed was considered as it isthe one in the federal motor vehicle safety standard (FMVSS) 208 for frontal impact tests of cars. Figure 5 shows the snapshots of virtual crash tests between passenger car and LTVs. Intrusions and decelerations are measured in each case and are shown in Table 1. Table 2 shows the intrusion and deceleration ratios and their averages.
In the crash scenario of Chevy-S10 and Dodge-Neon, the weight ratio of Chevy-S10 to Dodge-Neon is 0.8:1, but the high intrusions in Neon indicate that S10 is stiffer than the Neon. The difference in the frontal geometry of two cars results in application of different load paths on each other, which leads to geometric incompatibility. The firewall, foot-well, A-pillar intrusion ratios are 1:2.5, 1:2.4, 1:2.5 respectively which are almost the same as the statistical DFR of 1:2.6. The left and right seat decelerations are: 1.2:1, 1.3:1, which do not have similar values compared with the DFR of 1:2.6 but inversely relates with the mass ratio of 0.8:1 according to Newton’s law.
For crash scenario of Dodge-Grand Caravan colliding against Dodge-Neon, the weight ratio of the Caravan to Neon is 1.5:1. Geometrical incompatibility results in high intrusions in the passenger car compared to the minivan. The hood and engine compartment of minivan are designed in such a way that it exposes the firewall during crash, which leads to high firewall intrusions in minivan than passenger car with a ratio of 1.3:1 which deviates from the statistical DFR of 1:2.6. The ratio of foot-well intrusion, A-pillar intrusion, left and right seat decelerations of 1:2.6, 1:2.4, 1:2.5, 1:2.4 respectively are almost analogous to the statistical DFR of 1:2.6.
In the case of Ford-Explorer and Dodge-Neon, the weight ratio and the DFR are 1.7:1 and 1:4.3 respectively. The left and right seat deceleration ratio and foot-well ratio does not have similar values compared with DFR.
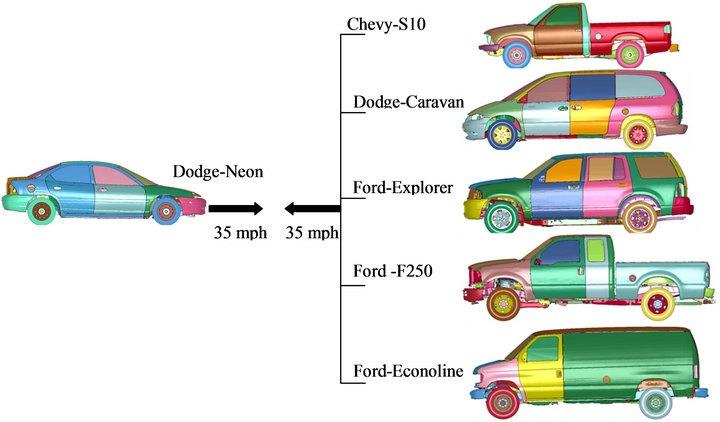
Figure 4. FE models selected to represent different vehicle categories.

Figure 5. Virtual crash simulations of passenger car against different LTVs.
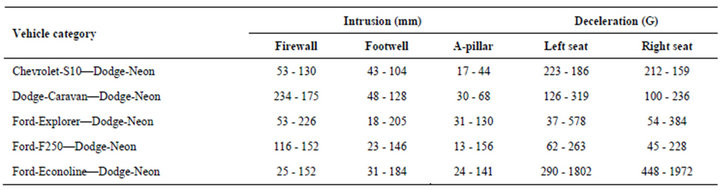
Table 1. Summary of Intrusions and accelerations for different vehicle combinations.
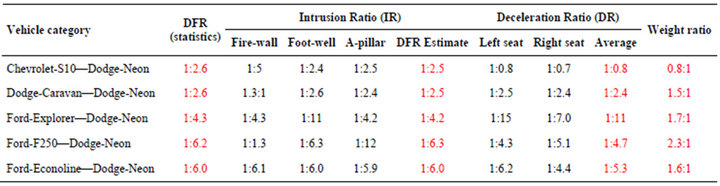
Table 2. Summary of ratios of objective measures in comparison with DFR for different vehicle combinations.
The firewall and driver side A-pillar ratio of 1:4.3 and 1:4.2 respectively are in reasonable agreement with the statistical DFR of 1:4.3, while footwell intrusion ratio deviates from the DFR.
In the crash scenario of Ford-F250 representing a full-size pick-up and Dodge-Neon, the weight ratio and the DFR are 2.3:1 and 1:6.2 respectively. The high difference in ride height results in the under-ride of the passenger car into the full-size pick-up. Due to the higher stiffness of the F250 compared to Neon, F250 will force Neon to absorb bulk of the crash energy. These three incompatibilities will result in fatal injuries to the occupants in the passenger car. The average of the firewall, driver side A-pillar, and foot-well intrusion ratios have similar values compared with the DFR number.
In the case of Ford-Econoline representing a full-size van impacting the Dodge-Neon, the huge difference in the ride height will definitely lead to under-ride of the smaller car into the full-size van initially. The weight ratio is 1.6:1 and the left and right seat deceleration ratiosslightly differ from DFR. The firewall, foot-well and driver side A-pillar intrusions ratios of 1:6.1, 1:6.0 and 1:5.9 respectively are in a quite reasonable agreement with DFR of 1:6.0.
From Table 2, it is evident that deceleration ratios of the vehicles involved in a collision are not linearly related to the statistical DFR. Obviously, with increase in weight of the vehicle, the stiffness incompatibility between vehicles also increases, which in turn shows its effect on intrusion ratios. The average intrusion ratios at firewall, foot-well and A-pillar are in correlation with the DFR. Using Equation (5) and the results from these analysis, it can be inferred that in DFR calculation, the influence of  is negligible. Re-writing of the Equation (5) yields:
 (6)
(6)
3.2. Application of the Proposed Method
Once the proposed methodology and evaluating the impact of incompatibilities on DFR are substantiated, three vehicles are selected to be evaluated with this methodology for DFR. The vehicles are Toyota-Rav4 representing a compact SUV, Chevy-C1500 representing a light duty truck category, and a Ford-Taurus representing a midsize passenger car. The virtual crash tests of these vehicles against Dodge-Neon are depicted in Figure 6. Table 3 shows the intrusions and decelerations measured and Table 4 shows the ratios of these objective measures.
In the crash scenario of Toyota-Rav4 and Dodge-Neon, the weight ratio of Rav4/Neon is 1.2:1 and ride height of Rav4 to Neon is in the ratio of 2:1. The intrusion ratio at firewall is 1:1.6, whereas the foot-well intrusion ratio is 1:1.7; driver side A-pillar intrusion ratio is 1:1.7. The deceleration ratios at left and right seat are 1:3.6 and 1:2.6 respectively.
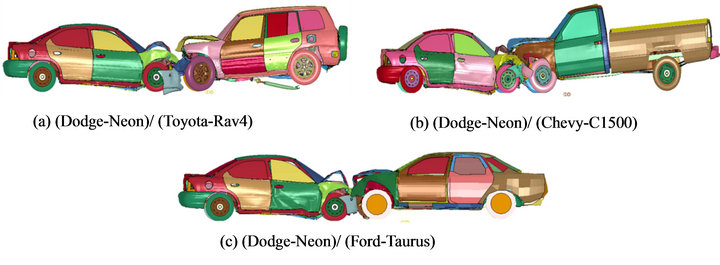
Figure 6. Virtual crash simulations of passenger car against Rav4, C1500 and Taurus.
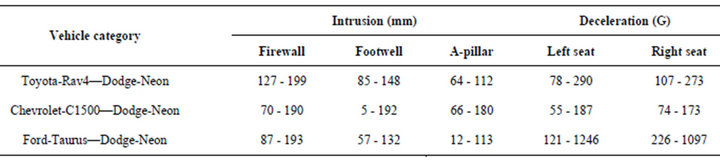
Table 3. Summary of Intrusions and accelerations for Rav4, C1500 and Taurus against Neon.
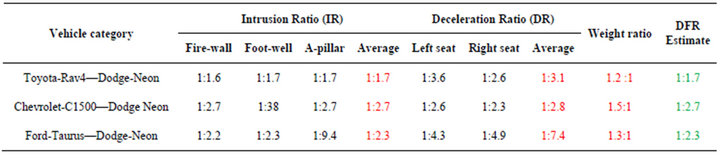
Table 4. Summary of ratios of objective measures in comparison with DFR for Rav4, C1500 and Taurus against Neon.
In the crash scenario of Chevy-C1500 against DodgeNeon, ride height of the pick-up is not enough to override on top of passenger car. The weight difference between two vehicles results in the deceleration ratios at the left and right seats of 1:3.4 and 1:2.3. The average intrusion ratios of C1500 against Neon at firewall and A-pillar are 1:2.7. The intrusion ratio for the foot-well resulted in a value which was not accounted in the average intrusion ratio.
In the virtual crash test of a mid-size car (Ford Taurus) crashing against a compact car (Dodge-Neon), the weight ratio of these two cars is 1.3:1. The ride height of these two cars is almost the same and will not lead to under-ride of Neon into Taurus. The intrusion ratios of Taurus against Neon at Firewall, Foot well, and A-Pillar are 1:2.2, 1:2.3 and 1:9.4 respectively. Except the Apillar intrusion ratio, the other two ratios resulted in a close peak value. From the ratios of intrusions, it can be evaluated that DFR of Toyota-Rav4, Chevrolet-C1500 and Ford-Taurus are 1:1.7, 1:2.7 and 1:2.3 respectively.
It was observed that the proposed method works differently for different vehicle combinations. When the three incompatibilities (mass, stiffness and geometric) are within the comparable range, the proposed method of approach can directly approximate the DFR, but when one incompatibility dominates the other, then different ratios in proposed methodology will vary.
4. Conclusions
The objective of this study was to investigate an objective-based methodology to predict the driver fatality ratio (DFR) using computational finite element analysis to determine key factors which leads to relative risk of fatal injuries to occupants of cars during collisions. The key factors which result in fatal injuries to the occupants were examined. The intrusion in passenger compartment based on IIHS guideline, and deceleration experienced by the occupants were identified as the main factors which lead to fatal injuries. Ratios of these objective measures for the bullet and target cars were calculated and compared with the statistical DFR for validation.
It can be concluded that “ratio of intrusion” provides a more consistent estimate for the relative risk DFR, especially when there is no huge difference in stiffness of colliding vehicles. Ratio of deceleration provides better results when the crash energy is absorbed equally between cars involved in collision (unit intrusion ratio). The presented method has some limitations as a particular vehicle is utilized to represent its class for the prediction of DFR. However, the strength of the approach is in the initial design of each individual vehicle. Utilizing this computational method, the relative risk DFR of the vehicle-to-vehicle can be approximately predicted during the design stage, and necessary changes to its design can be made to decrease its aggressivity prior to prototype manufacturing and physical testing. This method can be utilized for other crash configurations of the vehicles to conclude the DFR of a vehicle-to-vehicle in all crash modes. Using the methodology here, the triage can be conducted in case of any accidents based on the information on the vehicles participated in an accident and the probability of injury for each vehicle’s occupants.
REFERENCES
- H. C. Gabler and W. T. Hollowell, “The Crash Compatibility of Cars and Light Trucks,” Journal of Crash Prevention and Injury Control, Vol. 2, No. 1, 2000, pp. 19- 31.
- H. C. Gabler and W. T. Hollowell, “NHTSA’s Vehicle Aggressivity and Compatibility Research Program,” Proceedings of Fifteenth International Technical Conference on the Enhanced Safety of Vehicles, Melbourne, 13-16 May 1996.
- H. Joksch, D. Massie and R. Pichier, “Vehicle Aggressivity: Fleet Characterization Using Traffic Collision Data,” No. DOT-VNTSC-NHTSA-98-1, 1998.
- K. Digges and A. Eigen, “Measurements of Stiffness and Geometric Compatibility in Front to Side Crashes,” ESV Conference, Amsterdam, 4-7 June 2001.
- S. Summers, A. Prasad and W. T. Hollowell, “NHTSA’s Vehicle Compatibility Research Program,” SAE Paper 1999-01, 1999.
- H. C. Gabler and W. T. Hollowell, “The Aggressivity of Light Trucks and Vans in Traffic Crashes,” SAE Transactions, Vol. 107, 1999, pp. 1444-1452.
- V. R. R. Gottumukkala, “Study of Vehicle Aggressivity in Frontal Crash and Corresponding Occupent Responses,” M.S. Thesis, Wichita State University, Wichita, 2003.
- S. Summers, A. Prasad and W. T. Hollowell, “NHTSA’s Research Program for Vehicle Aggressivity and Fleet Compatibility,” Proceedings of the Seventeenth Annual International Conference on Enhanced Safety of Vehicles, Amsterdam, 4-7 June 2001.
- R. Moradi, R. Septally and H. M. Lankarani, “Influence of the Truck Side Under-Ride Guard Height on the Cabin Intrusion and Injury Potentials of the Small Car Occupants in Car/Heavy-Truck Side Crashes,” International Journal of Vehicle Structures and Systems (IJVSS), Special issue on Fracture Mechanics and Crashworthiness, Part II, Vol. 3, No. 3, 2011, pp. 169-177.
- L. Zaremba, J. Wong and C. Moffatt, “Eliminating Automobile Occupant Compartment Penetration in Moderate Speed Truck Rear Under-ride Crashes: A Crash Test Program,” Insurance Institute for Highway Safety (IIHS), Washington DC, 1997.
- IIHS, “Frontal Offset Crashworthiness Evaluation, Guidelines for Rating Structural Performance,” Insurance Institute for Highway Safety (IIHS), Arlington, 2002.
- “Finite Element Model Archive,” National Crash Analysis Center, George Washington University, 2012. http://www.ncac.gwu.edu/vml/models.html
- S. Patel, A. Prasad and P. Mohan, “NHTSA’s Recent Test Program on Vehicle Compatibility,” NHTSA Paper No. 09-0416, 2009. http://wwwnrd.nhtsa.dot.gov/pdf/esv/esv21/09-0416.pdf