Applied Mathematics
Vol.3 No.12A(2012), Article ID:26000,8 pages DOI:10.4236/am.2012.312A283
By Chance or Design? On the Locations of Controversial Billboards in Urban Ohio during the 2012 Election
Department of Geography, University at Buffalo, Buffalo, USA
Email: rcweaver@buffalo.edu
Received November 3, 2012; revised December 3, 2012; accepted December 11, 2012
Keywords: Politics; Race; Voting; Simulation; Probability Applications
ABSTRACT
The 2012 American Presidential Election was preceded by widespread efforts to promote stronger voting requirements in states across the nation. In one case, a private, anonymous foundation purchased advertising spots on billboards in urban Ohio to communicate that voter fraud is a felony punishable by fines and imprisonment. This action drew criticism from civil rights groups, who argued that a majority of the billboards were located in minority census tracts, and that the advertisements utilized intimidating language and imagery. This article applies probability theory to the debate in order to determine the likelihood that the observed patterns of billboards in two cities—Cleveland and Columbus—could have occurred by chance. First, simulation is employed to compare the observed allocations of billboards to white and non-white census tracts to patterns generated under Complete Spatial Randomness (CSR). Second, simulation draws from probit regression models, in which the dependent variable is the presence of a billboard within a census tract, are used to generate distributions of first differences between 1) the expected value of the dependent variable given that the census tract is majority white and 2) the expected value of the dependent variable given that the census tract is majority non-white. The results suggest that the billboard locations in Cleveland were not significantly different from patterns produced under CSR, and that the probability of a given census tract containing a billboard is not significantly different for white and non-white majority tracts. The opposite inferences are made for Columbus.
1. Introduction
The 2012 United States Presidential Election was preceded by widespread efforts to strengthen voting requirements in states across the nation [1]. Such efforts were both legislative and citizen-initiated, and they took on many forms [1,2]. In one case, a private, anonymous foundation purchased advertising spots on roadside billboards in urban Ohio to communicate that voter fraud is a felony punishable by fines and imprisonment. This action drew criticism from civil rights groups, who argued that the billboards utilized intimidating language and imagery [3]. Moreover, because a majority of the billboards were located in minority neighborhoods, voting rights groups asserted that the advertising campaign was intended to suppress minority turnout [3].
One way to evaluate the claims made by opponents of the billboards with respect to intent is to think probabilistically about the expected racial patterns of the billboards based on the demographic attributes of the cities in which they were located. For instance, did the billboards appear in more majority-minority geographies within a given city than what would be expected under a random allocation strategy? Additionally, is there a meaningful difference between the probabilities that a particular area contained a billboard given that a majority of its voting age residents are white or non-white?
This article applies probability theory to these questions in order to determine the likelihood that the observed patterns of billboard locations in white and nonwhite majority areas in two cities—Cleveland and Columbus—were random. First, simulation is employed to compare the observed allocations of billboards to majorityminority census tracts to patterns generated under Complete Spatial Randomness (CSR). Second, simulation draws from probit regression models, in which the dichotomous dependent variable indicates the presence of a billboard within a census tract, are used to generate distributions of first differences between 1) the expected value of the dependent variable given that the census tract is majority non-white and 2) the expected value of the dependent variable given that the census tract is majority white. The results reveal that the billboard locations in Cleveland were not significantly different from patterns produced under CSR, and that the probability of a Cleveland census tract containing a billboard is not significantly different for white and non-white majority tracts. The opposite inferences are made for Columbus. Thus the analyses produce no evidence to suggest that the Cleveland billboards disproportionately targeted minority populations, but convincing evidence to reject the hypotheses that the Columbus billboard locations were similar to a randomly generated pattern and were not differently allocated between white and non-white census tracts.
2. Background
2.1. Context of the Advertising Campaign
The 2008 General Election marked the first time in American history that a minority citizen appeared on the ballot as a major party candidate for United States President. In response to this momentous event, minority voters turned out in record numbers to take part in what would ultimately be a successful effort to elect the first African American President of the nation [4]. Research by the National Association for the Advancement of Colored People (NAACP) [5] suggests that this experience, rather than being an electoral anomaly, likely represents a changepoint in minority voting behavior. For example, while the 2010 midterm elections witnessed a participation drop-off that is characteristic of non-Presidential cycles, relative to the 2006 midterms “voters of color increased substantially as a share of the electorate in several states” [5].
Whether by coincidence or otherwise, during the following year, in 2011, 40 states introduced bills that would effectively make voting a more difficult activity [6]. That a trend toward stricter voting requirements has accompanied gains in minority voting participation has led some to speculate that the measures are camouflaged attempts to suppress turnout among these constituencies [5,6]. Civil rights groups have especially taken issue with policies that require voters to show government-issued photographic identification prior to casting a ballot, and those that decrease opportunities to vote early in person. They argue that both types of laws would disparately impact minorities, who lack requisite identification documentation at higher rates than white voters [7], and who tend to vote early in person at disproportionately high rates relative to whites [8].
On the other side of the debate, proponents of these policies assert that the measures are necessary in order to prevent voter fraud, thereby promoting electoral integrity [9,10]. This tension between maximizing access to and protecting the integrity of the electoral franchise in the US has spilled out of legislative chambers and into the public realm, with dozens of non-profit and non-governmental organizations lining up on either side of the issue [11]. The 2012 Presidential campaign cycle featured unprecedented involvement from such groups [11]. In one example, an advertising campaign in urban Ohio, ostensibly aimed at discouraging voter fraud, was decried by voting rights groups as a latent attempt to suppress minority voter turnout.
2.2. The Billboards and Their Opposition
In early October 2012, approximately one month ahead of the Presidential Election, billboards with the message “Voter Fraud is a Felony” began appearing in urban Ohio and Wisconsin. The billboards listed in bold text the maximum criminal punishments for voter fraud, and many of the ads displayed images of a courtroom gavel and sound block [12]. The advertisements were purchased anonymously by an entity identifying itself only as a “private family foundation” [12].
Shortly after the advertisements first appeared, civil rights groups urged the owners of the billboard apparatuses to terminate their contracts with the private family foundation and remove the ads [3]. The groups argued that a majority of the advertisements appeared on structures located in census tracts where the voting age population (VAP) is majority non-white, which they interpreted as a deliberate decision designed to intimidate minority voters and suppress turnout in the given neighborhoods [3]. To assess the validity of such claims, this paper opens the probability toolkit to study the randomness of billboard locations in Cleveland and Columbus, Ohio. The cities were selected on the grounds of data availability. Explicitly, copies of the advertising contracts for both cities were made available by the billboard owners, and the contracts listed each advertisement location. The same quality of information was not obtainable for other cities in Ohio or Wisconsin.
3. Data and Analysis
As stated in the preceding section, the data for this paper come from information provided by the company that owns the billboards in the Cleveland and Columbus metropolitan areas on which the “voter fraud” advertisements appeared. The contracts list 30 locations in each of the two metropolitan regions, for 60 total advertisements. In Cleveland, 23 of the 30 advertisements were matched to addresses within the city limits. All 30 of the Columbus advertisements were geocoded to Columbus addresses. Because of the concentration of billboards in city limits, the focus here is exclusively on the billboards within the cities, and each city is a separate study area. That is, suburban locations are not included in the analyses, nor are the seven advertisements located in suburban Cleveland.
Insofar as the billboard opposition used the demographic composition of 2010 census tracts to determine that a majority of the advertisements appeared in minority neighborhoods, this paper adopts the 2010 census tract as the unit of analysis [3]. Census tracts are delineated by the US Census Bureau to be as homogenous as possible, and to adhere to permanent physical boundaries [13]. In that sense, they are convenient proxies for neighborhoods.
It is therefore reasonable to claim that if a billboard is located in a census tract where the 2010 voting age population (VAP) is greater than 50 percent non-white, then that billboard is in a majority-minority neighborhood. Thus, for each city billboard, point locations were overlaid onto census tracts to determine membership and neighborhood VAP demographics.
One part of this overlay process requires further explication. Namely, for Cleveland, it is straightforward to determine which census tracts are within the city by using US Census TIGER/Line Shapefiles [14]. Simply put, all of the tracts wholly located within the Census Designated Place of Cleveland are part of Cleveland. There are no instances of tracts crossing over city lines. For Columbus, however, the sprawling and eccentric shape of the city splits several tracts, meaning that some census tracts are partially in the city and partially outside of it. To account for this, a minimum bounding convex hull is created around the Columbus Census Designated Place. Then, all tracts wholly within the convex hull are counted as part of Columbus (Figure 1). This procedure simultaneously includes in the analyses territories that are not officially within Columbus city, and excludes territories that are incorporated parts of Columbus city. Nonetheless, this is done in a non-arbitrary fashion using geometric properties of the city, and is therefore assumed to be an acceptable method for dealing with the boundary issues.
Tables 1 and 2 summarize the counts of billboard locations by majority white and majority non-white neighborhoods for Cleveland and Columbus, respectively.
Affirming the claims of civil rights groups, a majority of billboards in each city are located in non-white neighborhoods [3]. However, this fact alone does not translate into evidence of malicious intent, whereby advertise-

Figure 1. Columbus with minimum bounding convex hull.
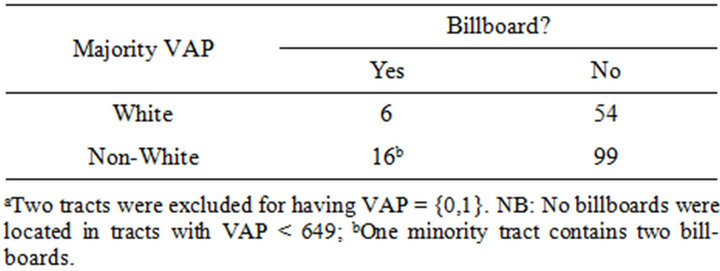
Table 1. Cleveland billboards by VAPa.
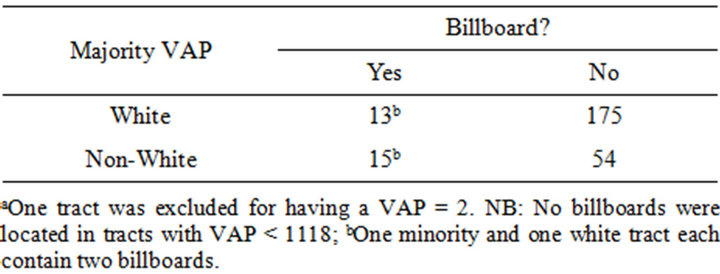
Table 2. Columbus billboards by VAPa.
ments were intentionally placed in minority communities. Rather, to address such issues, it is necessary to turn to probability.
3.1. Sampling without Replacement
A convenient place to begin is with the observation that 17 out of 23 billboards (73.9 percent) in Cleveland and 16 out of 30 billboards (53.3 percent) in Columbus are located in minority census tracts. Note that there are only three cases between the two cities for which multiple (two) billboards are located within a single tract. That being said, one can start from the working assumption that the advertisers wished to display their message in different neighborhoods across each city. The extreme of this assumption is that the advertisers desired placement in  different neighborhoods, where n is the total number of billboards and i is an index of cities such that:
 .
.
Under this assumption, 1000 trials randomly allocate  billboards to
  mutually exclusive tracts in each city. That is, the simulation trials essentially sample the tracts without replacement. Table 3 summarizes the outcomes of these trials relative to the observed allocations in each city. Figures 2 and 3 plot the histograms for Cleveland and Columbus, respectively.
In Table 3, m is the number of simulation trials,  is the observed number of billboards located in minority census tracts in city i, and
  is the probability that the simulated allocation of billboards to minority tracts is as extreme as the observed allocation. The latter quantity uses the relative frequency interpretation of probability, and it is the p-value to assess statistical significance [15]. In this regard, one cannot reject the null hypothesis that the Cleveland allocation of billboards to minority neighborhoods is significantly different from a
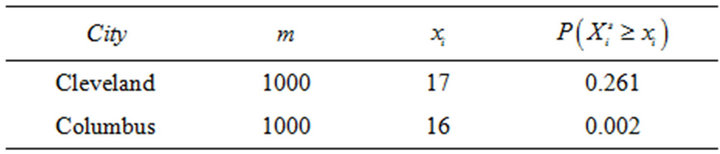
Table 3. Billboard allocations by tract VAP.
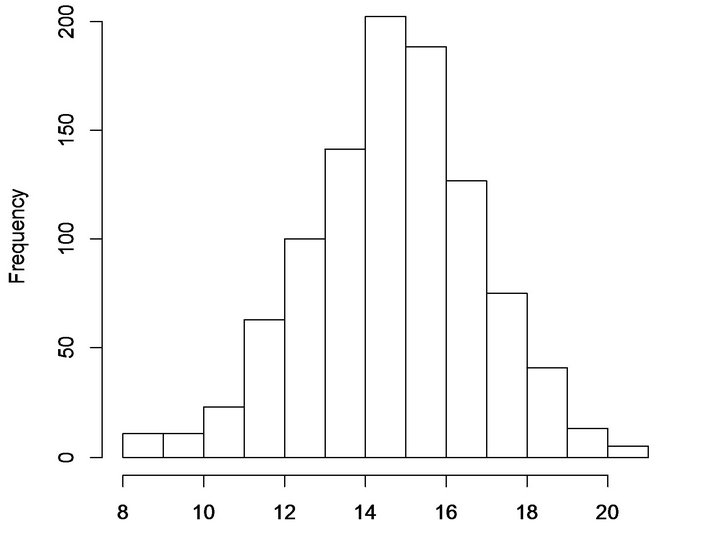
Figure 2. Histogram of simulated minority tract selection for cleveland, without replacement, E[X] = 15.2.
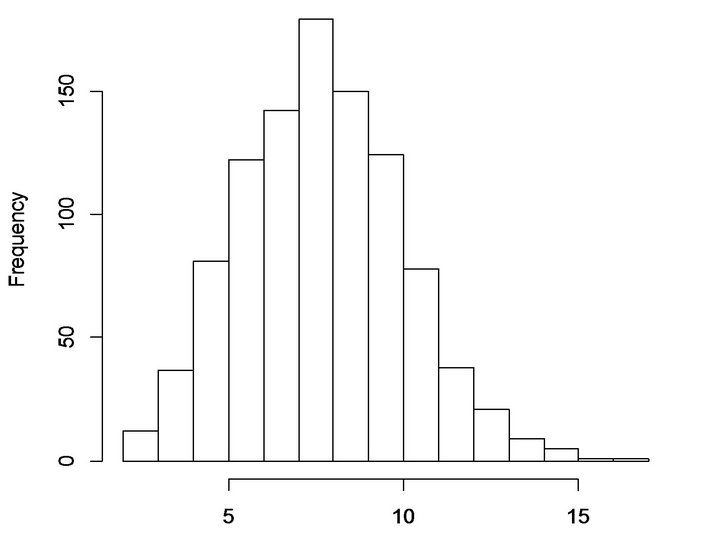
Figure 3. Histogram of simulated minority tract selection for columbus, without replacement, E[X] = 8.2.
random pattern at conventional levels of significance. The same hypothesis for Columbus can be rejected at all conventional significance levels.
It is worth noting that the p-values from Table 3 are approximately those that can be derived with Fisher’s exact test. To be sure, let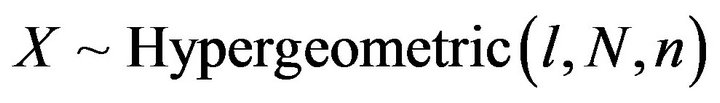 , where l is the total number of minority tracts in a given study area, N is the total number of census tracts in the study area, and n is the number of billboards to be located. These quantities can be extracted from the marginal values in Tables 1 and 2. Namely, for Cleveland:
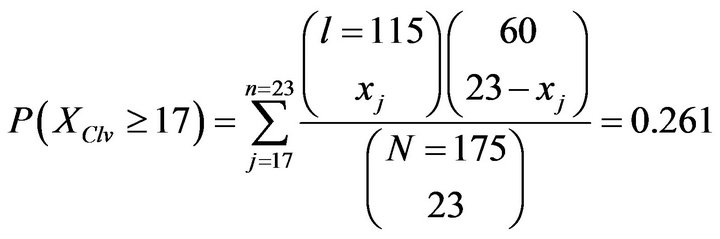 (1)
(1)
and for Columbus:
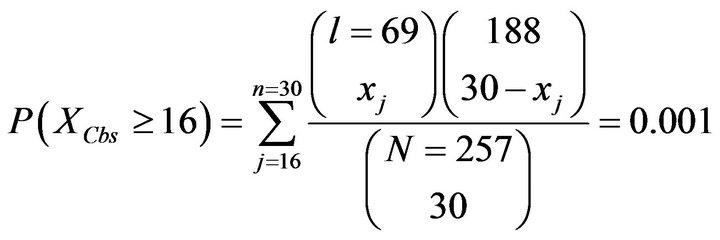 (2)
(2)
3.2. Complete Spatial Randomness
Although the first exercise offers some foundation on which to reject the null hypothesis of random billboard allocation by tract racial characteristics in Columbus, and to not reject the same hypothesis for Cleveland, a more interesting and convincing experiment would allow for sampling with replacement. That is, the observed patterns of billboard locations include a handful of cases for which multiple (two) billboards are allocated to a single tract. In that context, one can perform a similar simulation exercise as above, but under the assumption of Complete Spatial Randomness (CSR). Stated differently, a CSR data generating process can be used to locate billboards at random across the study areas [16]. The probability that a location plan allocates multiple billboards to one census tract in these circumstances is greater than zero, unlike in the foregoing analysis which sampled without replacement.
Using the same notation as above, 1000 simulation trials randomly locate  points (coordinate pairs) to each study area, such that each point represents one billboard. The points are then assigned membership to the census tracts in which they fall. Table 4 summarizes the outcomes of these trials relative to the observed allocations in each city; and Figures 4 and 5 plot the histograms for
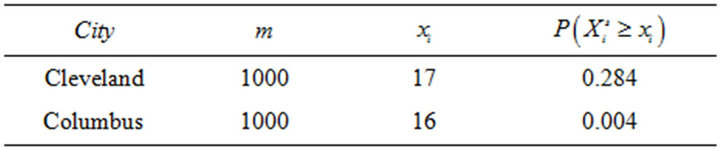
Table 4. Billboard allocations by tract VAP.
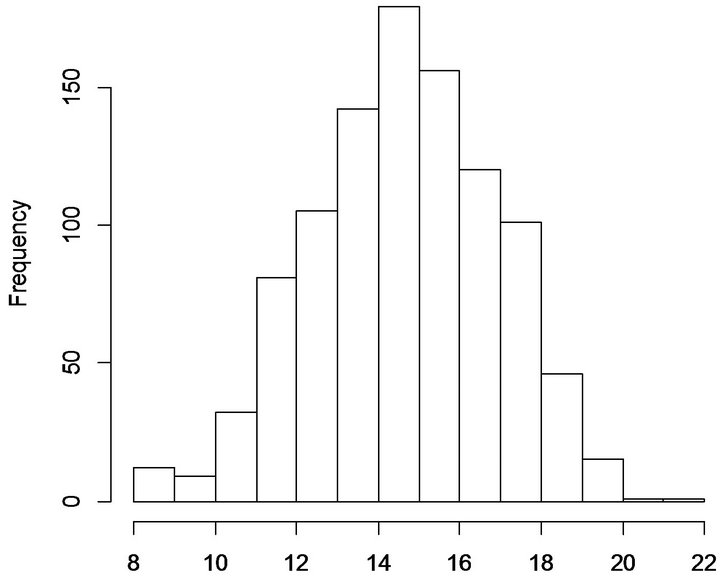
Figure 4. Histogram of simulated minority tract selection for Cleveland, complete spatial randomness, E[X] = 15.1.
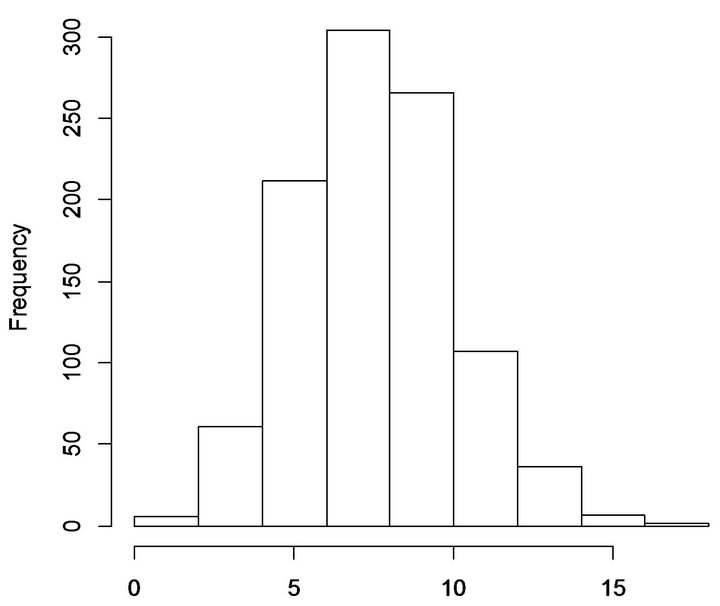
Figure 5. Histogram of simulated minority tract selection for Columbus, Complete Spatial Randomness, E[X] = 8.0.
Cleveland and Columbus, respectively.
Note that the p-values associated with each city’s observed allocation of billboards to minority tracts have increased relative to Table 3. This is to be expected, given that the simulation trials now allow for multiple points to be located in a single tract. Nevertheless, the increases do not change the substantive interpretations from Table 3. Specifically, the number of billboards located in minority neighborhoods in Cleveland is not significantly discernible from a pattern generated by CSR. At the same time, there is strong evidence to reject the null hypothesis that the allocation of billboards to minority neighborhoods in Columbus occurred by chance in a CSR data generating process.
3.3. Probit Regression and Simulated First Differences
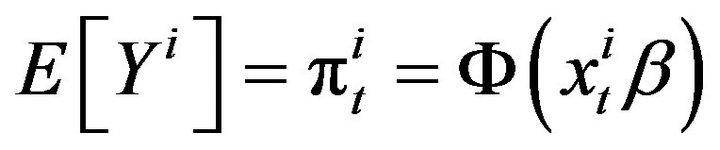
As a final exercise, this section estimates two probit regression models—one for each city—where observational units are census tracts, the dependent variable is a dichotomous indicator that takes on a value of one if there is a billboard in a given tract, and the single explanatory variable is a binary indicator that takes on a value of one if the tract has a majority non-white VAP. The reason for doing this is twofold. First, the estimated probit coefficients on the explanatory variables, and their standard errors, provide information about the direction and statistical significance of the relationship between a census tract’s probability of containing a billboard and it having a VAP that is majority (non-)white.
Second, and perhaps more importantly, simulation draws on the estimated model can be taken to generate distributions for various quantities of interest [17]. One quantity of interest that directly assists in determining whether the probability of a tract having a billboard is different for majority white and non-white tracts is the first difference between the expected value of the dependent variable for both types of tract [17]. What follows draws heavily on the work found in [17] and [18].
Let  be the observed dichotomous dependent variable for census tract t in city i, and
  be the explanatory variable indicating whether tract t has a majority non-white VAP, such that:
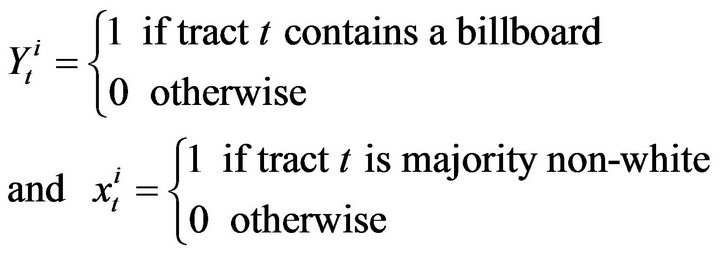 (3)
(3)
As shown in [18], the stochastic component of the model is given by:
 (4)
(4)
where . The systematic component, then, is:
 (5)
(5)
where  is the cumulative normal distribution with a mean of zero and a standard deviation of one.
To proceed with deriving the quantities of interest, one begins by estimating the probit models with the appropriate data (see Tables 1 and 2). The probit regression estimation results appear in Table 5, where the dependent variable is defined as above.
While the probit coefficients are not conveniently interpretable, observe that for both cities the estimated coefficients on the explanatory variable are positive. The implication is that having a majority-minority VAP increases the probability that a given census tract will contain a billboard. Coefficient sign notwithstanding, this relationship is not estimated to be statistically significant for Cleveland. For Columbus, on the other hand, the relationship is significant at all conventional levels. The inferences are therefore congruent with the inferences made in the preceding simulation exercises, though with slightly different meanings. The earlier analyses assessed the (non-)randomness of the overall billboard allocations, while here the concern is with whether or not having a majority non-white VAP increases the probability that a billboard will be assigned to a particular tract.
Recall that to address this problem more effectively,
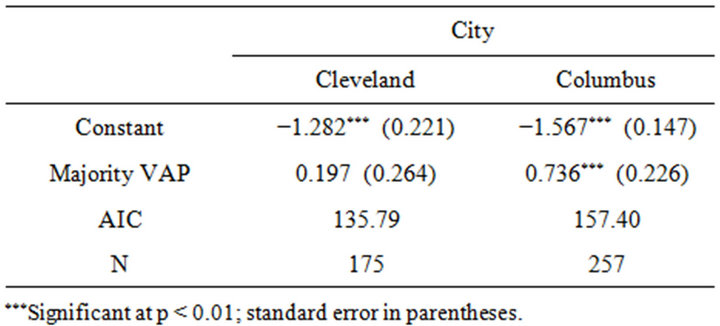
Table 5. Probit estimation results.
distributions of quantities of interest can be simulated by taking draws from the estimated probit models [17]. Then, as is developed in [18], the expected value of the dependent variable is a simulation of the predicted probability of having a billboard, over m trials:
 (6)
(6)
given a draw of  from its sampling distribution [18]. That being said, one can compute the first difference in expected values for tracts with white and non-white majorities by setting the explanatory variable to 0 and 1, and drawing m values of the outcome variable to find the expected values under each scenario. The first difference of interest is therefore given by:
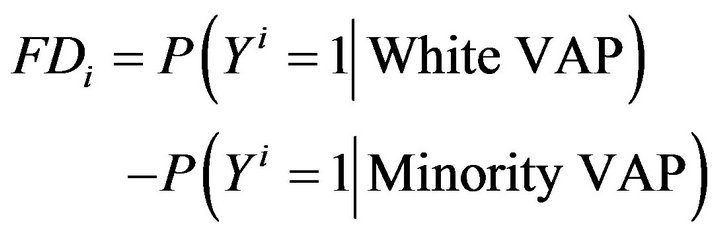 (7)
(7)
Statistical significance of the first differences can be assessed by constructing confidence intervals for selected significance levels. This is done by sorting the simulations and taking the and
and  observations, where
 ![]() is the desired significance level. If the value of zero is included in a particular confidence interval, then the first difference is not significant at the specified level of
is the desired significance level. If the value of zero is included in a particular confidence interval, then the first difference is not significant at the specified level of![]() . This is straightforward, insofar as a first difference equal to zero indicates no difference in the expected probability values. Taking this a step further, the minimum significance level (i.e., the p-value) at which the first difference is significant can be approximated by setting the difference between the absolute value of the point estimate and the simulated margin of error equal to zero and solving for z:
. This is straightforward, insofar as a first difference equal to zero indicates no difference in the expected probability values. Taking this a step further, the minimum significance level (i.e., the p-value) at which the first difference is significant can be approximated by setting the difference between the absolute value of the point estimate and the simulated margin of error equal to zero and solving for z:
 (8)
(8)
where  is the standard normal score such that:
 (9)
(9)
yields the minimum level of significance at which zero falls outside of the associated confidence interval, and the simulated first difference is statistically significant. Along these lines, m = 1000 simulation draws are taken from the models summarized in Table 5. Table 6 reports the results of doing this, and Figures 6 and 7 illustrate the corresponding histograms and density plots.
Complementing the results from previous analytical operations, the findings in Table 6 allow one to infer that—based on the observed data—the probability that a white tract contains a billboard is significantly and substantively lower than the probability that a non-white tract contains a billboard in Columbus. Specifically, the probability that a given tract contains a billboard is 14.6
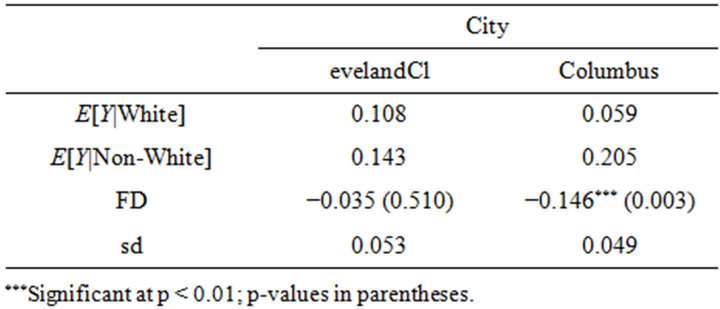
Table 6. Simulated first differences.
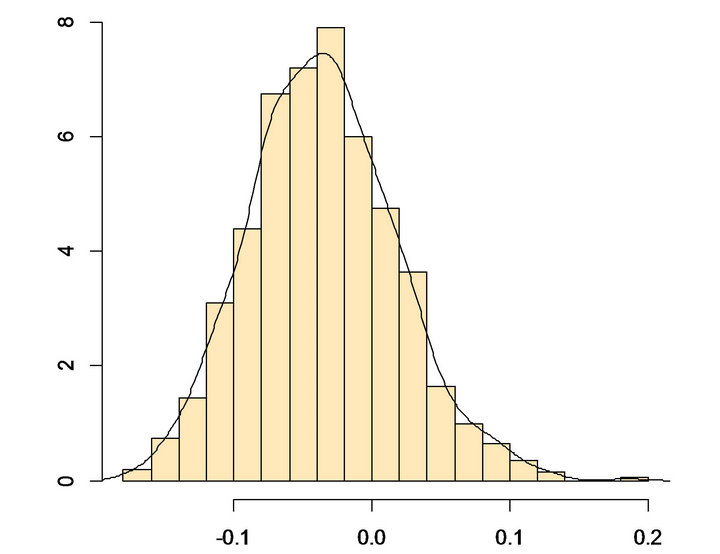
Figure 6. Histogram of simulated first differences for cleveland, E[Y|White] − E[Y|Minority] = −0.035.
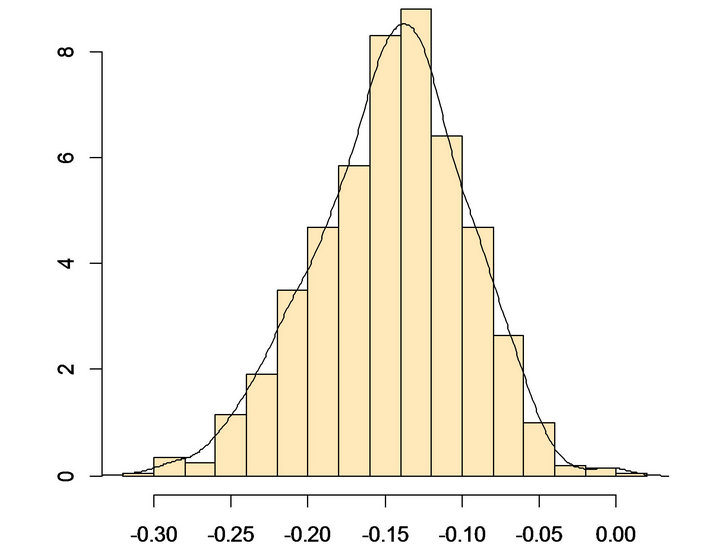
Figure 7. Histogram of simulated first differences for columbus, E[Y|White] − E[Y|Minority] = −0.146.
percentage points higher for non-white tracts relative to white tracts. This difference is 3.5 percentage points in Cleveland, though the expected value of the simulated first difference is not statistically significant.
4. Discussion and Conclusions
Recent public opinion polls have suggested that the 2012 American Presidential Election might be regarded as the most racially [19] and politically [20] polarizing election of its type in United States history. Such polarization is partially manifested in contemporary debates over the fundamental right of democratic political participation. On one side, proponents of stronger voting requirements argue that more protections are needed to safeguard the institution of voting [9]. On the opposite side, opponents of stricter rules argue that making participation more difficult will lead to lower turnout, particularly among traditionally underrepresented voters and minorities [5].
This tension between ballot integrity and ballot access led to several clashes prior to the 2012 Election, including one Ohio conflict between an anonymous private family foundation and civil rights groups. The private foundation purchased advertising on billboard spaces throughout Ohio that used allegedly intimidating language and imagery to discourage voter fraud. Civil rights groups pointed out that a majority of these advertisements were placed in minority neighborhoods (census tracts), which was interpreted as a deliberate campaign to suppress turnout among minority voters [3].
In this paper, the locations of the billboard advertisements in the cities of Cleveland and Columbus are assessed using applied probability theory. Two approaches are taken toward this end. First, simulation is used to randomly locate points across each city under an assumption of Complete Spatial Randomness (CSR). Then, a random variable is defined to be the number of minority tracts that are selected during the random allocation process. The simulated distributions of this variable for each city are used to calculate the probabilities that a random allocation is as extreme as the observed allocations [sc. of billboards to minority census tracts] in Cleveland and Columbus. The results suggest that the observed allocation in Cleveland is not statistically discernible from an allocation generated by a CSR process. This is not the case in Columbus, for which there is strong evidence to reject the null hypothesis that the observed pattern is consistent with a CSR-generated pattern. More precisely, there is no evidence to suggest that the allocation of billboards to minority tracts in Columbus was random. The findings therefore support arguments made by the anti-billboard faction for Columbus, but not for Cleveland.
Second, probit regression models are estimated in order to simulate distributions for a particular quantity of interest. The quantity of interest is the difference between the expected probability of observing a billboard in a census tract, given that the tract has a majority white voting age population (VAP), and the same probability given the tract has a majority non-white VAP. Performing this operation reveals that the probability of a billboard being located in a given Columbus census tract is expected to be 20.5 percent for a majority non-white tract, and only 5.9 percent for a majority white tract. The first difference—14.6 percentage points—is statistically significant at all conventional levels. The implication is that the advertisers were far more likely to place advertisements on billboards located in minority neighborhoods relative to white neighborhoods in Columbus. This finding offers strong empirical evidence to support the antibillboard side of the argument. Nonetheless, the same is not true in Cleveland, where the first difference is not statistically significant.
Collectively, then, the findings in this paper are mixed. The hypothesis that the Cleveland allocation was random cannot be rejected, and the probability of observing a billboard in a majority non-white census tract is not statistically different from the probability of observing a billboard in a majority white census tract. The opposite inferences are made for Columbus. There is ample evidence to suggest that the advertisement patterns in Columbus were nonrandom, and perhaps even targeted to non-white neighborhoods. Although the ambiguous overall nature of these findings will not conclusively resolve the tension between the proand anti-billboard factions, the application of probability theory to the problem helps to turn erstwhile policy disagreements into empirical observations. The empirical observations, in turn, can become valuable contributions to the public discourse. Accordingly, this paper demonstrates how probability tools can enter and add insight into practical political and ideological conflicts in which empirical data are available for analysis.
5. Acknowledgements
The author thanks the Lawyers’ Committee for Civil Rights under Law for supplying billboard data from Clear Channel Outdoor that were used in this project.
REFERENCES
- W. R. Weiser and L. Norden, “Voting Law Changes in 2012,” Brennan Center for Justice, New York, 2012.
- W. R. Weiser and V. Agraharkar, “Ballot Security and Voter Suppression,” Brennan Center for Justice, New York, 2012.
- S. Donaldson, “Washington Group Asks for Clear Channel to Remove Voter Fraud Billboards,” The Cleveland Plain Dealer, Cleveland, 2012.
- M. H. Lopez and P. Taylor, “Dissecting the 2008 Electorate: Most Diverse in U.S. History,” Pew Research Center and Pew Hispanic Center, New York, 2009.
- National Association for the Advancement of Colored People (NAAP), “Defending Democracy: Confronting Modern Barriers to Voting Rights in America,” NAACP Legal Defense and Educational Fund, New York, 2011.
- Voting Rights Institute, “A Reversal in Progress: Restricting Voting Rights for Electoral Gain,” Democratic National Committee, Washington DC, 2011.
- Brennan Center for Justice, “Citizens without Proof: A Survey of Americans’ Possession of Documentary Proof of Citizenship and Photo Identification,” Brennan Center for Justice, New York, 2006.
- M. C. Herron and D. A. Smith, “Souls to the Polls: Early Voting in Florida in the Shadow of House Bill 1355,” Election Law Journal, Vol. 11, No. 3, 2012, pp. 331-347.
- H. A. Von Spakovsky, “The Effect of Identification Requirements on Minority Voter Turnout,” The Journal of the Federalist Society Practice Groups, Vol. 8, No. 1, 2007, pp. 87-95.
- United States Senate Republican Committee, “Putting an End to Voter Fraud,” United States Senate Republican Committee, Washington DC, 2012.
- S. Childress, “Unprecedented Number of Restrictive Voting Laws Being Introduced,” PBS Frontline, 2012.
- S. Donaldson, “Politicians Say Advertisement in Ward 5 Discriminates against Minorities and Felons,” The Cleveland Plain Dealer, Cleveland, 2012.
- United States Census Bureau, “Geographic Terms and Concepts—Census Tract,” United States Census Bureau, Suitland, 2012.
- United States Census Bureau, “TIGER/Line Shapefiles Pre-Joined with Demographic Data,” 2012. http://www.census.gov/geo/maps-data/data/tiger-data.html
- J. E. Burt, G. M. Barber and D. L. Rigby, “Elementary Statistics for Geographers,” 3rd Edition, Guilford Press, New York, 2009.
- D. O’Sullivan and D. Unwin, “Geographic Information Analysis,” John Wiley & Sons, Hoboken, 2003.
- G. King, M. Tomz and J. Wittenberg, “Making the Most of Statistical Analyses: Improving Interpretation and Presentation,” American Journal of Political Science, Vol. 44, No. 2, 2000, pp. 347-363. doi:10.2307/2669316
- K. Imai, G. King and O. Lau, “Zelig: Everyone’s Statistical Software,” 2012. http://gking.harvard.edu/zelig
- G. Younge, “This is Shaping up to be the Most Racially Polarized US Election Ever,” The Guardian, London, 2012.
- J. M. Jones, “Americans’ Views of Obama More Polarized as Election Nears,” Gallup, Princeton, 2012.