Advances in Bioscience and Biotechnology
Vol.5 No.1(2014), Article ID:41849,6 pages DOI:10.4236/abb.2014.51007
Binding specificity and affinity analysis of an anti-protective antigen peptide reagent using capillary electrophoresis
![]()
1US Army Research Laboratory, Adelphi, USA
2Goldbelt Raven, LLC., Frederick, USA
Email: *joshua.m.kogot.civ@mail.mil
Copyright © 2014 Joshua M. Kogot et al. This is an open access article distributed under the Creative Commons Attribution License, which permits unrestricted use, distribution, and reproduction in any medium, provided the original work is properly cited. In accordance of the Creative Commons Attribution License all Copyrights © 2014 are reserved for SCIRP and the owner of the intellectual property Joshua M. Kogot et al. All Copyright © 2014 are guarded by law and by SCIRP as a guardian.
Received 18 September 2013; revised 15 December 2013; accepted 2 January 2014
KEYWORDS
Affinity Capillary Electrophoresis; Peptide Biosensor; Peptide-Protein; Display Library
ABSTRACT
Peptide biosensor reagents are emerging as an alternative to typical antibody-based detection methods. Peptides can be rapidly isolated using bacterial display methods for new and emerging biothreats and can be chemically synthesized for rapid, large-scale production. With the emergence of peptide biosensor reagents, there is a growing need to develop methods for characterizing binding interactions. Capillary electrophoresis (CE) is a free-solution separation method that is able to determine target and analyte binding association (Kb) and dissociation constants (Kd). In this study, the Kb, Kd, and peptide specificity of an isolated peptide binding reagent to protective antigen (PA) of Bacillus anthracis were evaluated using capillary electrophoresis at 10 and 20 kV. The relative binding specificity was rapidly assessed by measuring the peptide relative mobility shift at 20 kV at nonequilibrium using bovine serum albumin (BSA), horseradish peroxidase (HRP), and an anti-PA monoclonal antibody (mAb). The αPA peptide was shown to be highly specific for PA, with a Kd = 177 nM measured at 20 kV and Kd = 312 nM measured at 10 kV. These results show that peptides from bacterial display libraries can be rapidly tested for specificity and binding affinity, in solution, for use as a potential biosensor reagent against new and emerging biothreats.
1. INTRODUCTION
Since the use of Bacillus anthracis as a bio-weapon in the US in 2001, there has been a desire for an improved method for sensing small quantities of biological threats. The Protective Antigen (PA) protein of B. anthracis is the common shuttle protein in both the edema toxin and lethal toxin complexes. PA is an 83 kDa monomer that is activated by a cell surface furin protease to form a 63 kDa oligomeric pore complex on the cell surface to transport lethal factor (LF) and edema factor (EF) proteins into the cell [1]. In this study, the binding affinity and specificity of a synthetic peptide isolated for PA sensing are determined using capillary electrophoresis (CE).
Accurately measuring binding affinity and rapidly assessing binding specificity using minimal sample is critical for the analysis of protein-peptide interactions where sample is severely limited. A solution-based assay such as CE offers a highly sensitive solution technique requiring minimal sample as an alternative to conventional surface bound immunoassay techniques such as enzymelinked immunosorbent assays (ELISA) and surface plasmon resonance (SPR) [2]. Surface-bound immunoassay techniques such as ELISA and SPR are particularly challenging for small peptide systems, as they require complete surface adsorption of target material to a solid support, which can hinder the accessibility of binding sites. Alternatively, CE is a high-speed, highly sensitive, and easily automatable microfluidic method that can be used to measure the interactions between biomolecule targets. To date, much of the work with CE and optical biosensors has focused on aptamers or nucleic acid molecular beacons for target detection, typically with a mobility shift for the aptamer [3-6]. In this study, we show that affinity capillary electrophoresis (ACE) can be used to measure peptide specificity and binding affinity of a synthetic peptide selected from a bacterial display library to bind exclusively to PA of B. anthracis.
Peptide display libraries are highly diverse combinatorial libraries from yeast, phage, bacteria, and synthetic libraries that are screened against specific targets to isolate polypeptides for sensing, detection, and materials applications [7-10]. Analysis of target binding of the enriched display library population is typically performed using flow cytometry to measure the on-cell binding affinity and on-cell specificity [11-14]. Flow cytometry requires long cell-growth times followed by washing and labeling steps but is able to analyze multiple samples for affinity while measuring specificity against a panel of potential cross-reacting targets [11]. Once the on-cell analysis of peptide libraries is complete, each peptide candidate is synthesized for off-cell analysis using ELISA and SPR [15,16]. ELISA is used for determining binding dissociation constants (Kd), as well as reagent specificity. SPR can be used for probing association (kon) and dissociation (koff) rates along with binding dissociation constants [17-19]. Both ELISA and SPR require adsorption or attachment of the peptide or protein target. In ELISA, the target is adsorbed to a microwell plate surface, often polystyrene, and for SPR the target is adsorbed to a plasmon active surface, typically a glass slide with a silver or gold layer. The surface attachment or adsorption can impact the molecular recognition by restricting necessary conformational changes or limit binding due to surface steric interactions, as reported with biotin terminated peptides at streptavidin surfaces [20,21]. Alternatively, peptides can be used as the analyte in SPR experiments with immobilized targets, although high concentrations are necessary to achieve the required sensitivity and the risk of binding and rebinding is constantly a problem [17,22].
CE promises a rapid, solution-based microfluidic technique to determine peptide affinity and specificity. In addition, CE employs both UV absorbance and highsensitivity laser-induced fluorescence (LIF) for detection as low as picomolar concentrations of analyte [23]. LIF detection is advantageous for analysis of hazardous protein toxins using dye-labeled peptide sensing reagents since only a small amount of material is required for detection and analysis.
The current study demonstrates the use of affinity capillary electrophoresis (ACE) as a rapid method for specificity analysis of an anti-PA (αPA) peptide isolated from a bacterial display library. The principles of ACE can be extended to measure reagent specificity, especially for peptide display reagents isolated in a complex matrix: streptavidin magnetic beads, other surface display peptides, and cell lysate materials. Specificity measurements using ELISA can be limited to available antibodies for sandwich assays, whereas SPR specificity would require optimizing immobilization and retention of activity of a large number of separate cross-reacting proteins to test on chip. In this paper, an all-in-one CE approach is developed for rapid affinity and specificity studies and evaluation of peptides for incorporating into PA and B. anthracis biosensors is demonstrated.
2. MATERIALS AND METHODS
2.1. Reagents and Materials
All chemicals were purchased from Sigma-Aldrich (St. Louis, MO; USA) unless otherwise stated. Protective antigen (PA) protein of Bacillus anthracis was purchased from List Biological Laboratories, Inc. (Campbell, CA; USA). Bovine Serum Albumin (BSA) and horseradish peroxidase (HRP) purchased from Thermo Fisher Scientific (Rockford, IL; USA) and an anti-PA mouse monoclonal antibody (mAb) from U.S. Biological (Swampscott, MA; USA) were diluted in run buffer (10 mM Potassium Hepes pH 7.5) prior to use. EZ-Link Sulfo-NHS-Biotin (Thermo Fisher Scientific; Rockford, IL; USA) was used to biotinylate PA for magnetic sorting with Dynabeads® MyOne™ Streptavidin T1 beads (Invitrogen, Carlsbad, CA; USA). An αPA peptide, DGLHPWWNNAPLGQR, was synthesized with a N-terminal FITC label (αPAFITC) using an aminohexanoic acid (Ahx) spacer (RS Synthesis; Louisville, KY; USA) and was used for all LIF-CE studies.
2.2. Selection of αPA Peptide
A series of αPA peptides were isolated from the eCPX bacterial display library (Cytomx Therapeutics; San Francisco, CA) using a microfluidic magnetic sorter (MMS; Cynvenio Biosystems) as described previously [21,24]. Briefly, an aliquot of the randomized Escherichia coli library containing 3 × 10¹⁰ unique surface-expressed, randomized 15-amino acid peptide clones was grown at 37˚C while shaking at 250 RPM in 500 mL Luria Broth (LB) growth media containing 25 µg/mL chloramphenicol (LB-Cm25) to an OD600 of approximately 0.6. After mid-log growth, the peptide display library was induced with a final concentration of L-arabinose of 0.04% (w/v) [25]. The cells were shaken at 37˚C for an additional 45 mins, before pelleting approximately 2 × 10¹¹ cells by centrifugation at 5000 × g for 20 mins. The pelleted library was depleted of all streptavidin binders with a negative sort, as previously described before selection of αPA peptides [24]. Four rounds of MMS sorting were performed with decreasing biotinylated PA protein concentrations in each round (600, 300, 150, 75 nM). PA protein was suspended in 1 mL phosphate buffered saline with 0.5% bovine serum albumin (PBSB) containing biotinylated protective antigen, and incubated with the peptide display library at 4˚C for 45 mins. Cells were centrifuged as above and resuspended in 1 mL PBSB buffer with T1 streptavidin coated beads. After 45 mins at 4˚C with rotation, magnetic sorting was performed using the MMS to enrich the bacteria population that was bound to the PA-magnetic bead conjugate. After each round of magnetic separation, the bead-bound enriched library was grown overnight in LB-Cm25 media supplemented with 0.2% glucose to proceed with further sorting rounds. After four rounds of sorting, clones were sequenced (Genewiz; Germantown, MD; USA) to determine the amino acid sequence for the random peptide expressed on the cell surface.
2.3. Capillary Electrophoresis (CE) Analysis
CE analyses were performed on a P/ACE™ MDQ (Beckman Coulter; Brea, CA; USA). Uncoated fusedsilica capillaries (37 cm total length, 30 cm effective length, 50 μm i.d., 375 μm o.d.) from Beckman Coulter were used for all separations. The sample storage temperature was maintained at 4˚C prior to separation and each experiment was performed with the capillary cartridge temperature held at 25˚C. The electrophoresis voltage was either 10 kV or 20 kV in normal polarity mode. Sample detection was achieved using laser-induced fluorescence (LIF) measured at 488 nm excitation and 520 nm emission using a 3 mW argon ion laser. Prior to using a new capillary, each capillary was conditioned according to manufacturer instructions using methanol, water, 0.1 M HCl, 0.1 M NaOH, water, and run buffer (10 mM potassium Hepes pH 7.5). Prior to beginning experiments at the start of each day, the capillary was washed with 0.1 M NaOH for 5 mins, followed by run buffer for 10 mins.
2.3.1. Rapid Peptide Specificity Analysis
The peptide specificity analysis was performed by CE using PA (positive control), BSA, HRP, and an anti-PA mAb at 20 kV as described above. Each protein was incubated with the αPAFITC peptide at a 1:1 ratio (3 μM final concentration) in 20 μL total volume with run buffer and 1.5 μM fluorescein as an internal mobility standard for 30 mins at room temperature. The samples were stored at 4˚C prior to injection, with each separation performed with the capillary cartridge temperature held at 25˚C. Each sample was analyzed for a mobility shift difference compared to the initial αPA mobility shift. The specificity of the αPA peptide was measured at 20 kV against a commercial anti-PA monoclonal antibody and two proteins used in immunoassays with a similar pI to PA protein (pI = 5.64), bovine serum albumin (BSA; pI = 5.6) and horseradish peroxidase (pI = 6.35). The relative mobility shift was measured in triplicate at both 10 kV and 20 kV to determine the binding affinity and dissociation constant of the αPA peptide as a function of PA protein concentration.
2.3.2. PA-αPA Binding Analyses
The αPA peptide (3 μM final concentration) was mixed with varying PA protein concentrations (0 - 3 μM) in a 20 μL total volume in 10 mM potassium Hepes pH 7.5 running buffer that contained 1.5 μM fluorescein as an internal mobility standard. Fresh buffer vials were used between each sample to avoid buffer depletion, as well as concerns with altering the binding affinity due to residual PA or peptide in the column or run buffer. Furthermore, to avoid sample contamination, the capillary was washed with 0.1 M NaOH for 2 mins, water for 2 mins, and buffer for 10 mins between each measured sample. All samples were injected with pressure injection using 0.5 psi for 5 s. The binding constant (K) can be determined by performing a non-linear fit of the binding isotherm due to the change in relative mobility of the αPA at varying PA concentrations. The peptide-PA complex, (αPA)PA, free substrate, αPA, and the mobility of the saturated complex, (αPA)PAsat, are graphed and fit to the expression adapted from Jiang et al. [26].
 (1)
(1)
3. RESULTS AND DISCUSSION
Using the MMS and a bacterial display library enables the rapid isolation and subsequent identification of a peptide reagent as an antibody alternative in less than one week [27]; each round of MMS sorting with bacterial display requires one-day for target binding, MMS sorting, and overnight growth of enriched, positively selected clones. Besides being semi-automated, the MMS sorting is performed in closed-system with a disposable cartridge to limit user exposure to dangerous biological targets [24].
After four rounds of MMS sorting with PA, the resultant single clones were analyzed on-cell to determine the best PA binding clone. The best clone is determined by the sample that has the highest affinity and best specificity on-cell compared to all samples tested. In this current study, the clone that had the best affinity and specificity contained the insert for the amino acid sequence DGLHPWWNNAPLGQR displayed on the cell outer membrane surface, as determined by translating the variable region of the DNA sequence in the eCPX 3.0 library vector [11]. The peptide was synthesized with an N-terminal FITC for CE analysis using LIF of the peptide affinity and specificity in solution.
3.1. αPA Specificity Analysis by CE
Specificity analysis of the αPA peptide (Figure 1) with PA, BSA, HRP, and mAb resulted in the αPAFITC peptide having the greatest mobility difference, approximately 20 s mobility shift at 20 kV, when incubated with the PA sample. The αPAFITC peptide shows no mobility difference when incubated with BSA and HRP implying no interaction with these proteins. A mobility shift of approximately 6 s was measured with the (αPA)mAb. It was not too surprising that the (αPA)mAb showed a small relative mobility shift since we would expect that similar hydrophobic and electrostatic interactions exist between the (PA)mAb and (αPA)PA complexes to direct the binding interactions. The αPA peptide displayed high specificity for PA overall compared to BSA, HRP, and (PA)mAb. The lack of interaction with BSA was important since BSA is used at 0.1% - 0.5% during the enrichment of cell populations in bacterial display library sorting. Lack of binding to HRP would enable this peptide to be used in future peptide ELISA studies with PA [21].
Peptide specificity from peptide display libraries is critical, but often overlooked, especially for peptides developed for reagent use in sensors and diagnostics of complex samples: serum, soil, water, etc. Peptide affinity CE provides a rapid method to determine, within minutes, the specificity of display peptides rather than using other conventional, more time-consuming methods such as ELISA, flow cytometry, and SPR. CE can be automated to rapidly screen against BSA, HRP, and primary or secondary antibodies prior to more conventional immunoassay analysis.
3.2. αPA Mobility Shift with Protein
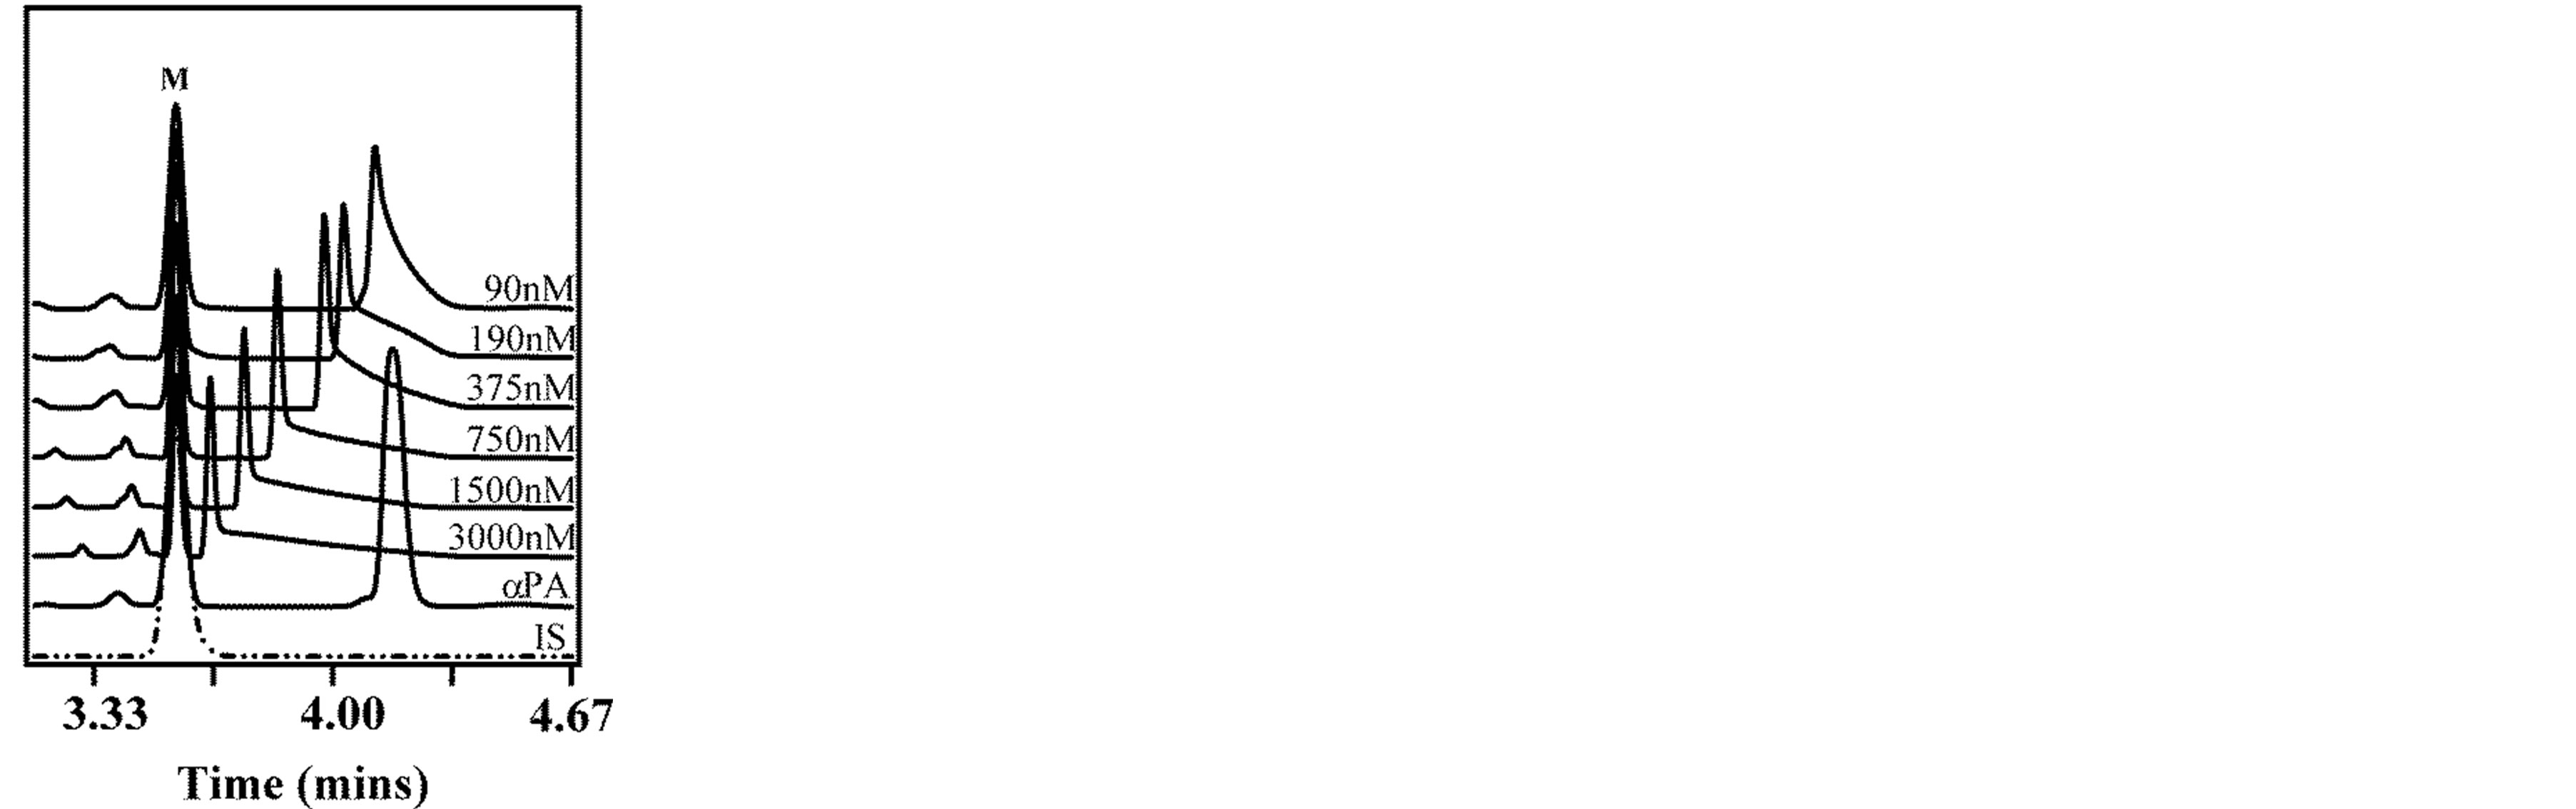
The αPAFITC displays a 50 s mobility shift when bound with PA protein at saturation (~3000 nM) as determined by CE experiments with PA protein at 10 kV at nonequilibrium (Figure 2(a)). Varying the PA concentrations from approximately 3000 nM to 0 nM resulted in a marked shift in the αPA-PA complex mobility from largest mobility shift toward the free αPAFITC peptide. In each sample at 10 kV, there was no observed free αPAFITC peptide, which is typically observed in nonequilibrium capillary electrophoresis of equilibrium mixtures experiments (NECEEM) [28-31]. The absence of a free peptide peak at nonequilibrium suggests that the peptide is in rapid equilibrium, or rebinding, between the unbound state and the complex with PA, similar to what is often observed in SPR measurements with small molecule analytes or peptides [17].
To attempt to decrease the complex dissociation and
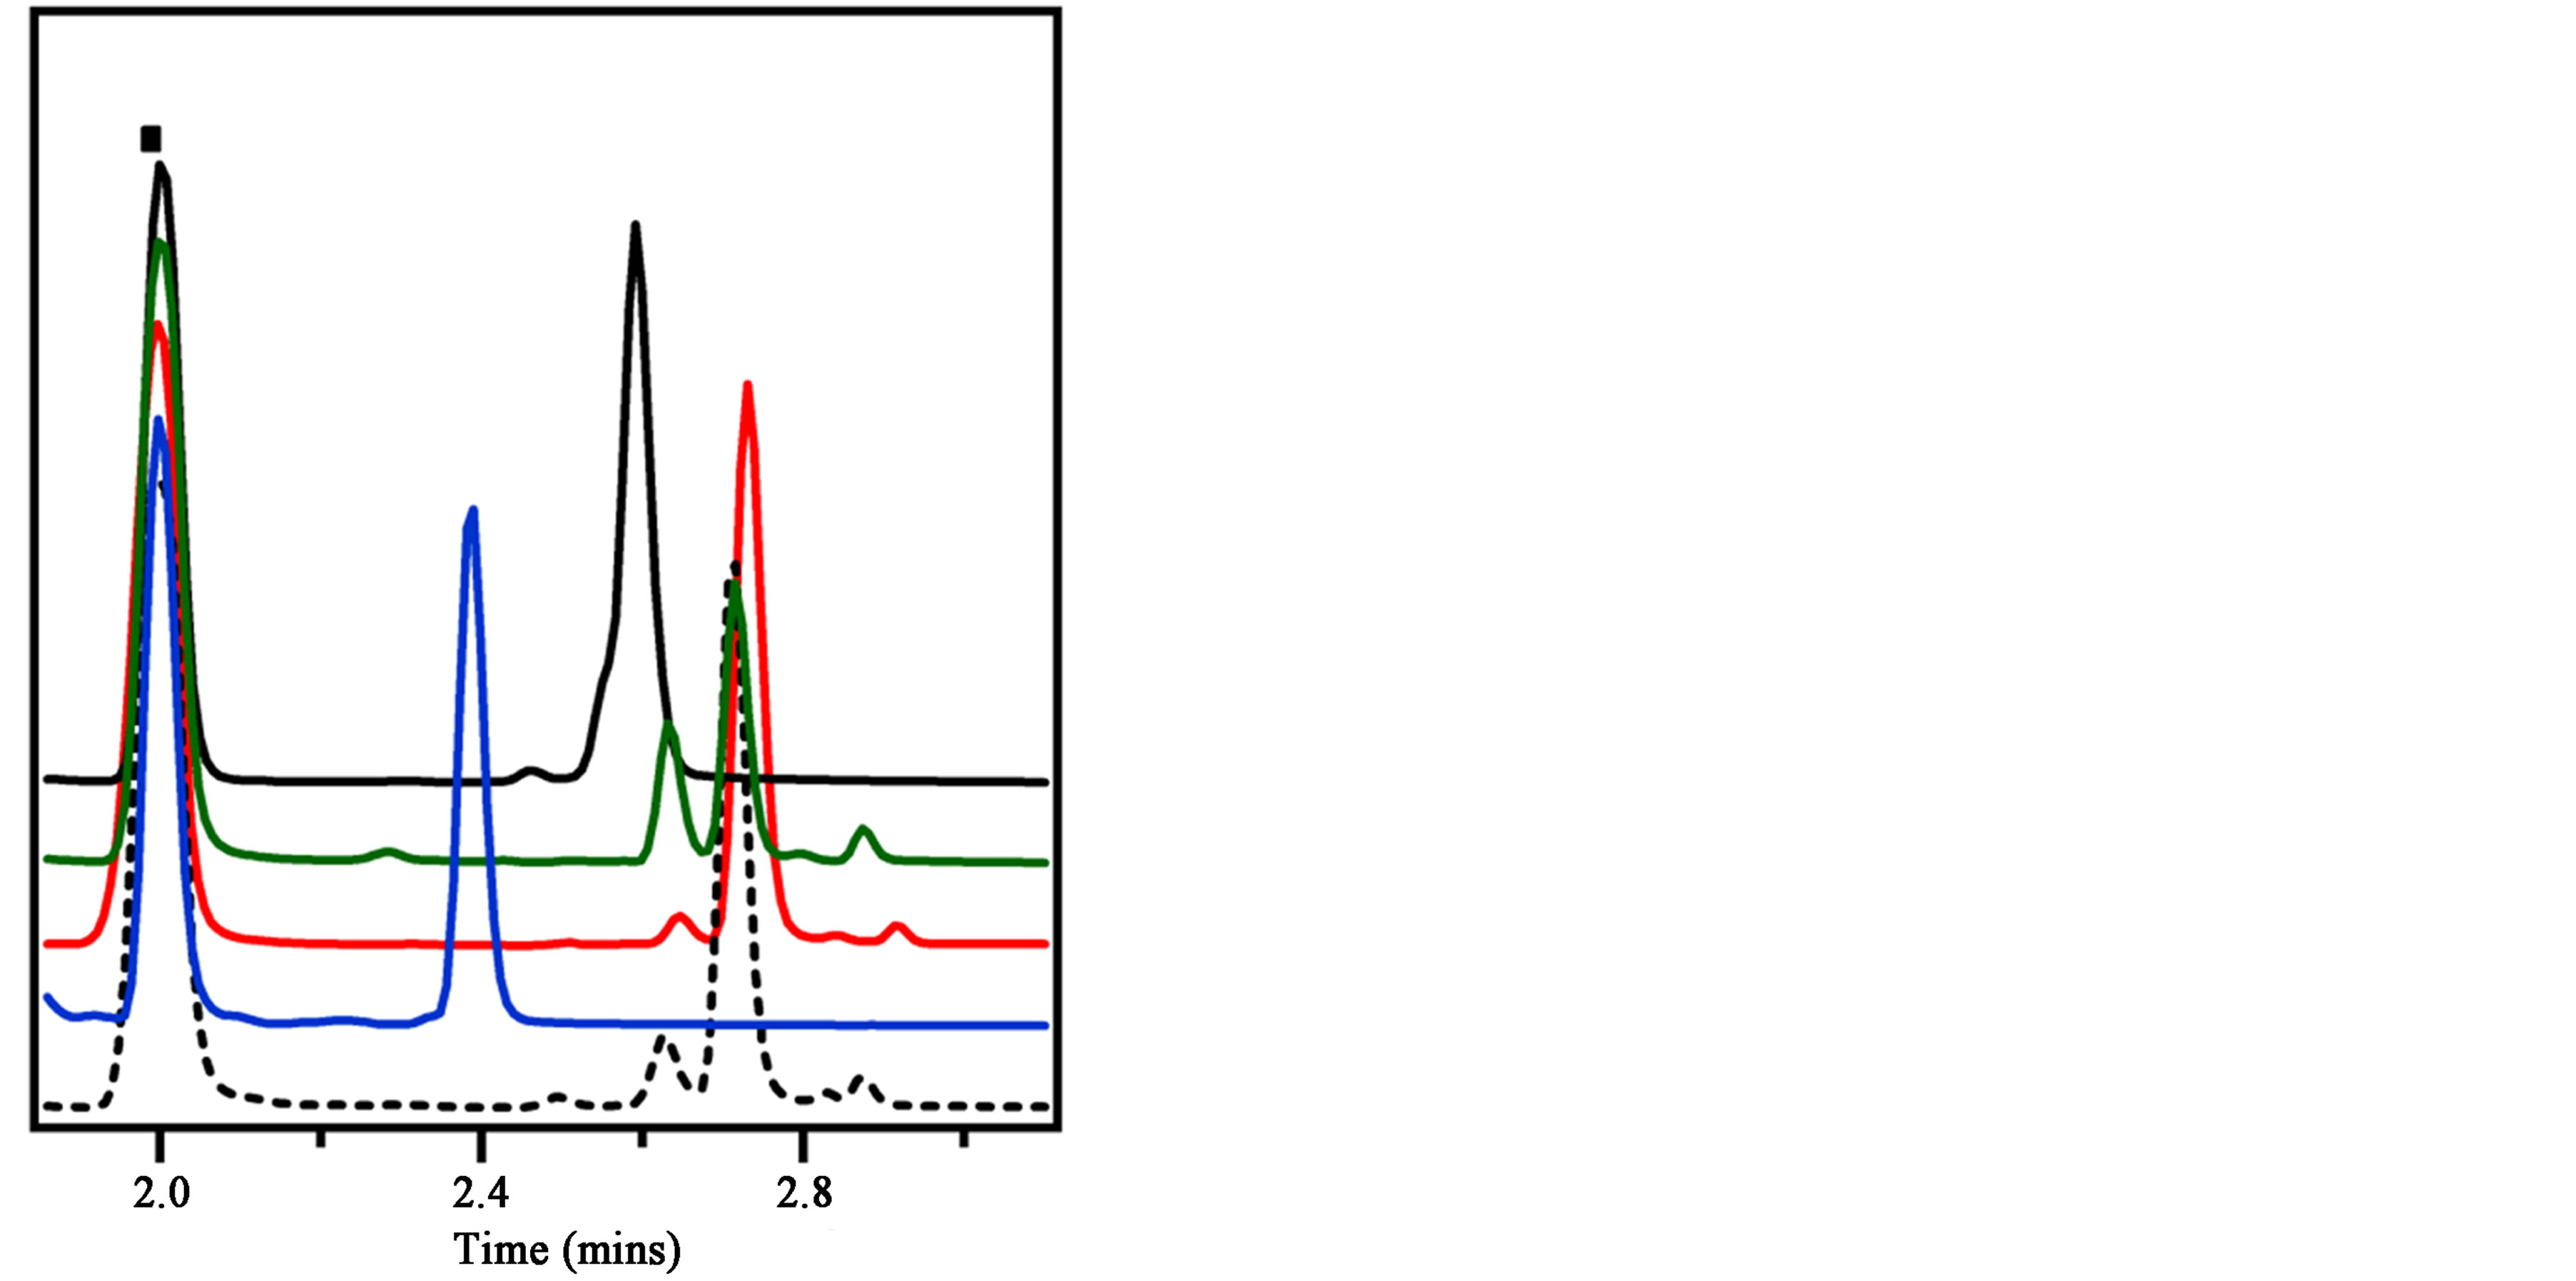
Figure 1. CE rapid specificity analysis of αPAFITC (dash) with a positive control PA (blue), BSA (red), HRP (green), and a mouse mAb (black). The PA shows the greatest mobility shift, the mAb shows less of a mobility shift, and both the BSA and HRP show no mobility shift difference compared to the αPAFITC alone. Each sample is normalized to the fluorescein internal mobility standard (square).
 (a)
(a)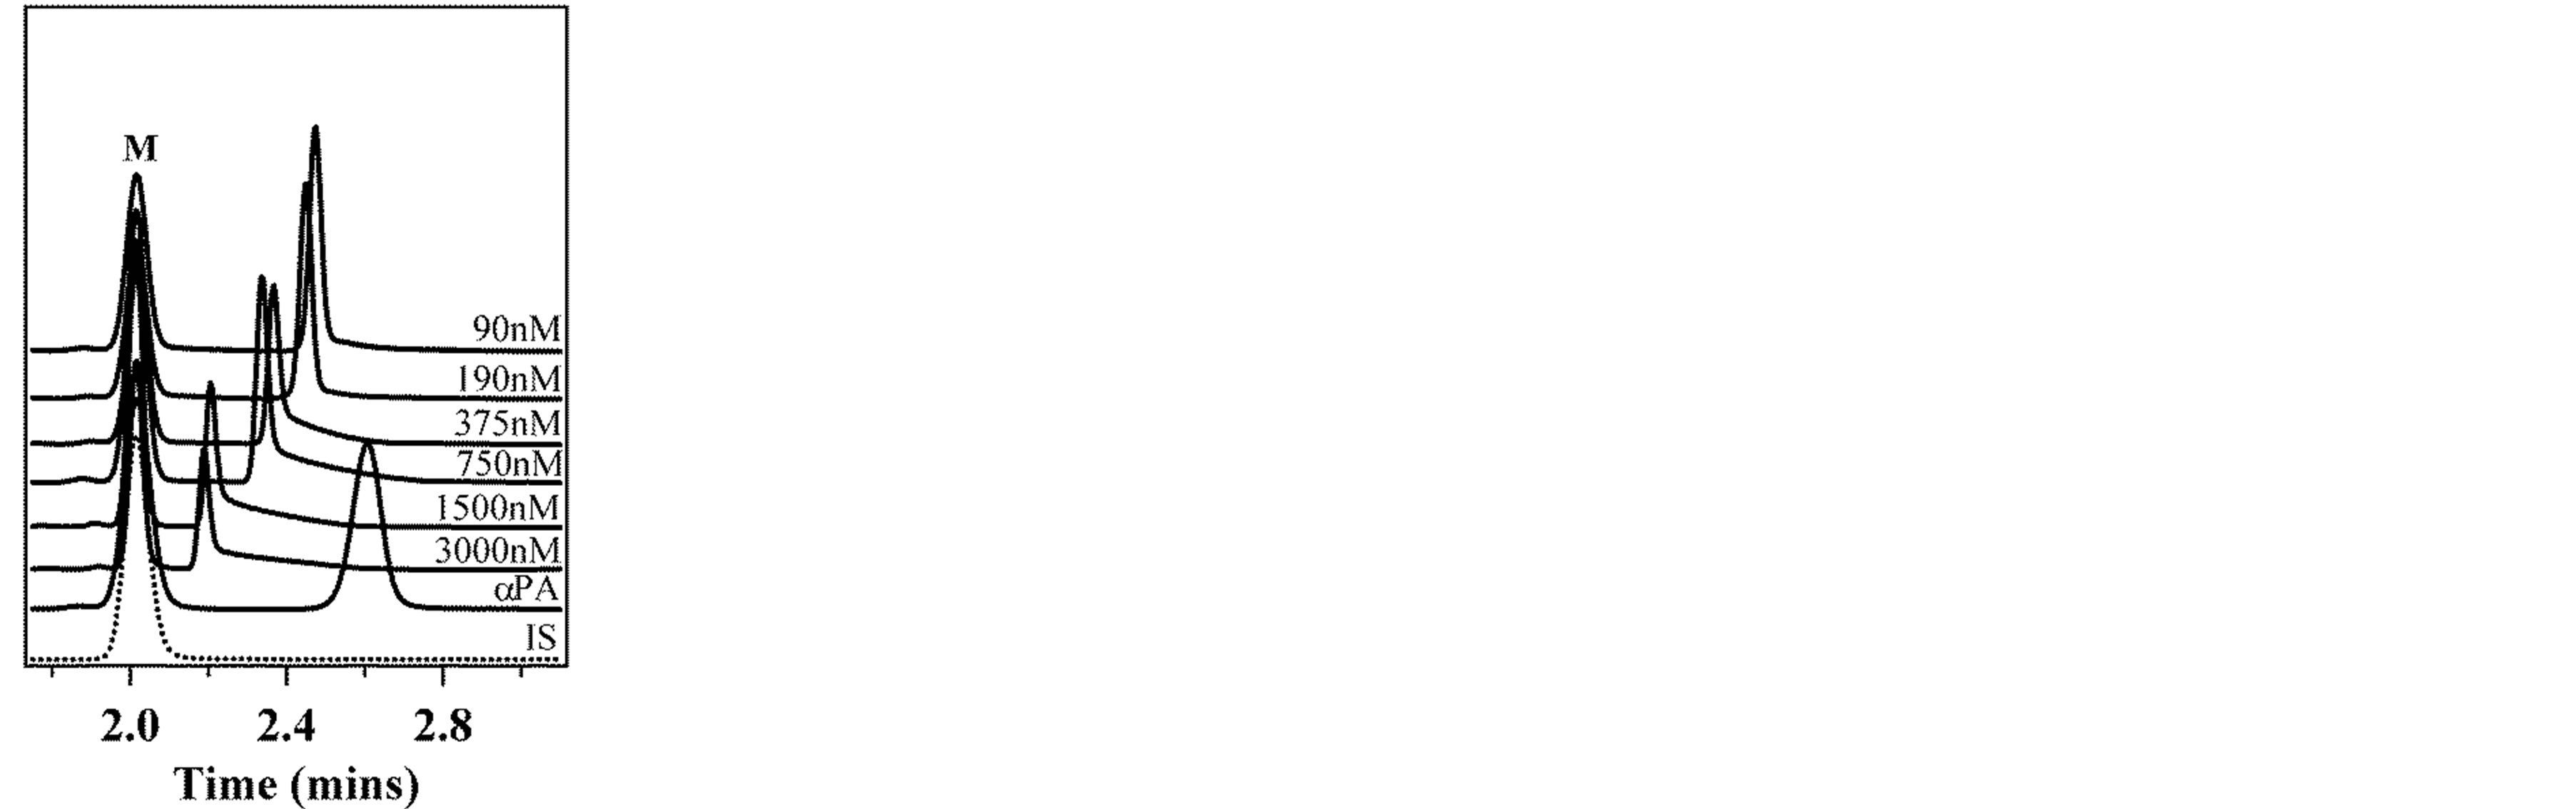 (b)
(b)
Figure 2. ACE measurements of PA and αPAFITC peptide at (a) 10 kV and (b) 20 kV. The resultant αPAFITC mobility shift is shown at each PA concentration tested, referenced to the internal electro-osmotic flow standard (“M”).
observe free and bound complex, the samples were run at 20 kV under nonequilibrium conditions. At 20 kV under nonequilibrium conditions, the maximum mobility shift of the αPAFITC with 3000 nM PA (saturation) is 30 s (Figure 2(b)). Increasing the current and thereby decreasing the separation time did not change the outcome of the measurement; the (αPA)PA complex did not completely dissociate to a measurable bound vs. unbound sample ratio, typical of NECEEM.
3.3. αPA Binding Affinity to PA
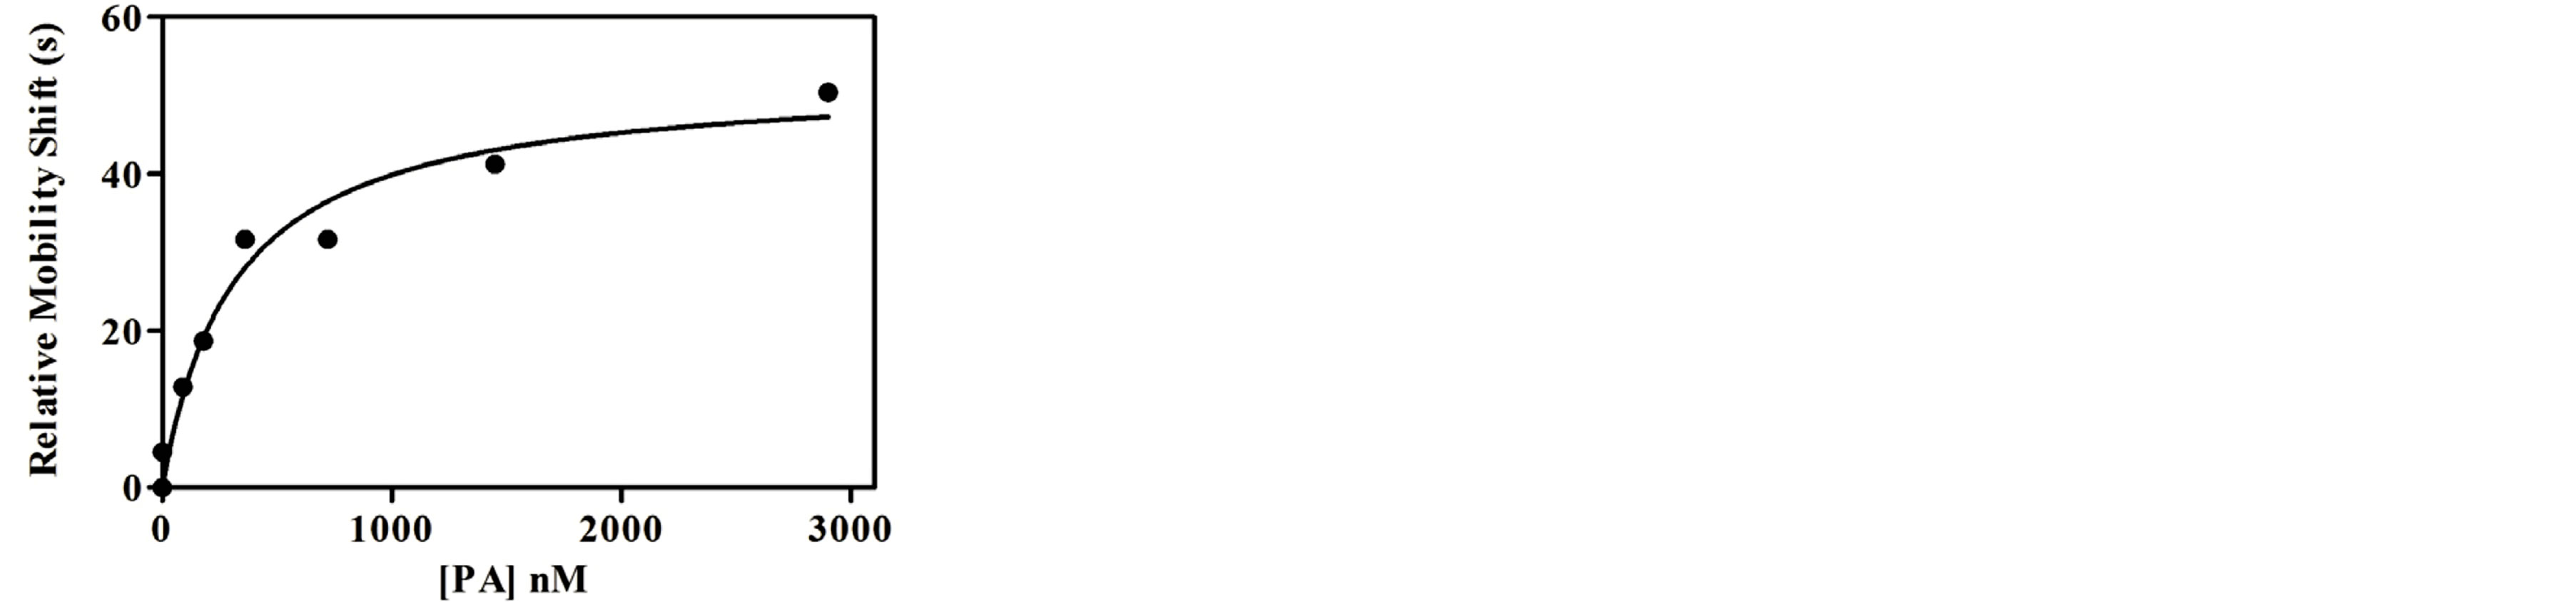
In the absence of a dissociated peak at nonequilibrium, typical NECEEM sample analysis was not possible; one benefit of NECEEM for Kd measurements is that single concentrations of target and analyte are required since the dissociation constant is calculated using the ratio of areas for bound and unbound portions. For the αPA binding to PA, the absence of an unbound αPAFITC peak during nonequilibrium conditions necessitated using relative mobility shift with varying PA concentrations to calculate the peptide-protein binding constant Kb. The relative mobility shift compared to the internal fluorescein mobility standard for the 10 kV equilibrium (Figure 3(a)) and the 20 kV (Figure 3(b)) was fit to Equation (1), nonlinearly, to determine the binding constant (Kb) and dissociation constant (Kd = 1/Kb). The calculated Kb and Kd are within a factor of 2 for the 10 kV and 20 kV samples, 312 and 177 nM respectively.
4. CONCLUSION
The emergence of peptide biosensor reagents requires a rapid, solution-based alternative to surface-bound immunoassays to evaluate peptide affinity and specificity. CE can be used to rapidly determine peptide affinity and peptide specificity, which is a critical component when using peptide reagents in place of antibodies for detection and sensing. The αPA peptide showed strong specificity for PA with little cross-reactivity to the anti-PA
 (a)
(a)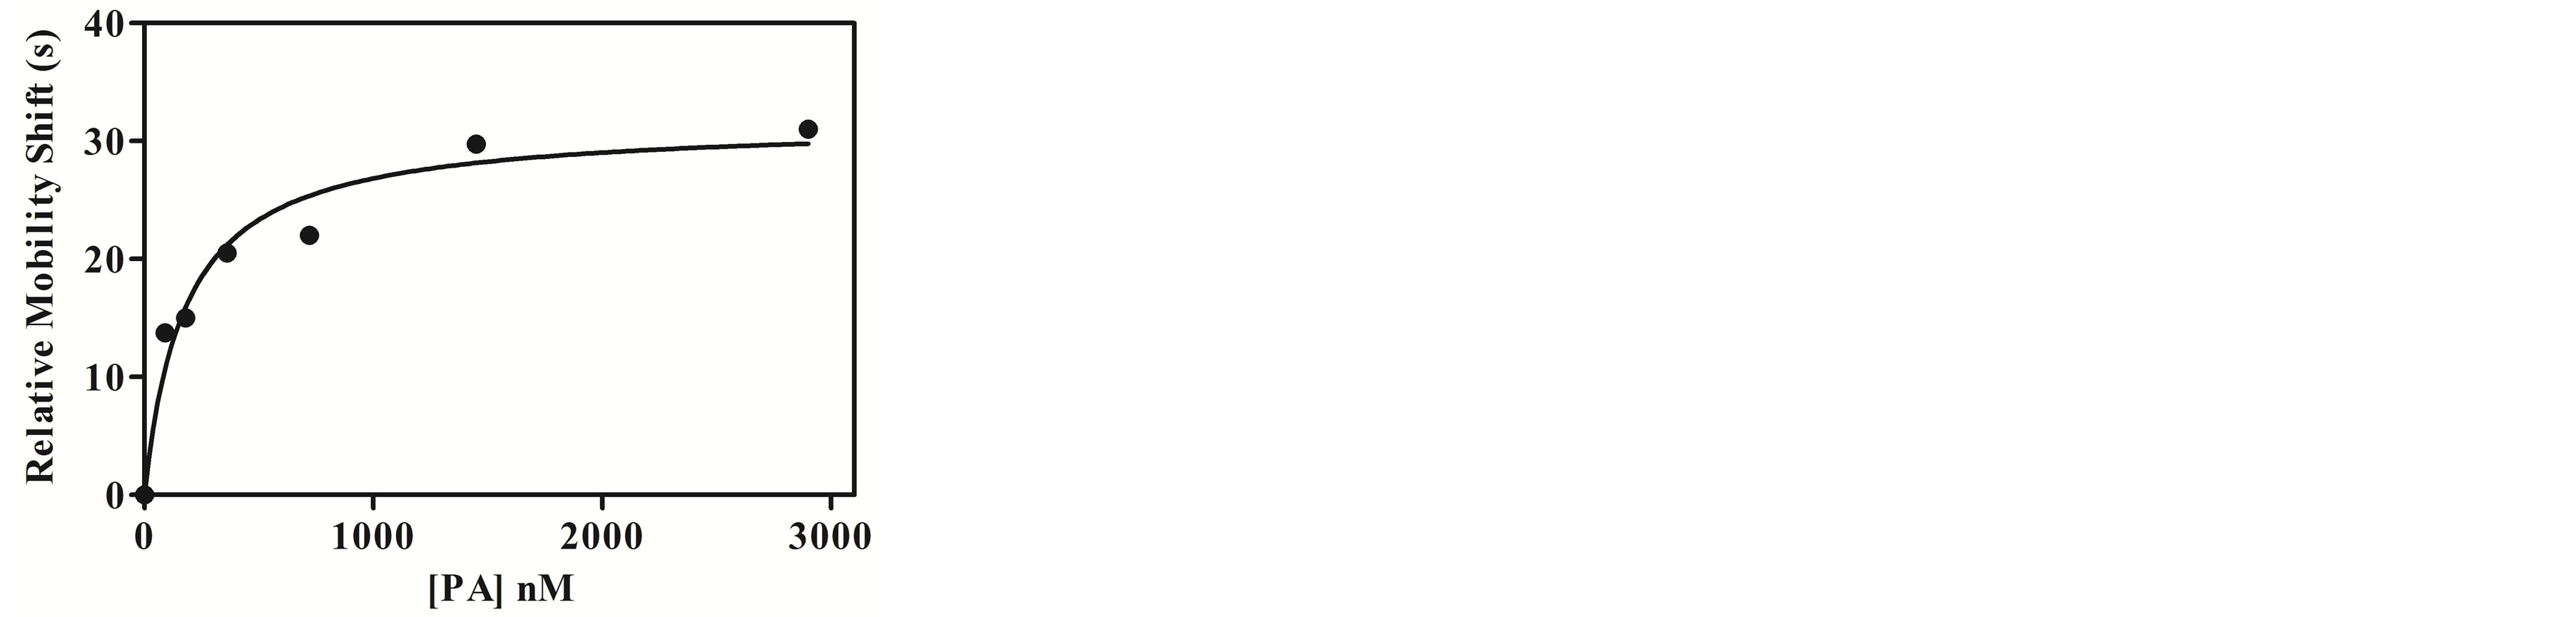 (b)
(b)
Figure 3. Binding affinity analysis for Kb and Kd determination of the αPAFITC peptide with various concentrations of PA protein at (a) 10 kV and (b) at 20 kV. The data was fit to a nonlinear function using Equation (1).
mAb and no binding to BSA or HRP. CE is a versatile, automatable method to determine binding affinity for peptide-protein interactions as presented in this study. In the absence of a dissociated αPAFITC peak, typical NECEEM analysis could not be used necessitating determination of the binding constant (Kb) from the relative mobility differences at various PA concentrations. For CE and other microfluidic biosensor techniques, the relative mobility shift of the dye-labeled peptide with and without target is suitable for quantitative analysis or for adaptation for qualitative sample analysis in a sensor format. This peptide-protein CE characterization is suited for peptide affinity characterization, incorporation of dyelabeled peptides into portable microfluidic devices, or other solution-based optical sensors capable of measuring changes in the peptides mass, charge, or structure. ACE with peptides isolated from bacterial display libraries provides a rapid method to determine off-cell specificity and affinity and revealed the rapid binding-rebinding kinetics of this αPA peptide at nonequilibrium. This study shows the suitability of peptides as sensing reagents for CE, similar to previous reports that have used nucleic acid aptamers in a CE biosensor. Current efforts include adapting the αPA peptide into a nanofludic platform for more rapid binding analysis and decreased sample volumes.
ACKNOWLEDGEMENTS
The work was supported in part by support from the Defense Threat Reduction Agency-Joint Science and Technology Office for Chemical and Biological Defense (Grant no. BRCALL08-Per3-P-2-0028).
REFERENCES
- Zhou, B., Carney, C. and Janda, K.D. (2008) Selection and characterization of human antibodies neutralizing Bacillus anthracis toxin. Bioorganic & Medicinal Chemistry, 16, 1903-1913. http://dx.doi.org/10.1016/j.bmc.2007.11.001
- Yang, P., Ma, Y., Lee, A.W.M. and Kennedy, R.T. (2009) Measurement of dissociation rate of biomolecular complexes using CE. Electrophoresis, 30, 457-464. http://dx.doi.org/10.1002/elps.200800397
- Sooter, L.J., McMasters, S. and Stratis-Cullum, D.N. (2007) Application of capillary electrophoresis to the development and evaluation of aptamer affinity probes— Art. No. 67590T. In: Cullum, B.M. and Porterfield, D.M., Eds., Smart Biomedical and Physiological Sensor Technology V, SPIE, Bellingham, T7590-T7590.
- Nguyen, T., Hilton, J.P. and Lin, Q. (2009) Emerging applications of aptamers to microand nanoscale biosensing. Microfluidics and Nanofluidics, 6, 347-362. http://dx.doi.org/10.1007/s10404-008-0400-7
- Stratis-Cullum, D.N., McMasters, S. and Pellegrino, P.M. (2009) Evaluation of relative aptamer binding to campylobacter jejuni bacteria using affinity probe capillary electrophoresis. Analytical Letters, 42, 2389-2402. http://dx.doi.org/10.1080/00032710903137376
- Bossi, A., Castelletti, L., Piletsky, S.A., Turner, A.P.F. and Righetti, P.G. (2003) Towards the development of an integrated capillary electrophoresis optical biosensor. Electrophoresis, 24, 3356-3363. http://dx.doi.org/10.1002/elps.200305588
- Liu, R.W., Enstrom, A.M. and Lam, K.S. (2003) Combinatorial peptide library methods for immunobiology research. Experimental Hematology, 31, 11-30. http://dx.doi.org/10.1016/S0301-472X(02)01008-1
- Boder, E.T. and Wittrup, K.D. (1997) Yeast surface display for screening combinatorial polypeptide libraries. Nature Biotechnology, 15, 553-557. http://dx.doi.org/10.1038/nbt0697-553
- Daugherty, P.S. (2007) Protein engineering with bacterial display. Current Opinion in Structural Biology, 17, 474- 480. http://dx.doi.org/10.1016/j.sbi.2007.07.004
- Lee, S.Y., Choi, J.H. and Xu, Z.H. (2003) Microbial cell-surface display. Trends in Biotechnology, 21, 45-52. http://dx.doi.org/10.1016/S0167-7799(02)00006-9
- Rice, J.J., Schohn, A., Bessette, P.H., Boulware, K.T. and Daugherty, P.S. (2006) Bacterial display using circularly permuted outer membrane protein OmpX yields high affinity peptide ligands. Protein Science, 15, 825-836. http://dx.doi.org/10.1110/ps.051897806
- Getz, J.A., Rice, J.J. and Daugherty, P.S. (2011) Protease-resistant peptide ligands from a knottin scaffold library. ACS Chemical Biology, 6, 837-844. http://dx.doi.org/10.1021/cb200039s
- VanAntwerp, J.J. and Wittrup, K.D. (2000) Fine affinity discrimination by yeast surface display and flow cytometry. Biotechnology Progress, 16, 31-37. http://dx.doi.org/10.1021/bp990133s
- Daugherty, P.S., Iverson, B.L. and Georgiou, G. (2000) Flow cytometric screening of cell-based libraries. Journal of Immunological Methods, 243, 211-227. http://dx.doi.org/10.1016/S0022-1759(00)00236-2
- Kenrick, S.A. and Daugherty, P.S. (2010) Bacterial display enables efficient and quantitative peptide affinity maturation. Protein Engineering Design & Selection, 23, 9-17. http://dx.doi.org/10.1093/protein/gzp065
- Hall, S.S. and Daugherty, P.S. (2009) Quantitative specificity-based display library screening identifies determinants of antibody-epitope binding specificity. Protein Science, 18, 1926-1934. http://dx.doi.org/10.1002/pro.203
- Gomes, P. and Andreu, D. (2002) Direct kinetic assay of interactions between small peptides and immobilized antibodies using a surface plasmon resonance biosensor. Journal of Immunological Methods, 259, 217-230. http://dx.doi.org/10.1016/S0022-1759(01)00503-8
- Katsamba, P.S., Park, S. and Laird-Offringa, I.A. (2002) Kinetic studies of RNA-protein interactions using surface plasmon resonance. Methods, 26, 95-104.
- Rich, R.L., Cannon, M.J., Jenkins, J., Pandian, P., Sundaram, S., Magyar, R., Brockman, J., Lambert, J. and Myszka, D.G. (2008) Extracting kinetic rate constants from surface plasmon resonance array systems. Analytical Biochemistry, 373, 112-120. http://dx.doi.org/10.1016/j.ab.2007.08.017
- Peter, J.C., Briand, J.P. and Hoebeke, J. (2003) How biotinylation can interfere with recognition: A surface plasmon resonance study of peptide-antibody interactions. Journal of Immunological Methods, 274, 149-158. http://dx.doi.org/10.1016/S0022-1759(02)00517-3
- Kogot, J.M., Sarkes, D.A., Val-Addo, I., Pellegrino, P.M. and Stratis-Cullum, D.N. (2012) Increased affinity and solubility of peptides used for direct peptide ELISA on polystyrene surfaces through fusion with a polystyrenebinding peptide tag. BioTechniques, 52, 95-102. http://dx.doi.org/10.2144/000113810
- Abdiche, Y., Malashock, D., Pinkerton, A. and Pons, J. (2008) Determining kinetics and affinities of protein interactions using a parallel real-time label-free biosensor, the Octet. Analytical Biochemistry, 377, 209-217. http://dx.doi.org/10.1016/j.ab.2008.03.035
- Vadim, O., Ernst, K. and Affinity Capillary Electrophoresis. (2003) Electrokinetic Phenomena, CRC Press, Boca Raton.
- Kogot, J.M., Zhang, Y., Moore, S.J., Pagano, P., StratisCullum, D.N., Chang-Yen, D., Turewicz, M., Pellegrino, P.M., de Fusco, A., Soh, H.T. and Stagliano, N.E. (2011) Screening of peptide libraries against protective antigen of Bacillus anthracis in a disposable microfluidic cartridge. PLoS One, 6, E26925. http://dx.doi.org/10.1371/journal.pone.0026925
- Rice, J.J. and Daugherty, P.S. (2008) Directed evolution of a biterminal bacterial display scaffold enhances the display of diverse peptides. Protein Engineering Design & Selection, 21, 435-442. http://dx.doi.org/10.1093/protein/gzn020
- Jiang, C.X. and Armstrong, D.W. (2010) Use of CE for the determination of binding constants. Electrophoresis, 31, 17-27. http://dx.doi.org/10.1002/elps.200900528
- Stratis-Cullum, D.N., Kogot, J.M., Sarkes, D.A., ValAddo, I. and Pellegrino, P.M. (2011) Bacterial display peptides for use in biosensing applications. In: L.D. Pramatarova, Ed., On Biomimetics, InTech.
- Berezovski, M., Drabovich, A., Krylova, S.M., Musheev, M., Okhonin, V., Petrov, A. and Krylov, S.N. (2005) Nonequilibrium capillary electrophoresis of equilibrium mixtures: A universal tool for development of aptamers. Journal of the American Chemical Society, 127, 3165-3171. http://dx.doi.org/10.1021/ja042394q
- Berezovski, M. and Krylov, S.N. (2002) Nonequilibrium capillary electrophoresis of equilibrium mixtures—A single experiment reveals equilibrium and kinetic parameters of protein-DNA interactions. Journal of the American Chemical Society, 124, 13674-5.
- Berezovski, M., Nutiu, R., Li, Y.F. and Krylov, S.N. (2003) Affinity analysis of a protein-aptamer complex using nonequilibrium capillary electrophoresis of equilibrium mixtures. Analytical Chemistry, 75, 1382-1386. http://dx.doi.org/10.1021/ac026214b
- Krylov, S.N. and Berezovski, M. (2003) Non-equilibrium capillary electrophoresis of equilibrium mixtures—Appreciation of kinetics in capillary electrophoresis. Analyst, 128, 571-575. http://dx.doi.org/10.1039/b212913b
NOTES
*Corresponding author.