Advances in Bioscience and Biotechnology
Vol.3 No.3(2012), Article ID:20001,4 pages DOI:10.4236/abb.2012.33031
Protein quantitation using dyes obtained from plant materials
![]()
Department of Biochemistry, Obafemi Awolowo University, Ile-Ife, Nigeria
Email: *olusanjo2002@yahoo.co.uk
Received 14 February 2012; revised 23 March 2012; accepted 5 April 2012
Keywords: Protein Quantitation; Plant Dyes; Ethanolic Extract; Sensitivity
ABSTRACT
We present a preliminary report on the use of plant dyes in the quantitation of proteins in solution. We have used ethanol, acid, alkali and water to extract dyes from some plant materials, including flowers of Jungle flame (Izora coccinea), China rose (Hibiscus rosa-sinensis) and leaves of West African Indigo (Lonchocarpus cyanescens), Mimosa (Mimosa pudica), Roselle (Hibiscus sabdarifa), Jatropha (Jatropha curcas) and Henna (Lawsonia inermis). The dyes obtained were used in the protein-dye binding studies. The colour of the protein-dye complex of the ethanolic extracts was stable and increased linearly with increase in protein concentration. The extracts achieved linearity up to the following amount of proteins in the test samples: Hibiscus rosa-sinensis (60 (g), Ixora coccinea (120 (g), Hibiscus sabdarifa (80 - 100 (g), Jatropha curcas (80 (g), and Lawsonia inermis (100 (g). The sensitivity of the dyes especially at low protein concentrations indicate that they can provide suitable alternatives to other well known standard methods of protein determination.
1. INTRODUCTION
There are currently many methods to quantify proteins in solution. Some are quite insensitive and can detect proteins only in the milligram range, whereas others are very sensitive and can be used to measure proteins as low as 5 - 10 mg in solution. Among the least sensitive is the biuret method of Gornall et al. [1]. Apart from the insensitivity, other main disadvantages of this method in protein measurements are that the presence of salts e.g. (NH4)2SO4 carry over, or other substances which might be present in protein solution (e.g. detergents, chaotropic agents) affect colour development and hence the overall result of protein concentration obtained.
Protein quantitation using Folin-phenol reagent [2], can detect protein in solution at concentrations as low as 5 - 10 mg. Again, it suffers from the fact that many reagents such as amino acid, nucleic acids, detergents etc. interfere with its reaction. The reaction is pH dependent and as such protein solution that contains some of the materials mentioned, cannot be correctly measured. Moreover, protein solutions with fewer aromatic amino acids would have a lowered absorbance and the method appears relatively cumbersome.
Bradford method [3] provides a more straight forward approach, in addition to its sensitivity. Bradford employs coomassie brilliant blue G-250 in acidic medium which binds with proteins, primarily to basic amino acids present in the proteins, to give a blue coloration. The main disadvantage of the Bradford method is that, when used in the presence of surfactants at concentrations normally used to get some proteins solubilised, the results obtained are unreliable. This applies essentially to membrane proteins. Differences in results arising from protein-protein variability have also been reported in some cases.
The methods of bicinchoninic acid (BCA) and Pierce 660 nm protein assay [4,5] are based on protein-metaldye-binding assay. Again, users who have relied on these methods have brought to the fore, some problems associated with this procedure [6]. Some of the reported problems include the fact that reaction never really reaches equilibrium, in a reasonable time. It was also reported that the presence of catecholamines, tryptophan, lipids, phenol red, cysteine, tyrosine, glycerol etc disrupts colour development.
Finally, UV absorbance can be used to quantitate proteins in solution, especially if the solution is homogeneous and contains only proteins without any interfering substances such as nucleic acid [7]. Arising from the above-mentioned facts, it is necessary to have a repertoire of reagents suitable for different applications. We have therefore screened some plants and present our first communication on the possibility that phytochemicals may serve as good alternatives in protein determination under some conditions. Siva [8] has enumerated the diverse uses of plant resources and the method described in this study will further enrich this diversity.
2. MATERIALS AND METHODS
2.1. Plant Source
All plant materials used were fresh and were collected from the wild within the Obafemi Awolowo University environ and were identified by Dr. Oloyede of the Department of Botany. Some of the plants had been planted for ornamental purposes.
Chemicals: Ethanol, Bovine Serum Albumin (BSA), HCl, NaOH and Na2CO3 were obtained from Sigma Chemical Company. All other reagents were of analytical grade that were commercially available.
2.2. Dye Extraction from the Plant Materials
Three principal methods were adopted with some variations for individual materials and are as follows:
1) Aqueous method About 5 g of the plant materials (already macerated) were soaked in 100 ml of distilled water and boiled for about 5 min. The solution was allowed to cool and then filtered to obtain a clear solution.
2) Alkaline/acidic method In the use of alkaline and acid solution as medium for dye extraction, the distilled water was replaced with 1% alkaline solution prepared with Na2CO3/NaOH or 1% HCl. Heating or boiling was usually omitted if the dye could diffuse from the respective plants without heating.
3) Ethanol method Five grams (5 g) of the macerated materials were soaked in about 60 ml of absolute ethanol for 15 min. The dye produced was thereafter filtered off.
2.3. Absorption Spectral Measurement
The extracts were appropriately diluted with the respective solvents originally used for their extraction and absorption was measured between 400 to 700 nm in a Unicam UV-Visible Spectrophotometer. Absorption maxima and the corresponding wavelength for each of the dyes was noted. In a related experiment, the dye solution of a known volume was mixed with a stock solution (100 mg/ml) of BSA and the measurement was repeated.
2.4. Protein Measurement Using Extracted Plant Dyes
Stock bovine serum albumin solution was prepared at a concentration of 100 mg/ml. The stock was pipetted into a set of test tubes to achieve between 10 to 100 mg of protein per tube. Tube l served as the control with distilled water in place of the protein. Two milliliters (2 ml) of the plant dye was introduced into each tube and distilled water was added to achieve equal volumes in all tubes. The mixture was shaken and the absorbance was measured at a wavelength where the protein-dye mixture had the maximum absorbance.
3. RESULTS AND DISCUSSION
3.1. Dye Extraction
In the preliminary screening experiments, absolute ethanol was found suitable for the extraction of dyes from spinach leaves, jungle flame and hibiscus flowers. However, it was not suitable for the extraction of dyes from onion scale and mimosa flower. Aqueous solution of HCl was suitable, only for jungle flame flower and spinach leaves whereas alkaline condition is most suitable for onion scale and mimosa flower. More dyes can be extracted from spinach leaves only after boiling for 15 min.
With minor variations in some cases, all the solvents were effective, though with application of heat (for aqueous solutions), in the extraction of dyes from the leaves of Alstonia boonei, Hibiscus sabdarifa, Jatropha curcas, Lawsonia inermis and Tectona grandis. The colour and therefore the phytochemical constituents, were not the same for the extract obtained from a plant material following different methods of dye extraction.
3.2. Light Absorption Properties
As noted earlier, the solvents of extraction had an effect on the absorbances of the different dyes and also on the wavelength of their maximal absorbance (lmax). Table 1 is a summary of the lmax and the respective absorbance of some of the plant materials extracted with different solvents within the visible region of the spectrum.
Leave extracts of Alstonia boonei, Hibiscus sabdarifa, Jatropha curcas, Lawsonia inermis and Tectona grandis had λmax of 664, 662, 486, 516, 560 nm respectively.
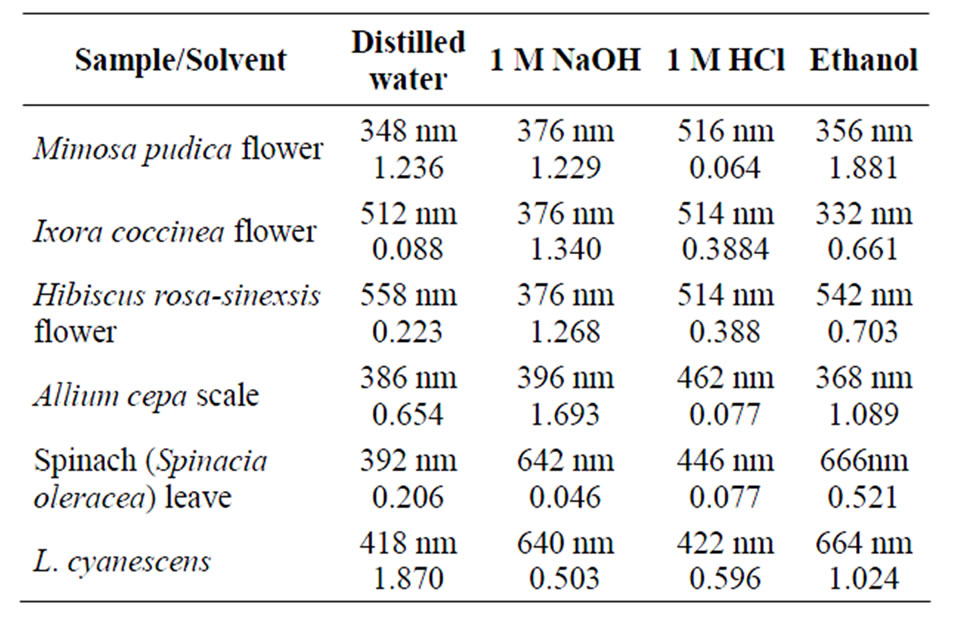
Table 1. λmax and the corresponding absorbance for some extracts in different solvents.
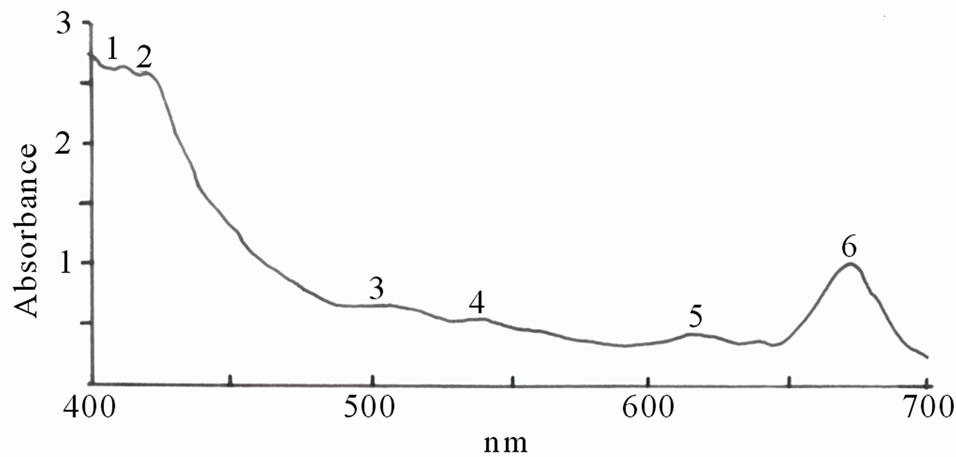
Figures 1(a)-(e) are the spectra recorded for some of the dyes. Extracts with high absorbance were diluted with the respective solvents used for the extraction.
Dyes extracted with aqueous solutions of acid or alkali or with only distilled water could present a challenge due to microbial growth and the rapid oxidation of the phytochemicals. To avoid the temporary challenge that these conditions could pose, ethanolic extract of the dyes were chosen for further analysis.
To check whether lmax will remain the same on protein binding, an aliquot of BSA solution (100 μg/ml) was mixed with a fixed volume of the dye and diluted with distilled water to achieve a uniform volume for each of the extracts. lmax shifted slightly from the values reported in Figure 1, but still within the visible region. This lmax was chosen as the wavelength of maximum absorption for protein determination.
3.3. Protein Concentration Measurement
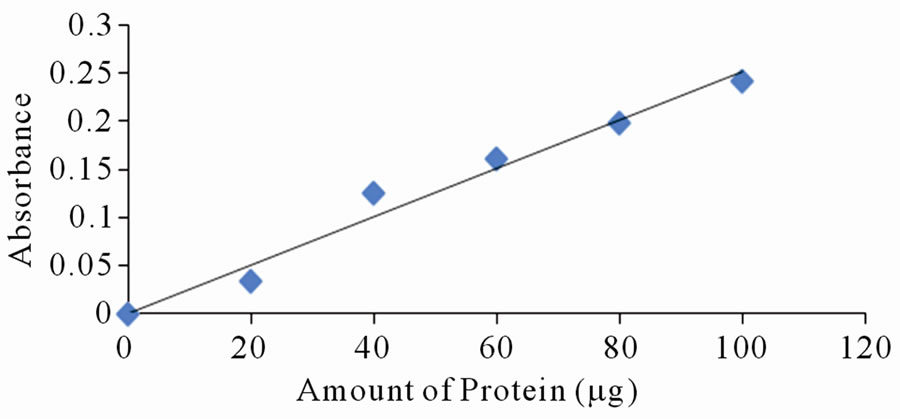
Each of the selected extracts was mixed with aliquots of BSA, with amount of protein varying between 10 to 120 mg per tube. Distilled water was used to make the volumes equal. Absorbance reading was taken at lmax of the respective dyes. Only a few of the selected dyes showed linearity in absorbance with increase in amount of protein. Figures 2(a)-(d) are a plot of absorbance against amount of protein for some of the extracts that show linearity.
 (a)
(a)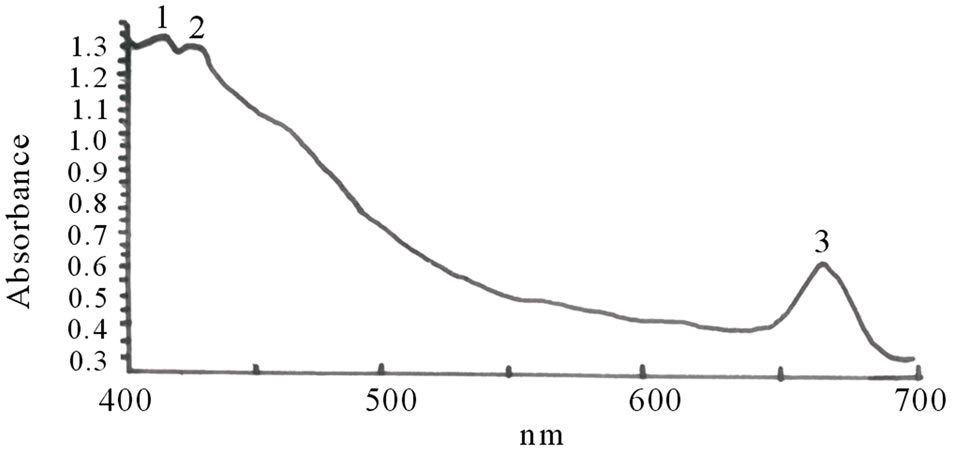 (b)
(b)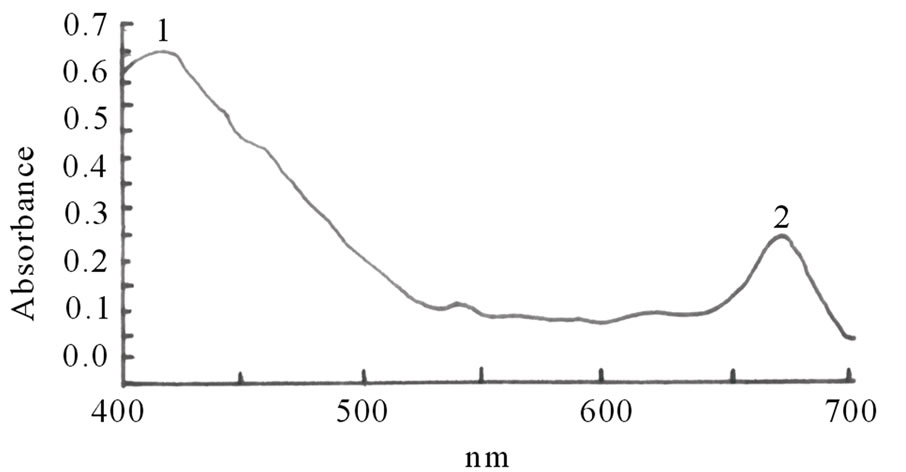 (c)
(c)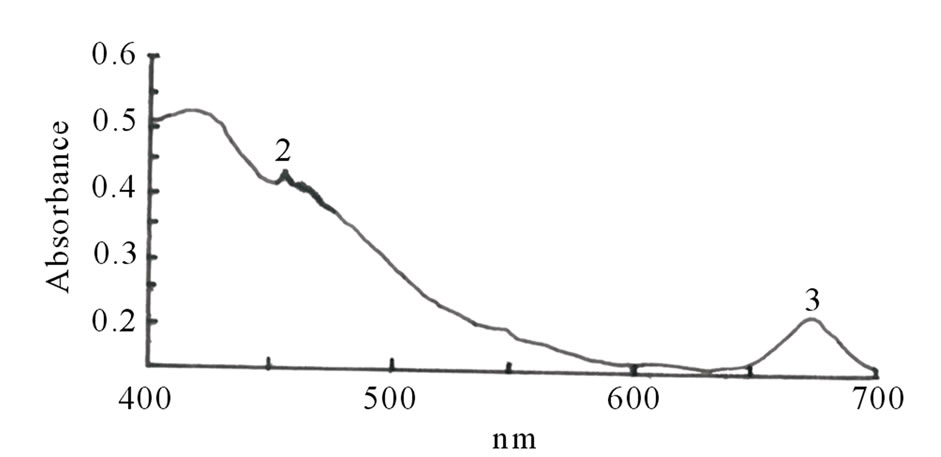 (d)
(d)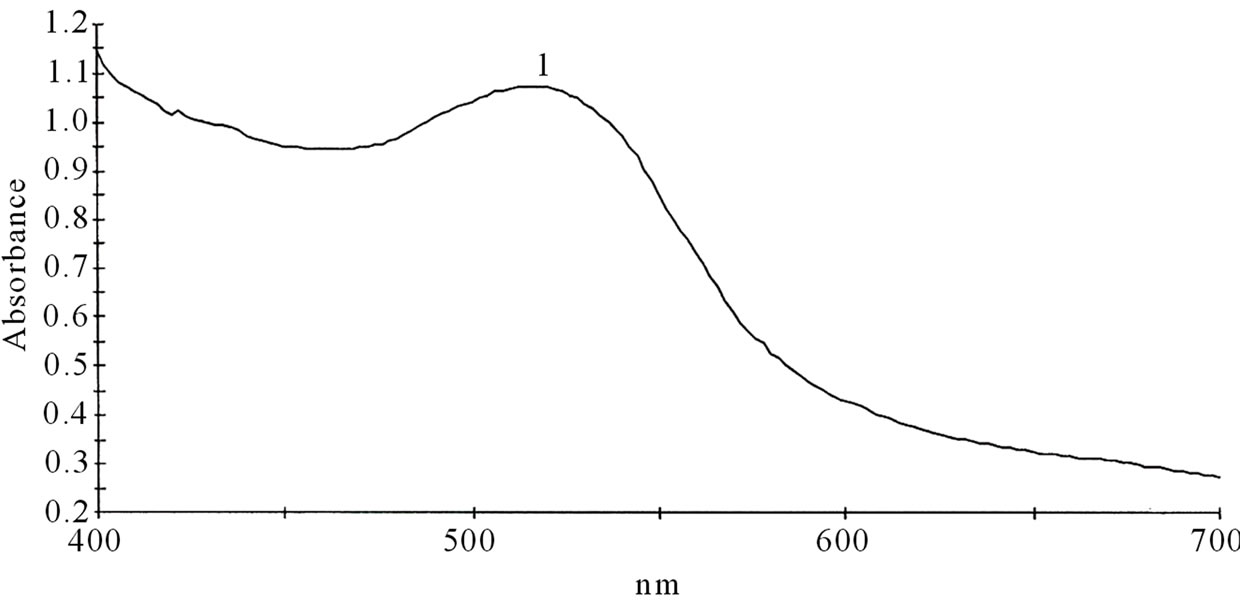 (e)
(e)
Figure 1. Spectra properties of some plant dyes. (a) Ethanolic extract of leaves of Lonchocarpus cyanescens; (b) Ethanolic extract of leaves of Alstonia boonei; (c) Ethanolic extract of leaves of Jatropha curcas; (d) Ethanolic extract of leaves of Hibiscus sabdarifa; and (e) Ethanolic extract of Ixora coccinea flower. Scanning was done in a Unicam UV-Visible Spectrophotometer between 400 - 700 nm.
 (a)
(a)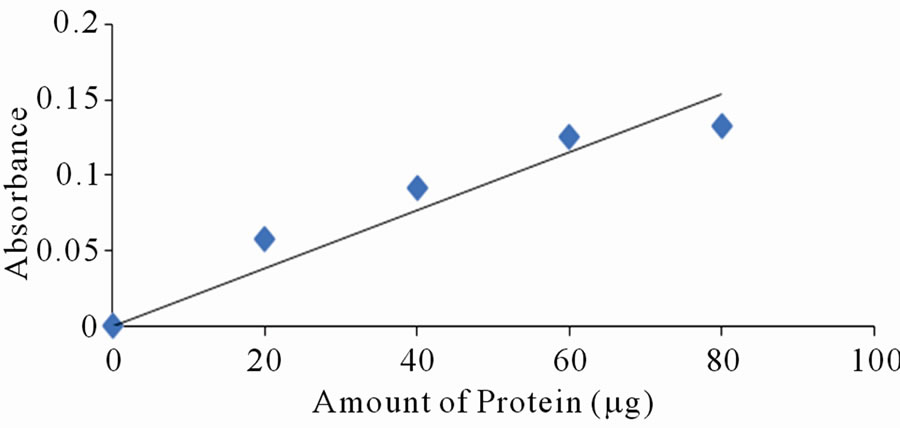 (b)
(b)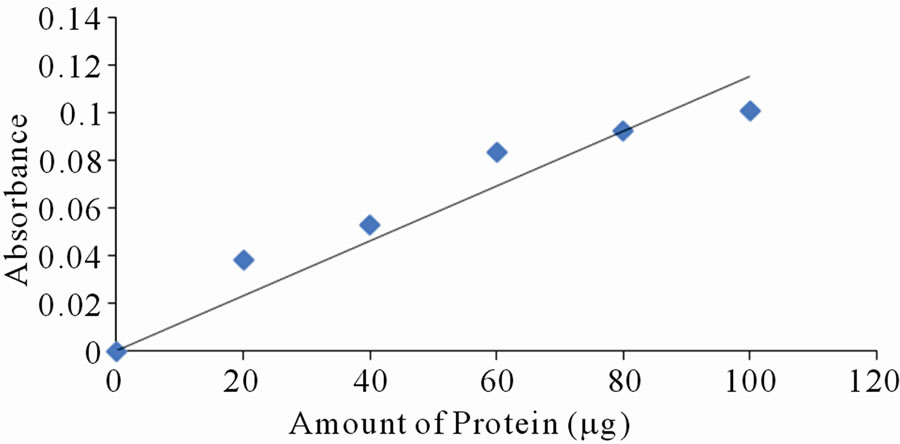 (c)
(c)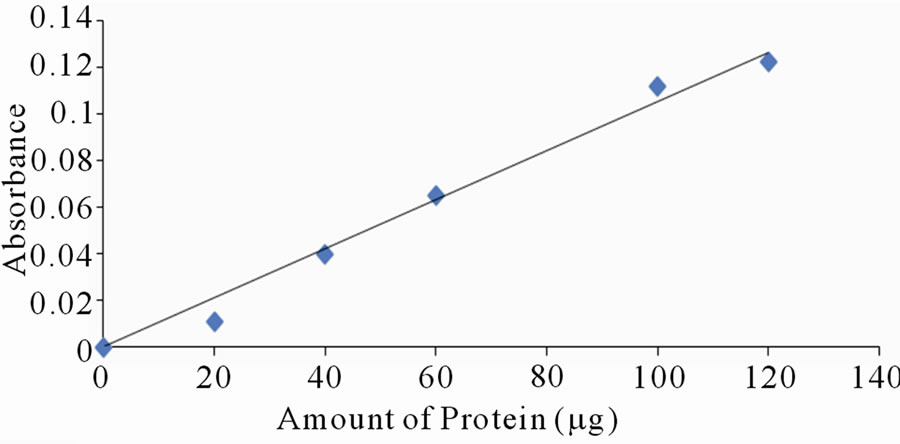 (d)
(d)
Figure 2. Standard curves for protein measurement with dyes from: (a) Ethanolic extract of leaves of Lawsonia inermis; (b) Jatropha curcas; (c) Hibiscus sabdarifa and (d) Flowers of Ixora coccinea. The standard protein was bovine serum albumin and absorbance of the colour formed as a result of protein-dye complex was read at 516, 486, 662 and 514 nm for experiment (a), (b), (c) and (d) respectively.
4. CONCLUSIONS
The data obtained in this study indicate that plant dyes can be used to quantitate proteins in solution. The results of protein quantitation with ethanolic extracts of Ixora coccinea, Hibiscus rosa-sinensis, Lawsonia inermis, Jatropha curcas and Hibiscus sadarifa are quite promising. The sensitivity is comparable to the well-known methods of Lowry et al. [2], Bradford [3] or Pierce 660 nm protein assay of Antharavally et al. [5].
Every protein assay has limitations which essentially depends on the specific protein sample being analyzed, composition of the solution containing the protein and the type of sensitivity required. At high protein concentrations, precipitation was noticed during the mixing of some dyes with proteins. This problem was solved by lowering protein concentration. The precipitation could be due to interaction of some dyes with proteins or could be due to ethanol-protein interaction. We are currently working on ways to optimize the procedures especially the establishment of the nature and chemical structure of the components responsible for colour formation.
REFERENCES
- Gornall, A.G., Bardawill, C.J. and David, M.M. (1949) Determination of serum protein by means of biuret reaction. Journal of Biological Chemistry, 177, 751-766.
- Lowry, O.H., Rosebrough, N.J., Farri, A.L. and Randall R.J. (1951) Protein measurement with the folin phenol reagent. Journal of Biological Chemistry, 193, 265-275.
- Bradford, M.M. (1976) A rapid and sensitive method for the quantitation of Microgram quantities of protein utilizing the principle of protein-dye binding. Analytical Biochemistry, 72, 248-254. doi:10.1016/0003-2697(76)90527-3
- Smith, P.K., Krohn, R.I., Hermanson, G.T., Mallia, A.K., Gartner, F.H., Provenzano, M.D., Fujimoto, E.K., Goeke, N.M., Olson, B.J. and Klenk, D.C. (1985) Measurement of protein using bicinchoninic acid. Analytical Biochemistry, 150, 76-85. doi:10.1016/0003-2697(85)90442-7
- Antharavally, B.S., Mallia, K.A., Rangaraj, P., Haney, P. and Bell, P.A. (2009) Quantitation of proteins using a dye—Metal-based colorimetric protein assay. Analytical Biochemistry, 385, 342-345. doi:10.1016/j.ab.2008.11.024
- Brown, R.E., Jarvis, K.L. and Hyland, K.J. (1989) Protein measurement using bicinchoninic acid: Elimination of interfering substances. Analytical Biochemistry, 180, 136- 139. doi:10.1016/0003-2697(89)90101-2
- Groves, W.E., Davis, F.C. and Sells, B.H. (1968) Spectrophotometric determination of microgram quantities of protein without nucleic acid interference. Analytical Biochemistry, 22, 195-210. doi:10.1016/0003-2697(68)90307-2
- Siva, R. (2003) Assessment of genetic variation in some dye-yielding plants using isoenzyme data. Ph.D Thesis, Bharathidasa University, Tiruchirapalli.
NOTES
*Corresponding author.