Modern Economy
Vol.4 No.12(2013), Article ID:41317,12 pages DOI:10.4236/me.2013.412092
Generic Substitution Effects on Firm Level Market Shares in the Finnish Beta Blocker Market 1997Q1-2007Q4
Department of Health and Social Management, University of Eastern Finland, Joensuu, Finland
Email: mika.linden@uef.fi
Copyright © 2013 Mikael Linden. This is an open access article distributed under the Creative Commons Attribution License, which permits unrestricted use, distribution, and reproduction in any medium, provided the original work is properly cited. In accordance of the Creative Commons Attribution License all Copyrights © 2013 are reserved for SCIRP and the owner of the intellectual property Mikael Linden. All Copyright © 2013 are guarded by law and by SCIRP as a guardian.
Received September 12, 2013; revised October 12, 2013; accepted October 19, 2013
Keywords: Generic Substitution; Market Concentration; Inequality; Competition; Policy
ABSTRACT
The firm level market structure of the Finnish beta blocker market in the period from 1997Q1 to 2007Q4 is analyzed with data analysis and with panel data regression methods. Four different market concentration measures are used. Although drug prices have decreased in response to the competition-enhancing generic substitution system which started on the 1st of March 2003, the firms’ observed market shares in the market have not decreased uniformly in the all market dimensions. At the drug substitution group level, policy change has led to more equal group share distributions both for the nominal sales shares and quantity sales shares compared to the pre-policy period. At the whole market level, nominal firm sales shares of the largest firms have increased during the policy era but quantity sales shares have declined. The results imply that the dominant firms’ nominal sale shares are augmented with firm-specific drug price setting power. The results challenge the European Union (EU) drug policy targeted to increase competition in the drug markets.
1. Introduction
Industrial organization (IO) aspects of health care markets do not have a central position in the health economics literature. However, typical questions found in IO textbooks and research articles—like market structure, number of firms, firms’ market shares, price competition, and regulation—are in the core of health care market analysis. Evidently some research has been conducted from standard IO perspective with valuable insights [1-4]. However, analysis of drug markets with references to IO literature has been quite active. Market dynamics between the brand name drugs and their generic copies is a question of some interest in the current IO research agenda (see e.g. references cited below). In the following, our focus is on the firm level market structure of beta blocker packages sold in Finland during period of 1997Q1- 2007Q4. The hypothesis is that, although prices have decreased in response to the generic substitution system introduced on the 1st of March 2003, the firms’ observed market shares have not necessarily decreased. The market structure analysis is conducted with data analysis and with four different market concentration measures. The analysis is also augmented with different regression methods.
The structure of the paper is as follows. Section 2 reviews the background of generic substitution in the drug markets. Section 3 gives the details on the measurement of market concentration and power. Section 4 analyzes the market structure of beta blockers in Finland in the sample period. The focus is on the descriptive analysis of the number of involved firms and on the measurement of firms’ whole sales and substitution group market shares. The analysis is also cast in difference-in-difference regression framework in order to derive more transparent effects of substitution policy on firms’ market shares. Sections 5 and 6 discuss the results and conclude the paper.
2. Background
The target in the EU region is to urge governments to encourage price differentiation and competition in drugs markets. Regulation instruments like reference pricing systems, prescribing budgets, generic substitution, patient co-payments, monitored pharmacy sales and physician prescriptions employed by governments can be effective in stimulating generic up-take. However these measures must also stimulate competition in the markets [5,6]. Ultimately, generic substitution is a key issue for all generic pharmaceutical manufacturers as it can provide an effective boost to the dispensing of generic medicines, consequently providing room for the growth of the generic market; for example, reference pricing is believed to increase price variability and hence promote competition between firms. However, if firms strategically respond to regulation by optimally anticipating the effects on the reference price level then the effectiveness of enhancing competition might be jeopardized [7]. Regulation systems that predominate in Europe indicate that, although it may lead to price reductions, application of these policies may constitute a barrier to dynamic competition in consumer prices [8].
In Finland a generic substitution with regulated price system started on the 1st of March 2003. The medicines are categorized into chemical or therapeutically equivalent product sub-groups. These groups with identical or similar active ingredients (molecules) are called “reference” or “substitutions” groups. The national health authority classifies similarity between medicines. The pharmacist has to suggest substitution of the original drug if it is not already located in the price band determined by the price of the least expensive product in the substitution group by a margin of EUR2 or EUR3 depending on the level of package price. The consumer can deny the replacement. Most importantly, many brand name products that can be dispensed are outside the group price bands. The consumer pays the price difference above the group’s upper price margin. The prices are typically subsidized by the state up to 60% for most of prescribed drugs. Thus it is expected that firm competition also takes place within these substitution groups. Note that the maximum wholesale prices of prescription drugs available to all pharmacies that are reimbursed by the government are determined by negotiations between the producers and the regulatory authority. The authority also sets the retail mark-up price for reimbursed drugs.
The active generic substitution policy has reduced pharmaceutical expenditures and drug prices across Europe, including Finland, but less is known about how the markets have been re-structured after the policy change. Important questions to ask are those such as (1) have new firms with generic products penetrated the market? and (2) have the market shares of firms producing brand names been eroded? Most papers in the field have focused on the first question [9,10]. On the general level results on generic entry and its factors are well known. Number of brand names in the markets, expected revenues, and profits increase the number of entrants. However, the number of generic firms already in the market, regulated markets with price caps, and reference price systems supporting price convergence effects lower the number of entrants.
The second question is considerably less analyzed. In the United States (US) original brand market shares have been found to have an inverse relationship to the age of the originals, and major brand names typically lose half of their market shares within one year of patent expiry. The penetration (i.e. market shares) for un-branded products, a decade after patent expiration, is quite strong in the US and in Germany, but less in the United Kingdom and in France [11-13]. High price ratio between brands and generics, the market size, and the number of brand names in the market also mean a larger share for generics. In Slovenia the introduction of generic substitutions based on the reference price system in November 2003 led to a large increase of market share of generics [14,15]. Finally, in Sweden, data on 12 different chemical substance classes for the years 1972-1996, the relative change of market shares of original drugs was nonpositive and the relative price of the original drug to the price of the generic substitute significantly decreased the market size of brand names in five substance classes [16]. The reference price system introduced in 1993 had the same effects on three classes. The authors emphasize that the differences in results between the substance classes underline the importance of using disaggregate data.
All these studies focus on the market shares of brand products versus shares of generics on the aggregate level or on some chemical substance level. However, this type of aggregation masks the firm level market share dynamics. In the context of price regulation, like reference price or generic substitution systems, the firm level policy implications are less evident.
First of all, price regulation does not correspond to efficient (competitive or non-competitive) market conditions, since the objective of regulation is to reduce costs of private and public drug expenditures [17]. This can happen in the environment where market conditions may be very non-competitive and regulation effects on these conditions are minimal. Second, price regulation targeted to reduce retail prices also lowers profits for the entrant firms. Thus regulation does not necessarily increase the number of firms—and the competition—in the market. Third, both vertical and horizontal product differentiation still have their role in the multi-market context typical for the drug markets. Here the contact dimensions between the firms are important [18]. Firms with many brand names and generics in the multi-market competition are a complex playground wherein firm level shares do not necessarily decrease in the presence of generic substitutions and reference price systems. On the market level the dominant firms can redistribute their market powers in the contact space with their brand and generic products (i.e. the “own generics” phenomena) so that their whole or average market shares are not eroded [19-21]. Also by adjusting their product prices in substitution groups in response to generics they can keep their whole market and average group level market shares. Evidently the policy change of generic substitution may leave the market shares and contacts intact. Overall market specific drug prices decrease because of generics induced by the policy change but the market may not evolve towards being a more competitive one identified with firms’ market power and shares. Finally, the policy change can also have some negative side effects, such as non-permanent firm and product entries, that may be harmful for the drug users.
With this background the paper analyses the Finnish beta blocker market during the period of 1997Q1 to 2007Q4 (T = 44). During this period 47 different firms or their distributors were observed. The data contained 83 product names with 359 product items. The number of still-protected brand names was 31 in the beginning of the sample period and they belonged to sub-group 0 wherein the generic substitution was not practiced. The rest of the products (52) consisted of brand names with patent expiry and of generics distributed in 38 substitution groups. The observed number of active chemical ingredients was 20. In total the number of observations was 8050.
3. Methods
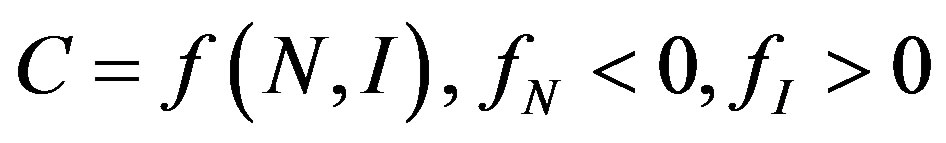
The purpose of a measure of market and industrial concentration is to provide summary statistics reflecting the distribution of firms in a market, indexing one element of market power [22]. It is generally agreed that this should be a one-dimensional measure, incorporating two relevant aspects of market structure, namely number of firms (N) and size inequalities (I). We can represent a proper index of concentration, C, as:
 (1)
(1)
We assume, on the basis of almost any theory of market structure, that the smaller the number firms and the more unequally sized they are, the more market power they can exert as a group. Note that the structure of  entails that “iso-concentration” curves have the shape of
 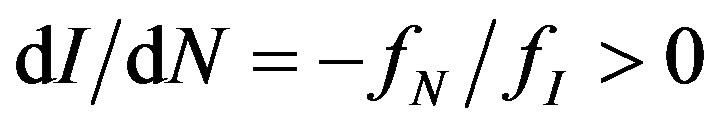 in (I,N)-space and that concentration C increases because of increased firm size inequality with a given number of firms.
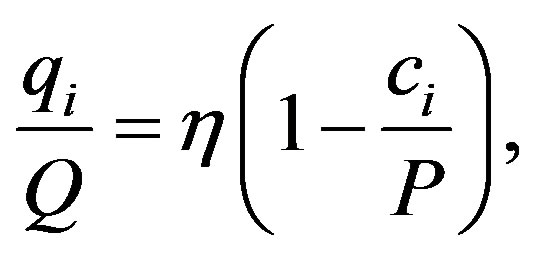
The main target of market concentration analysis is to find an appropriate way to measure size inequalities in combination with firm numbers. Given the need to measure inequality, we need a convention for measuring firm size. In this context inequality will be based upon the relative drug market shares of the firms. More precisely, we focus on the total monetary or nominal sales of firms on particular drug markets; that is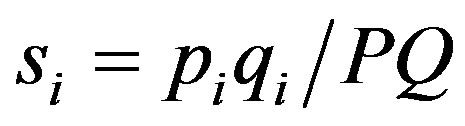 , where piqi is the firm i’s
  nominal sales and PQ is the total market sales of drugs on the relevant market (e.g. beta blockers). Note that nominal sales have two components, the price and the quantity. In the following we pay more attention to sold quantities
  than nominal sales. Only if relevant differences between quantity and nominal sales are observed are they reported. The observed differences can be interpreted as residual terms referring to firms’ prices.
Note that if all firms have the equal nominal or the equal “output” then  for all i. In general Equationh (1) demands that there will be an inverse relationship between firm numbers and market shares. The easiest way to handle Equation (1) in practical concentration analysis is to observe that the concentration ratio is defined as
 (2)
(2)
where the firms in the market are ranked from largest market share  to smallest, with the nth largest being indexed with
 is popular because of its easy interpretation as it provides a sign of the oligopolistic nature of a market and indicates the degree of competition. For this purpose we use
  and
and . Note that value of
  is increasing both in
  and in
  violating the proper conditions for
 .
.
In principle we could calculate  but the most straightforward and popular index that captures the whole market size distribution is the Hirschman-Herfindahl index (HHI)
 (3)
(3)
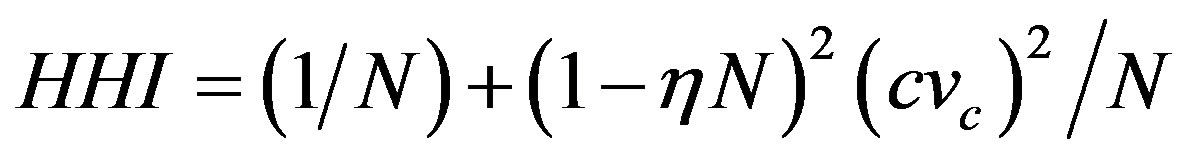
where cv is coefficient of variation of . Thus HHI encapsulates in a proper way both the inequality and firm number effects suggested in
  as cv is a statistical measure of inequality. In addition to this it can be shown that under the Cournot oligopoly model with
where  is market demand price elasticity,
  is firm’s marginal cost, and P is the market price, HHI has the following form
 (4)
(4)
where  is the coefficient of variation of marginal costs [23]. Thus HHI is closely related to basic theoretical results that determine the market structure. The reciprocity of index indicates the “equivalent” number of firms in the market.
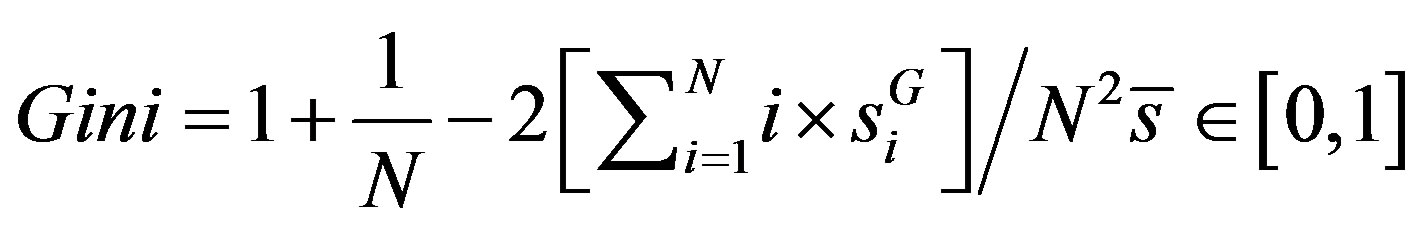
Another global measure that focuses on the inequality is the Gini-coefficient developed from the Lorenz curve. Let  be the ith ordered firm share in increasing order
 . Now the Gini coefficient or index can be calculated as [24]
 . (5)
. (5)
The problem with the Gini coefficient is related to the fact that two intersecting Lorenz curves can provide equal or even non-intuitive Gini coefficients.
The problems of global measures can partly be avoided if the concentration analysis is cast at the local level. The concept of market dominance is important here. By market dominance we mean that one firm, obviously the largest one, dominates the market. This suggests the following measure for market dominance:
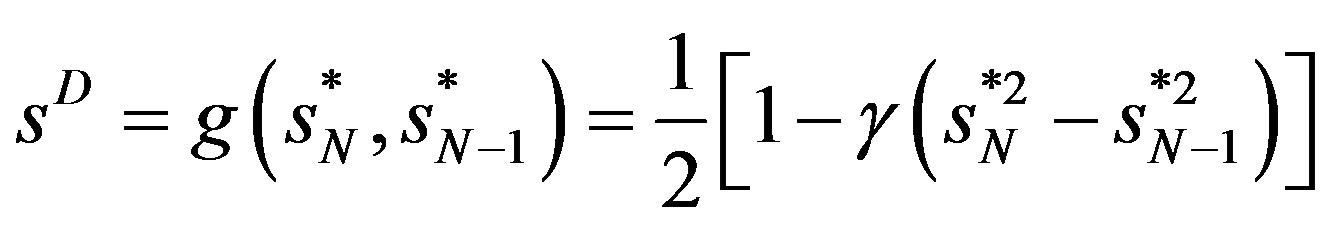 (6)
(6)
where  is the largest market share and
  is the next largest market share. Reference [25] argues that
  is suitable as a benchmark. We scale
  in the following way
 (7)
(7)
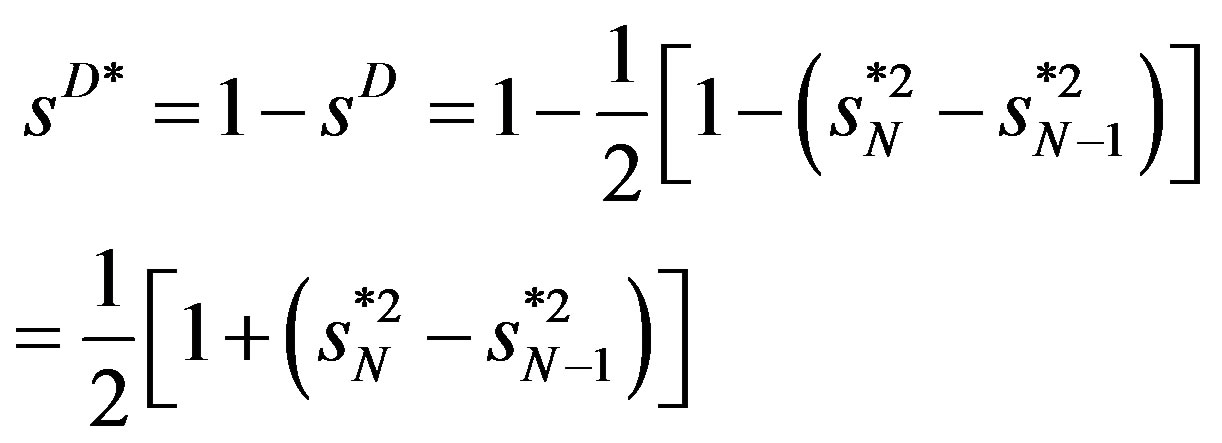
to get the measure comparable with the other indexes suggested earlier. Thus if  and if
  (with
(with ),
),  , not 0 like sD . Now all the market structure measures,
  ,
,  , GINI, HHI, and sD*, get a high value when the relevant drug market is dominated by few firms having large market shares. Value of one is obtained for all if there is only one firm in the market.
4. Results
4.1. Prices and Sales
Although the defined daily doses (DDD)-adjusted package prices of beta blockers are not the main focus of the paper, we report some results on the average price development during the sample period. The substitution policy started on the 1st of March 2003. We connect this to the time point of 2003Q2 in the sample. Figure 1 depicts the cross section means of product DDD-prices with  2
2 standard errors during period of 1997Q1- 2007Q4. The substitution policy period is shown with yellow shading. The figure shows a clear downward trend in prices after the policy change in the second
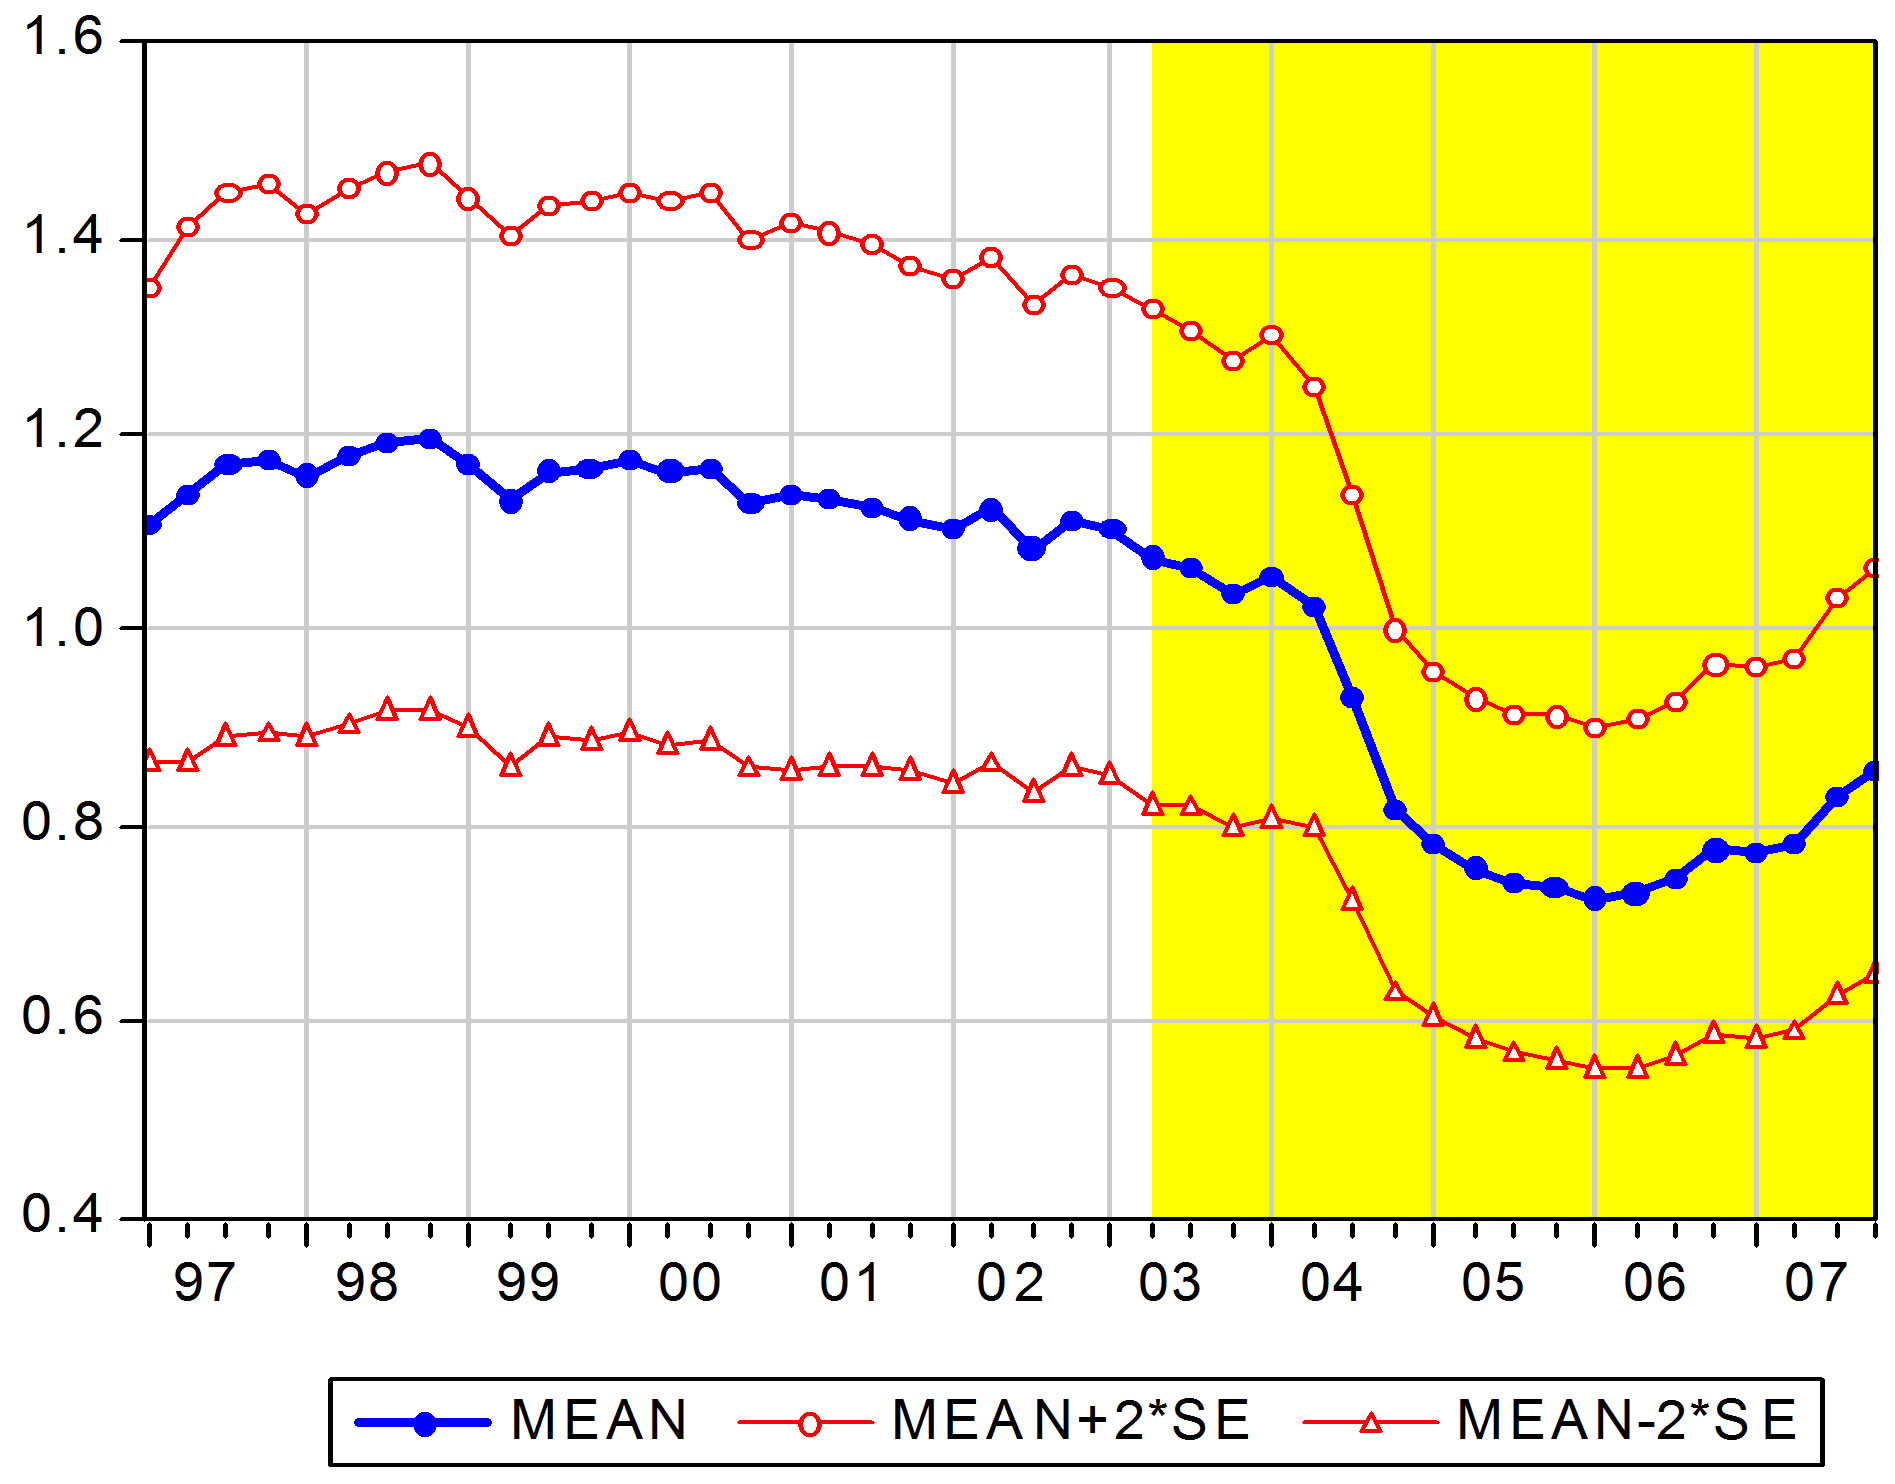
Figure 1. Mean DDD-adjusted package prices by time.
quarter of 2003.
4.2. Nominal and Package Sales
Figure 2 shows the total market nominal sales (PQ) and the number of sold packages (Q) of beta blockers in 1997Q1-2007Q4. We observe that total nominal sales are sensitive to price reductions observed in Figure 1. However, the quantity part of sales, the number of sold beta blocker packages, do not respond to the policy change. Note that if we transform the packages to corresponding number of sold pills the figure remains the same (not reported). Thus any package re-sizing in response to the policy change has not occurred.
4.3. Number of Firms and Whole Market Shares
Figure 3 depicts the number of firms that operated on the beta blocker market at different time points of the sample. The figure shows a slow downward trend in the firm number until the date of the policy change and thereafter we observe a rapid increase in firm number in the years 2004-2005. In 2005 the number starts to decrease once again. The policy change has evidently increased the number of firms in the beta blocker market. This is an important result.
However, the main focus of paper is the analysis of market concentration identified with inequality among the firm market shares.
Figure 4 gives the cross section average of market shares of firms’ sold packages during the sample period 1997Q1-2007Q4. The figure for nominal sales shares is almost identical (not reported). We observe that a clear drop in the average firm market share corresponds to the increase in firm numbers in Figure 3. However, the picture changes totally when we pay closer attention to the distribution of package shares. In this context we found relevant differences between the quantity and nominal
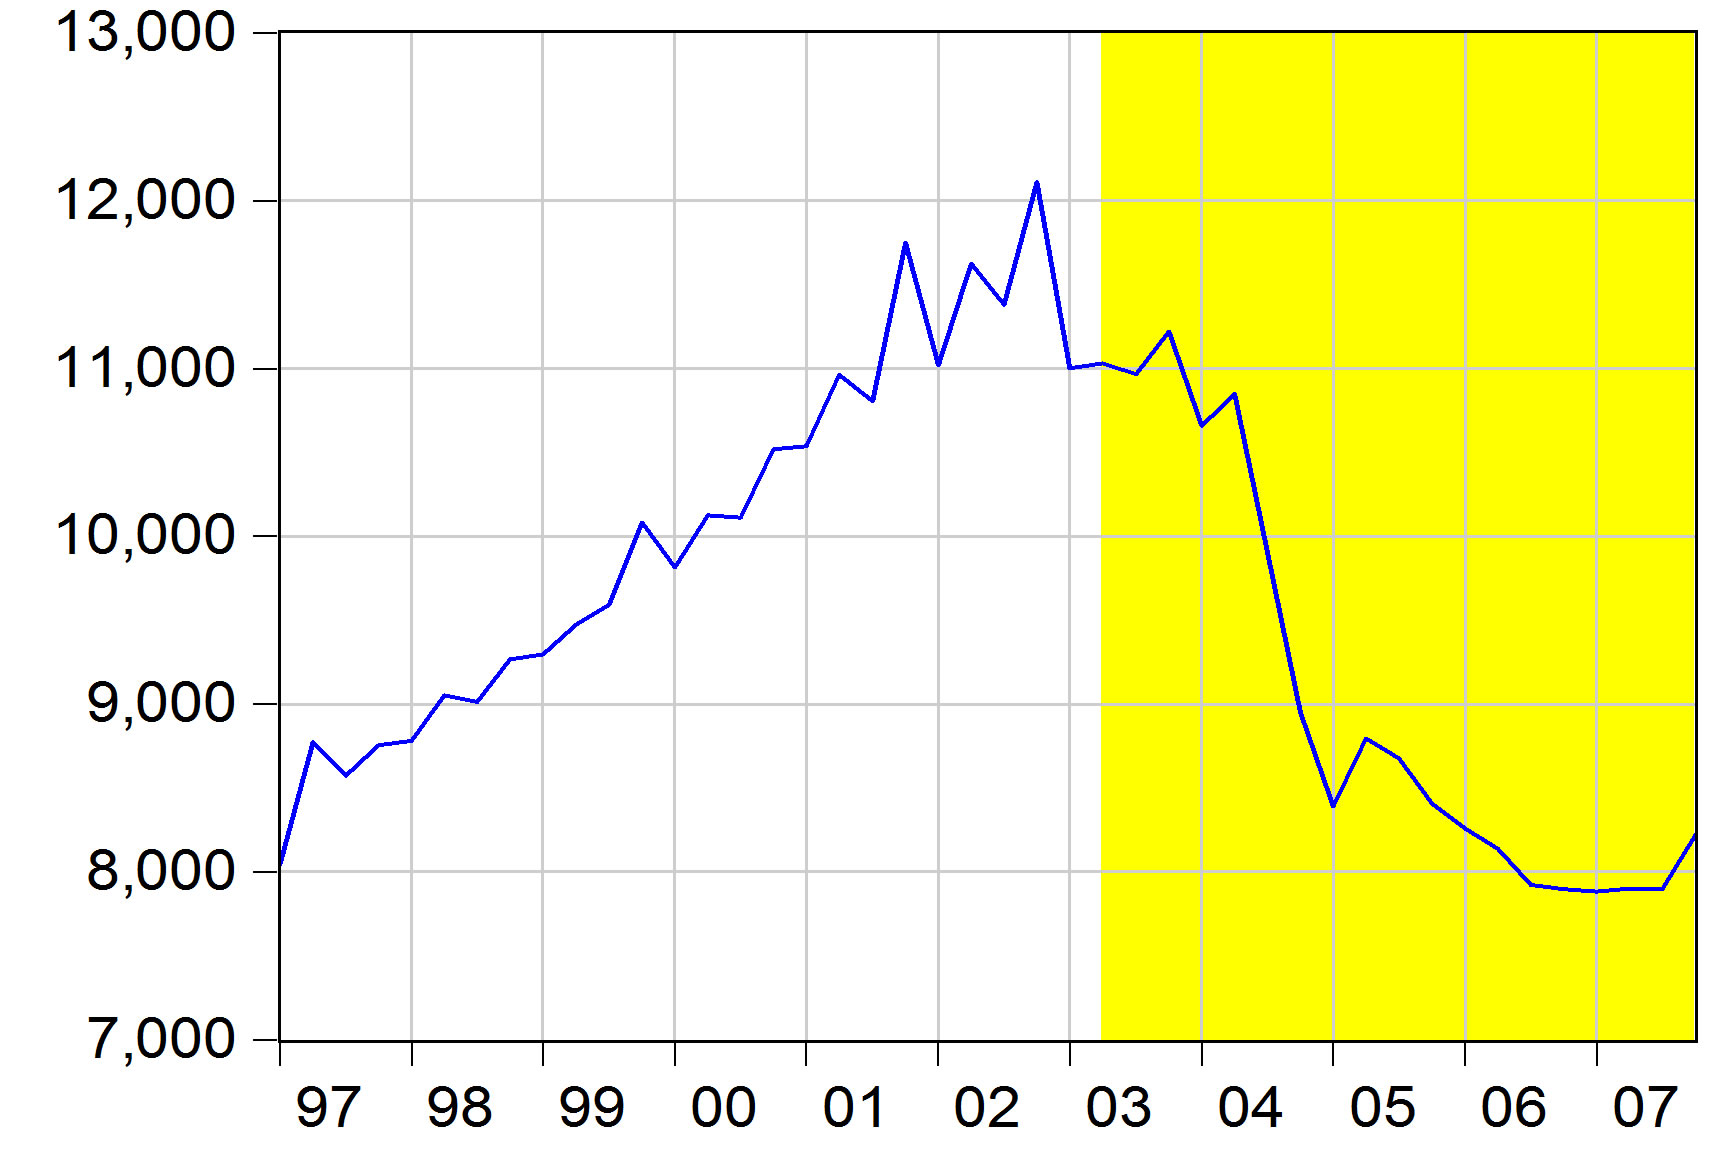
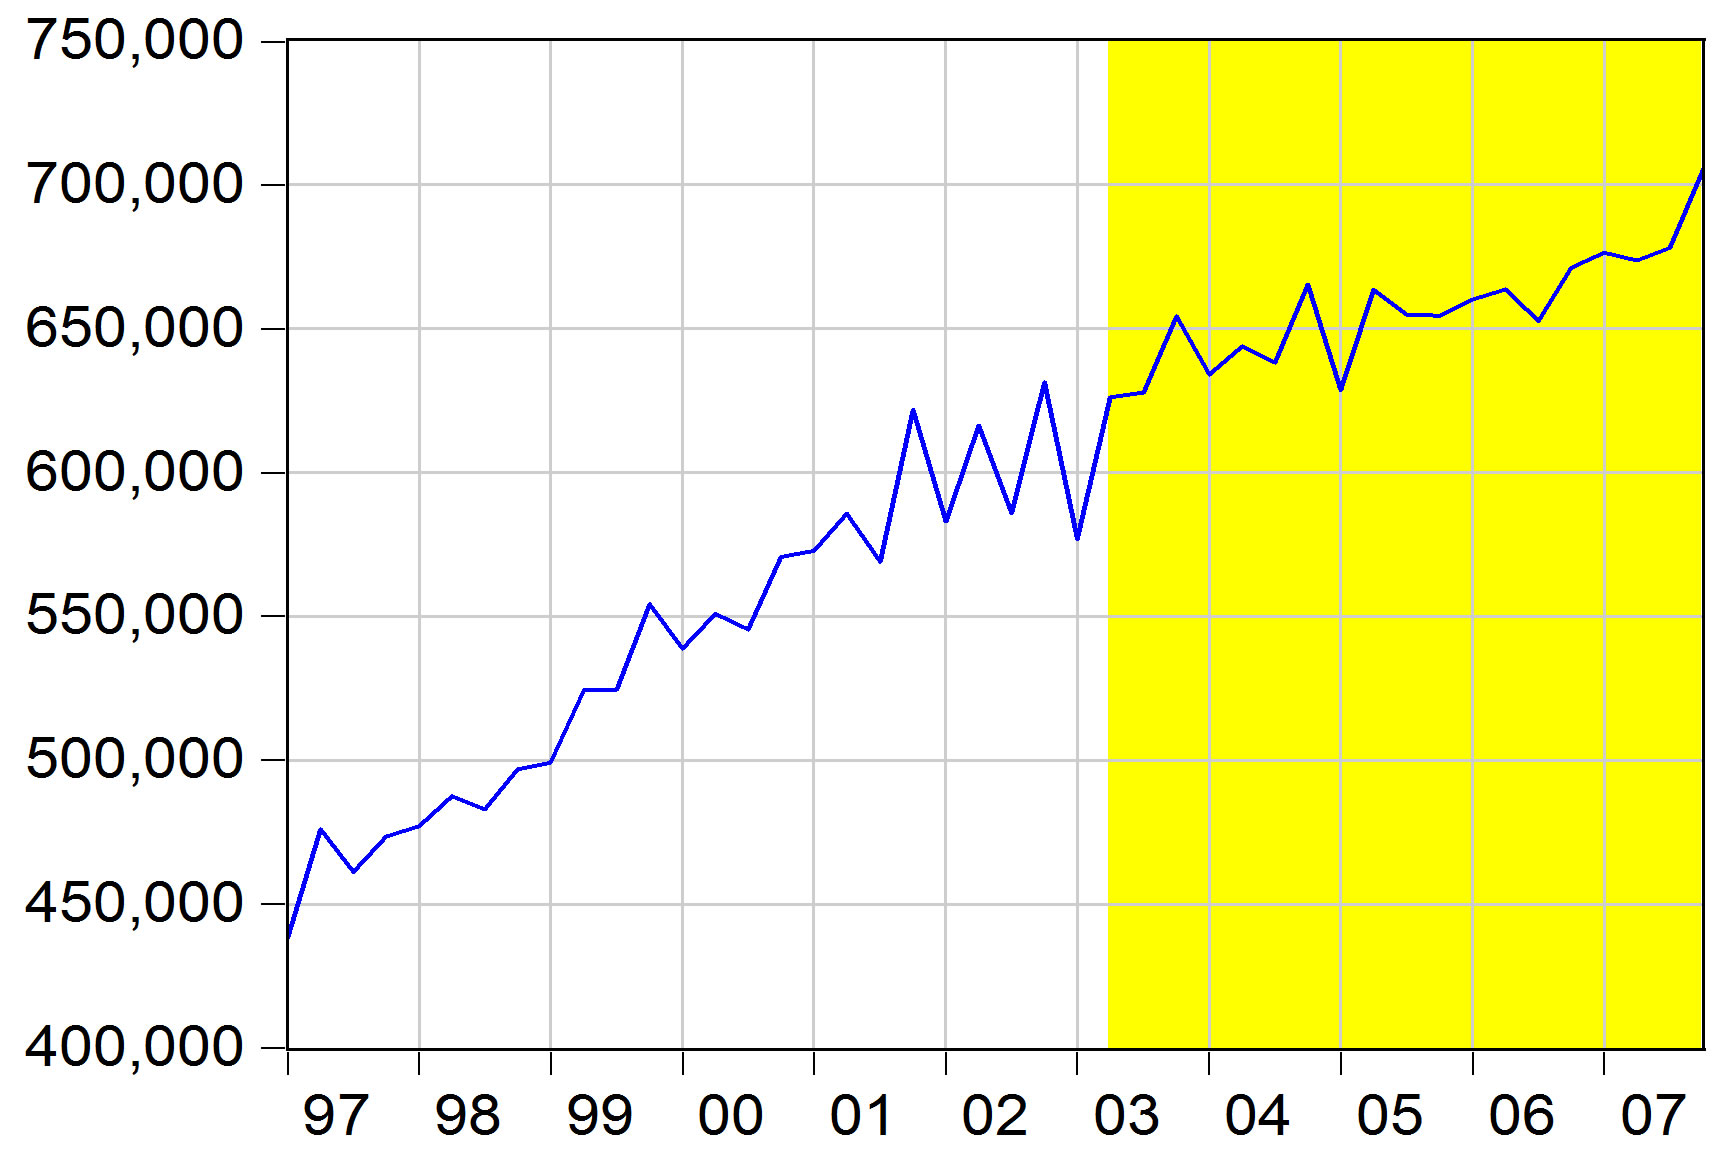
Figure 2. Total sales (in EUR1000) and the number of sold packages.
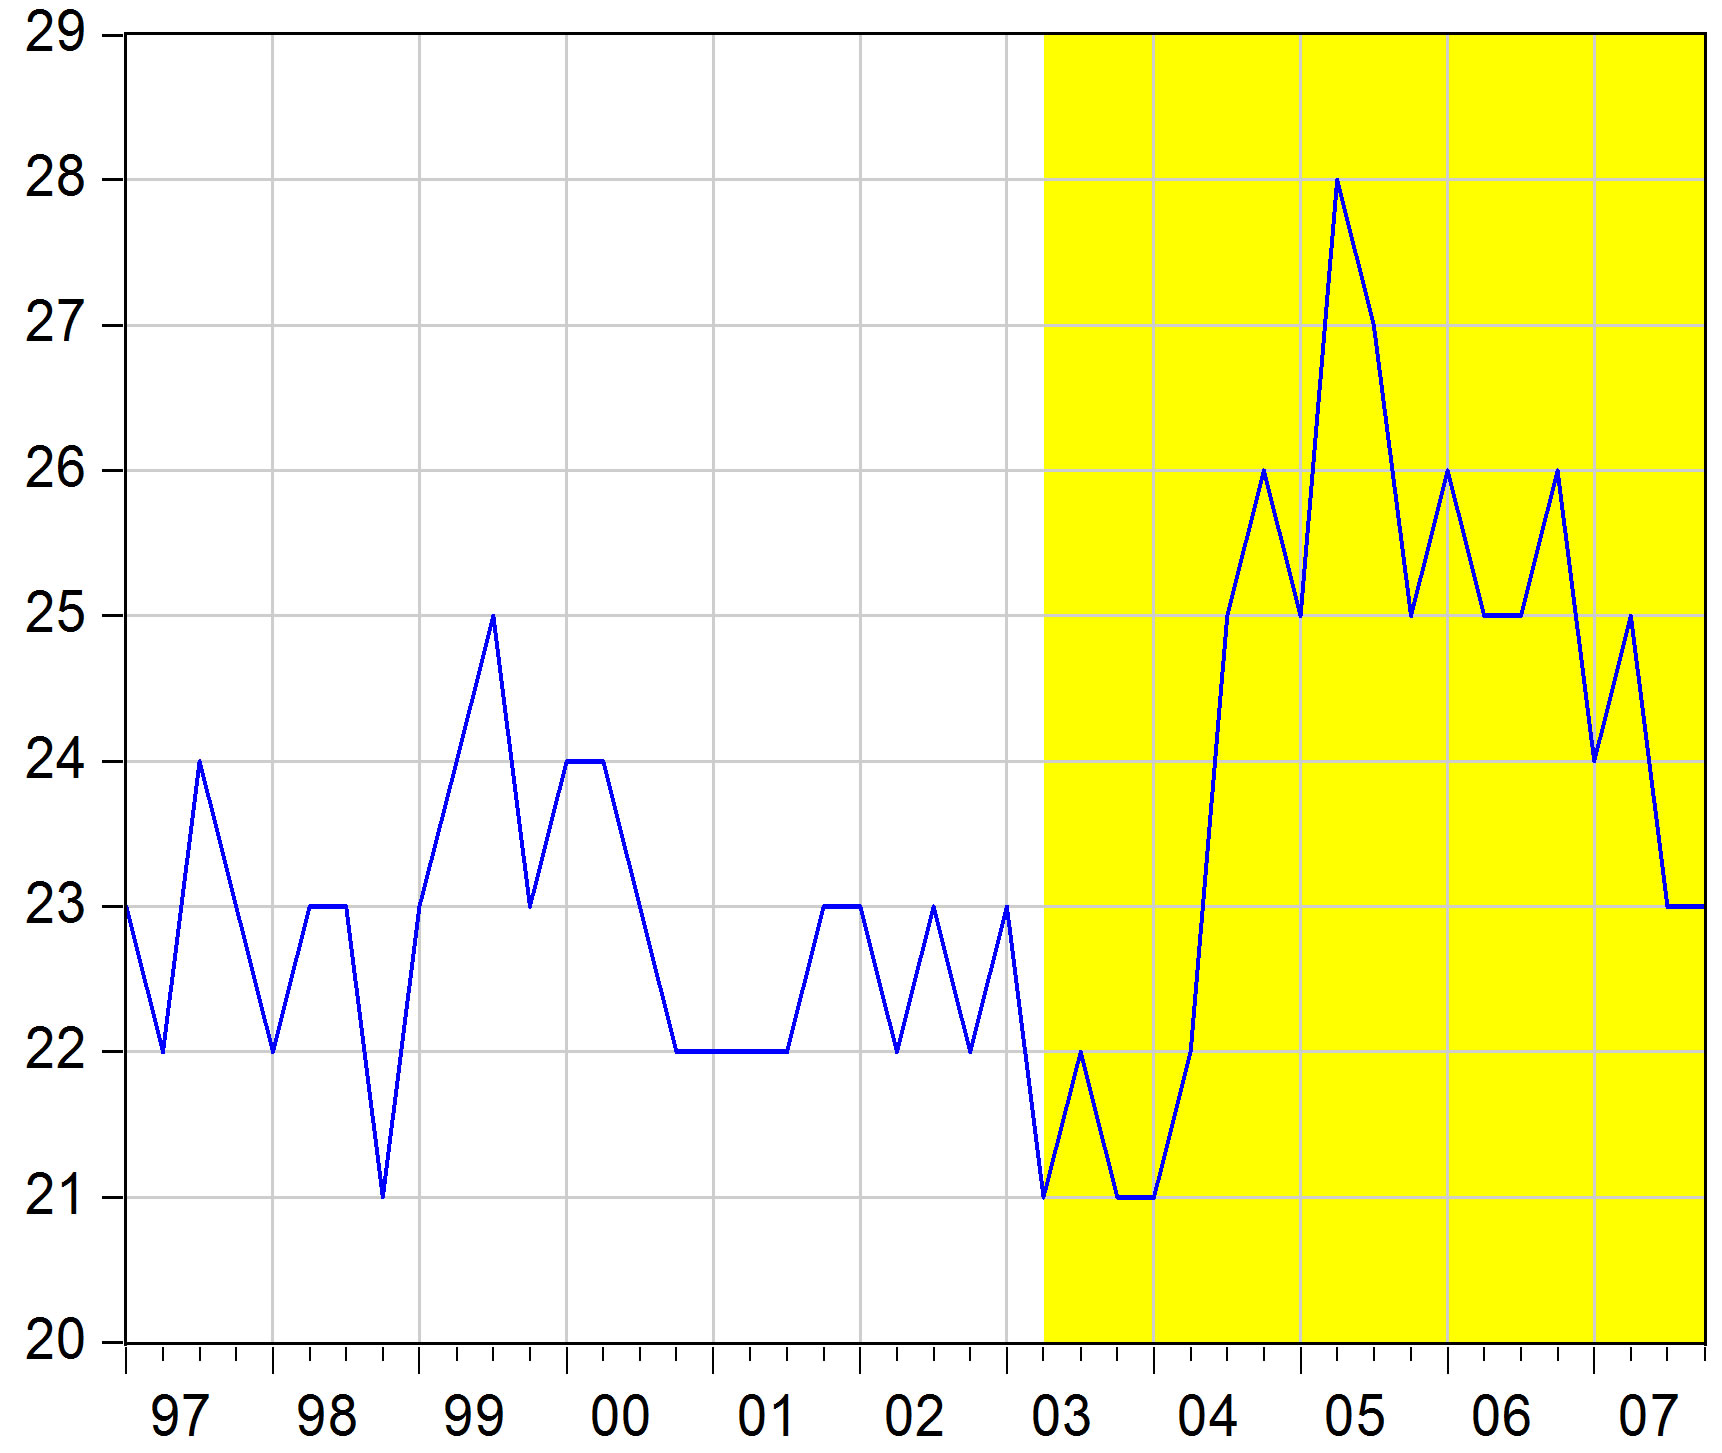
Figure 3. Number of firms by time.
sales shares. Figure 5 gives the histograms of package and nominal sale shares. The distributions have a long right tail indicating that some firms have over 25% market shares of sold packages and over 45% of nominal sales.
Table 1 also shows that the distribution matters. For example there is circa 100% increase in median shares after the policy change. On the general results above give an indication that the Finnish beta blocker market is dominated by few firms which have large market shares. However, the substitution policy has had heterogeneous
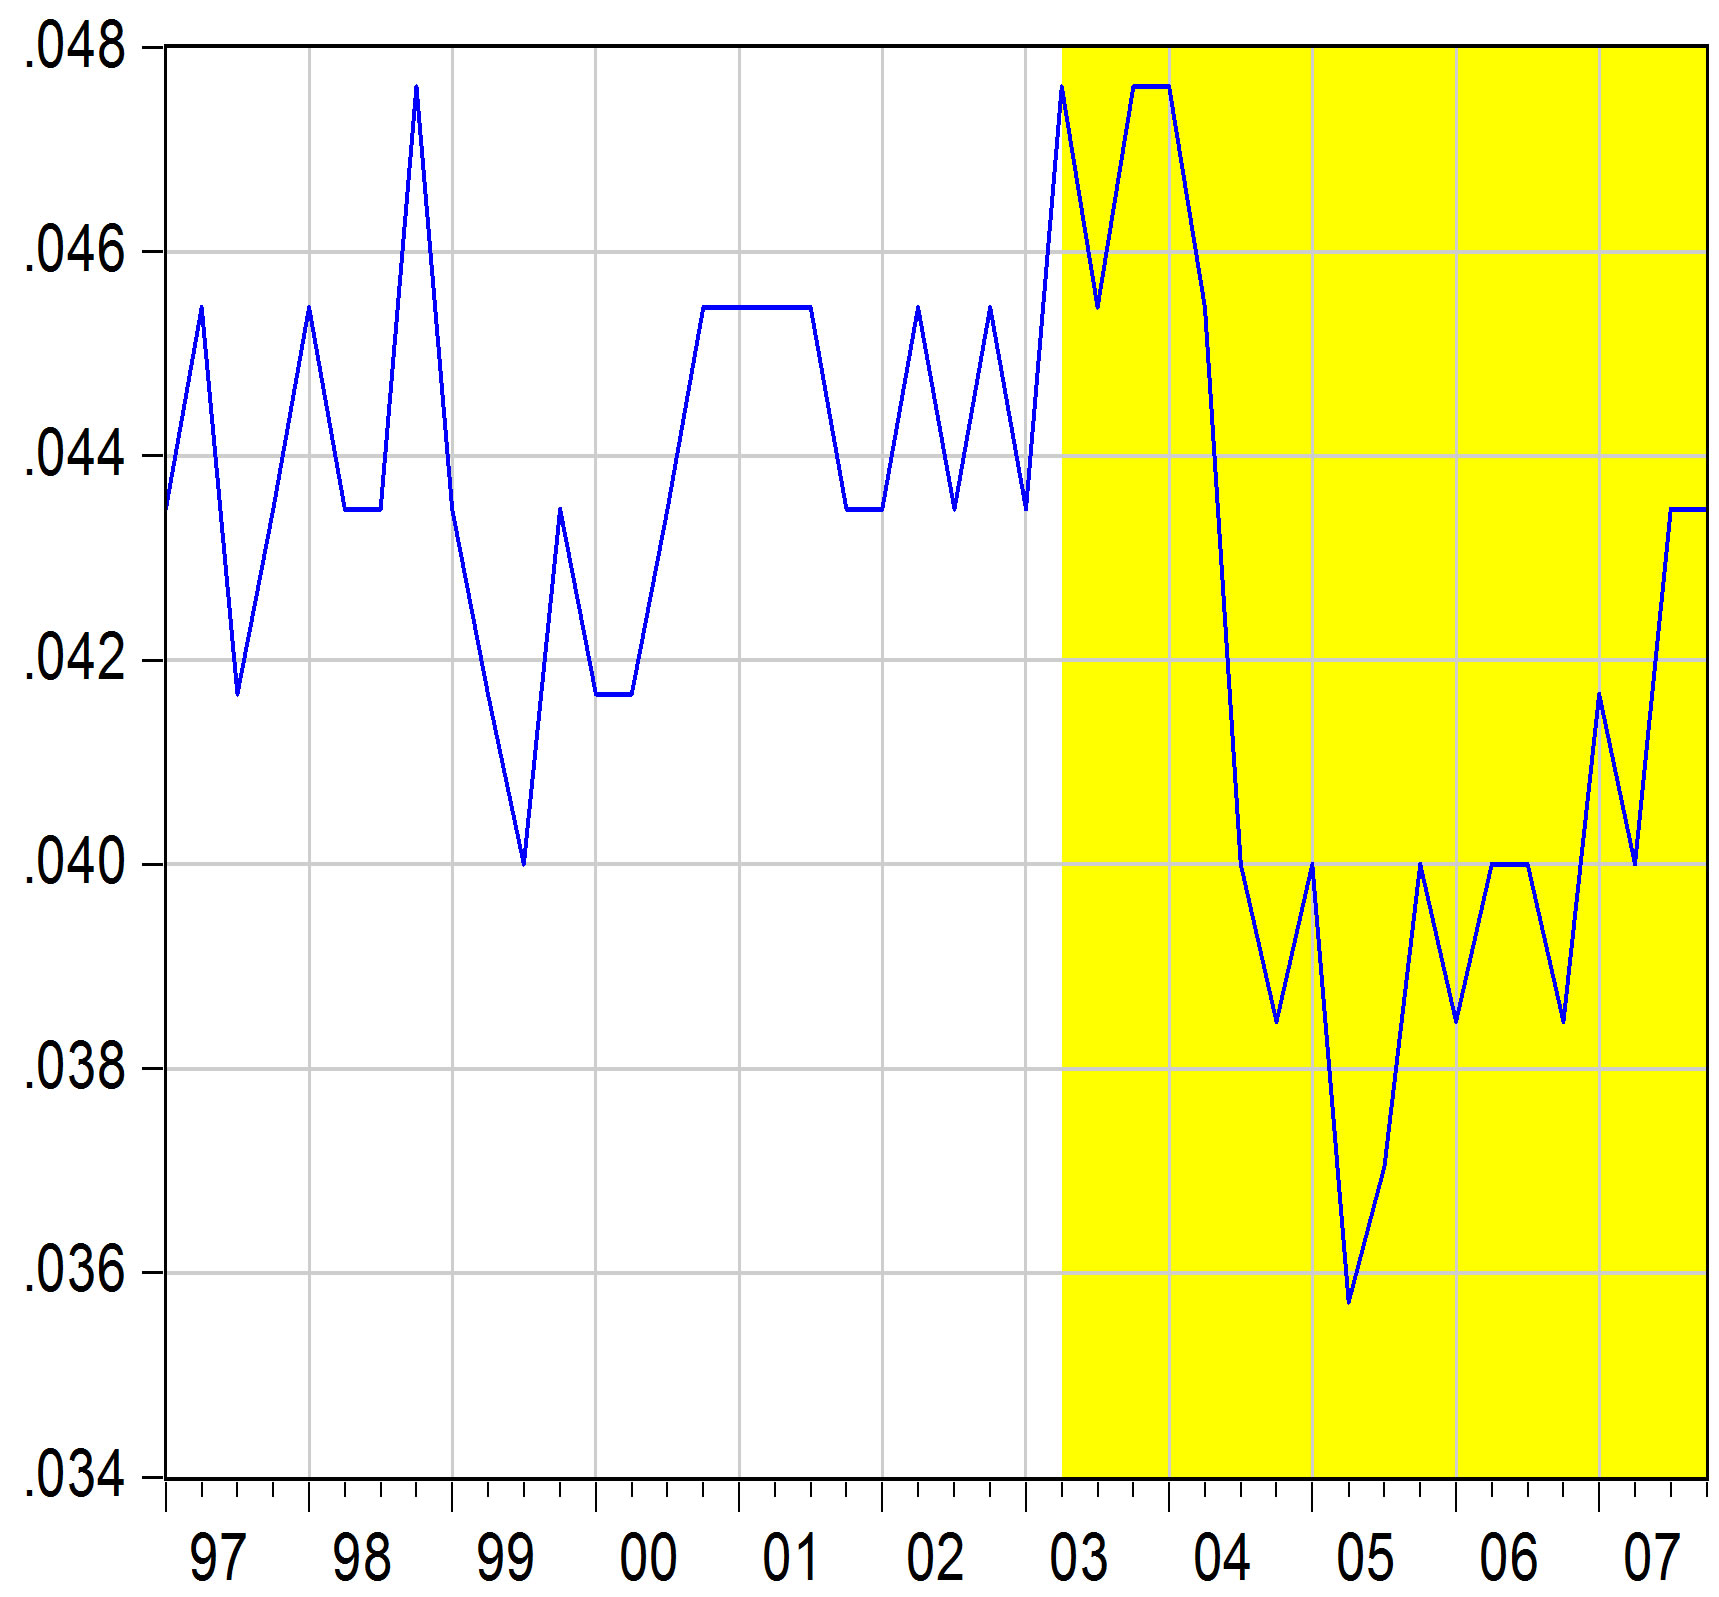
Figure 4. Means of firms’ sold package shares by time.
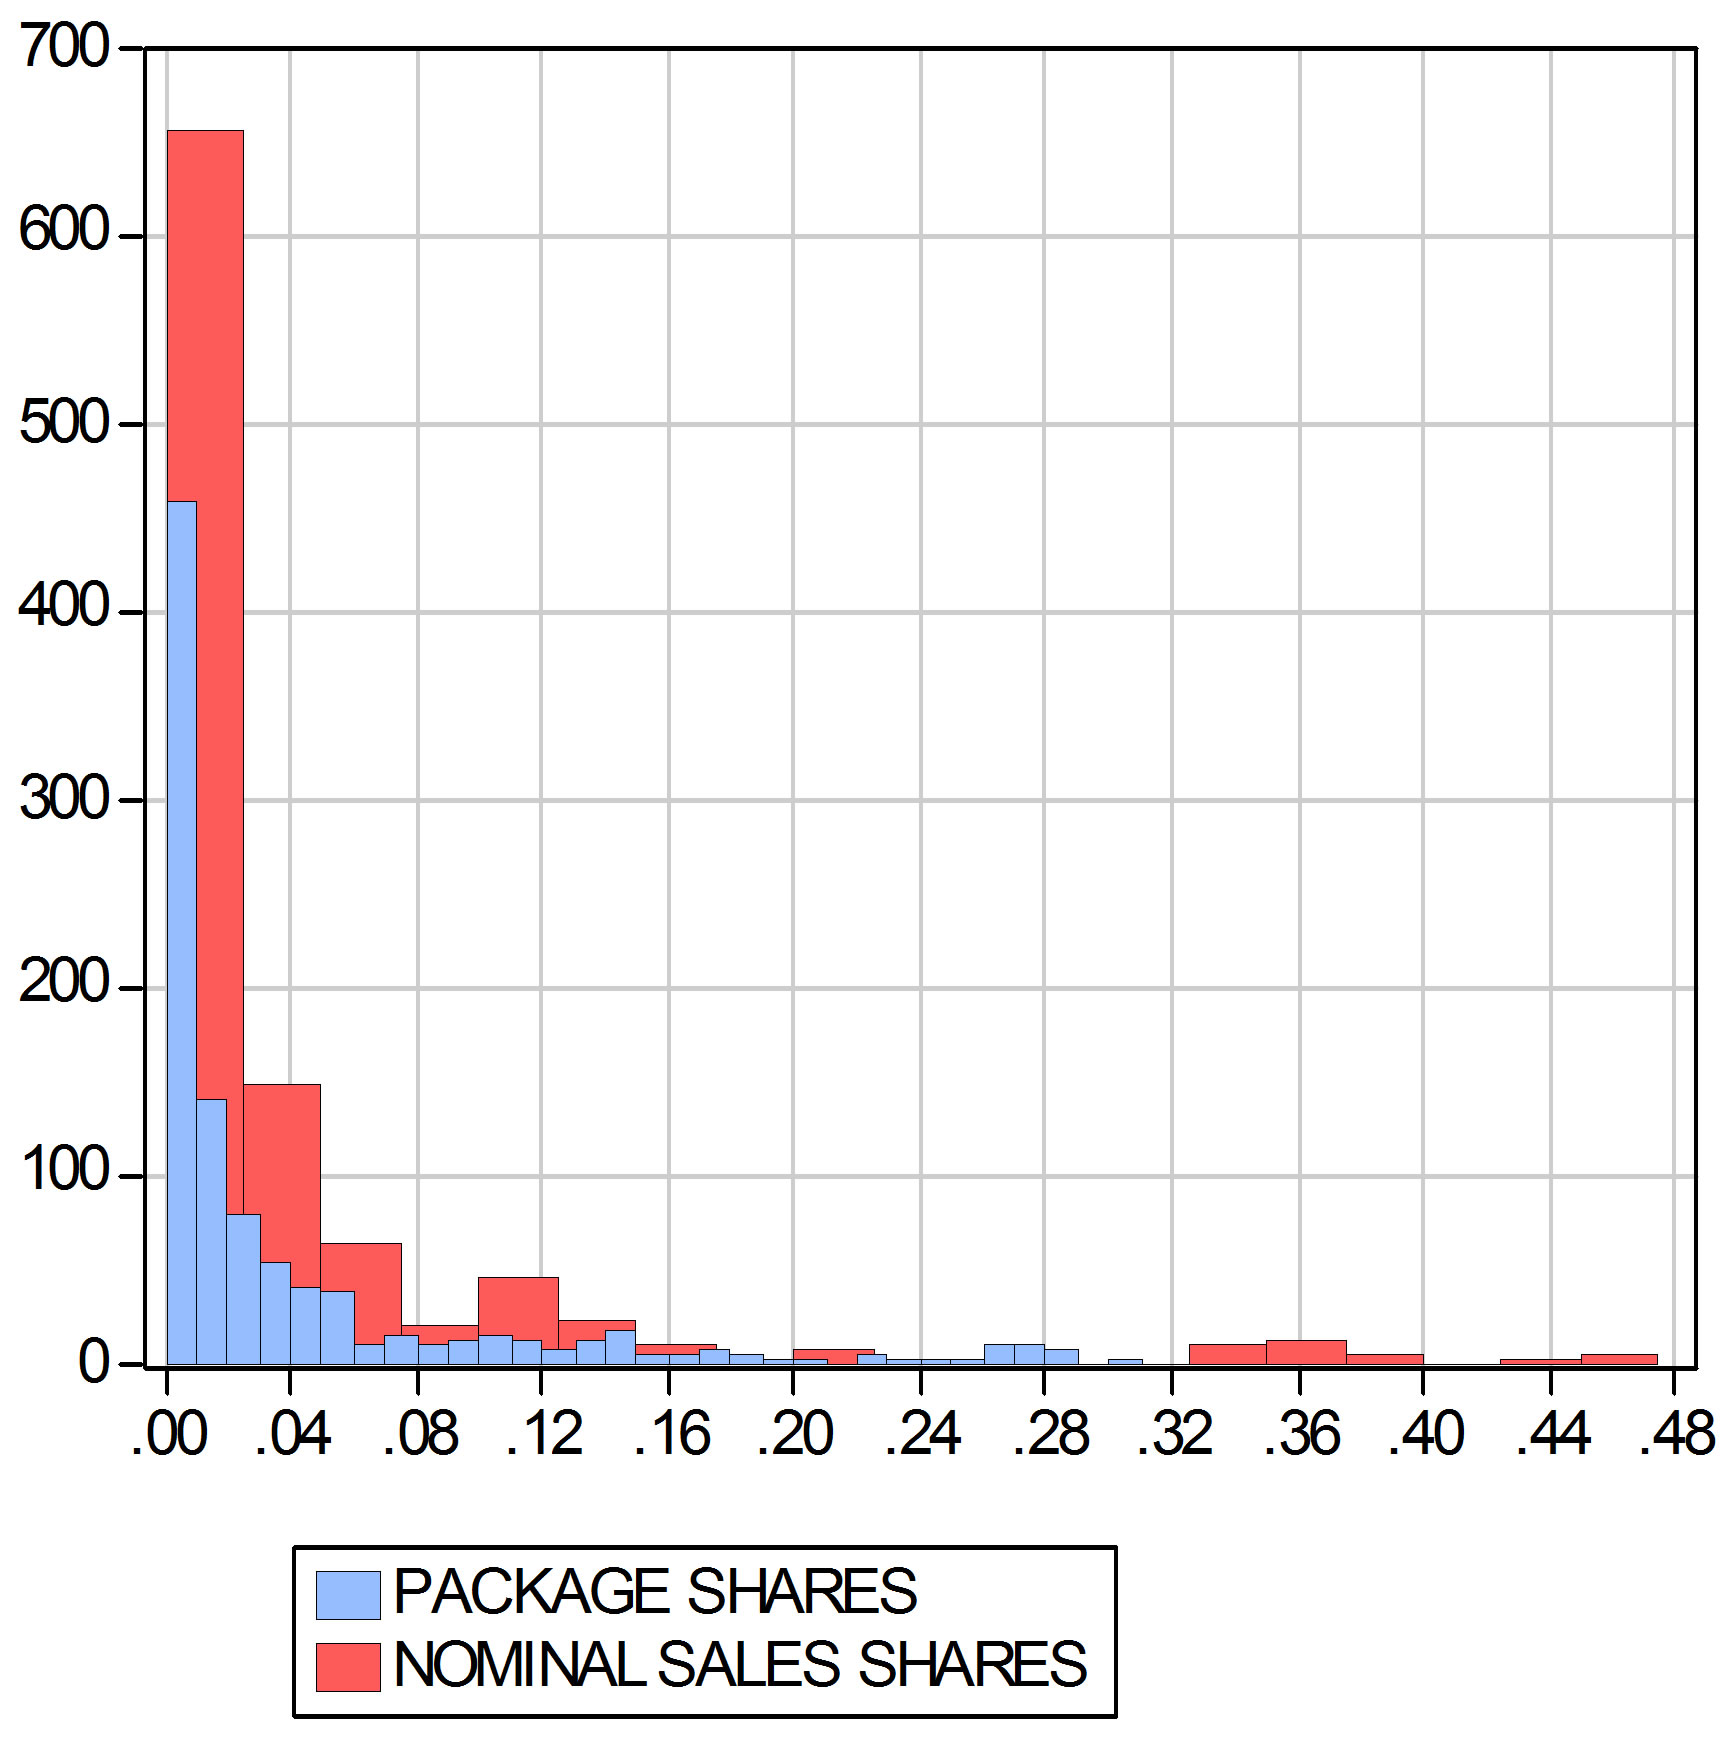
Figure 5. Histograms of firms’ package and nominal sales shares.
effects on the market shares of firms.
4.4. Market Concentration and Dominance in Beta Blocker Market
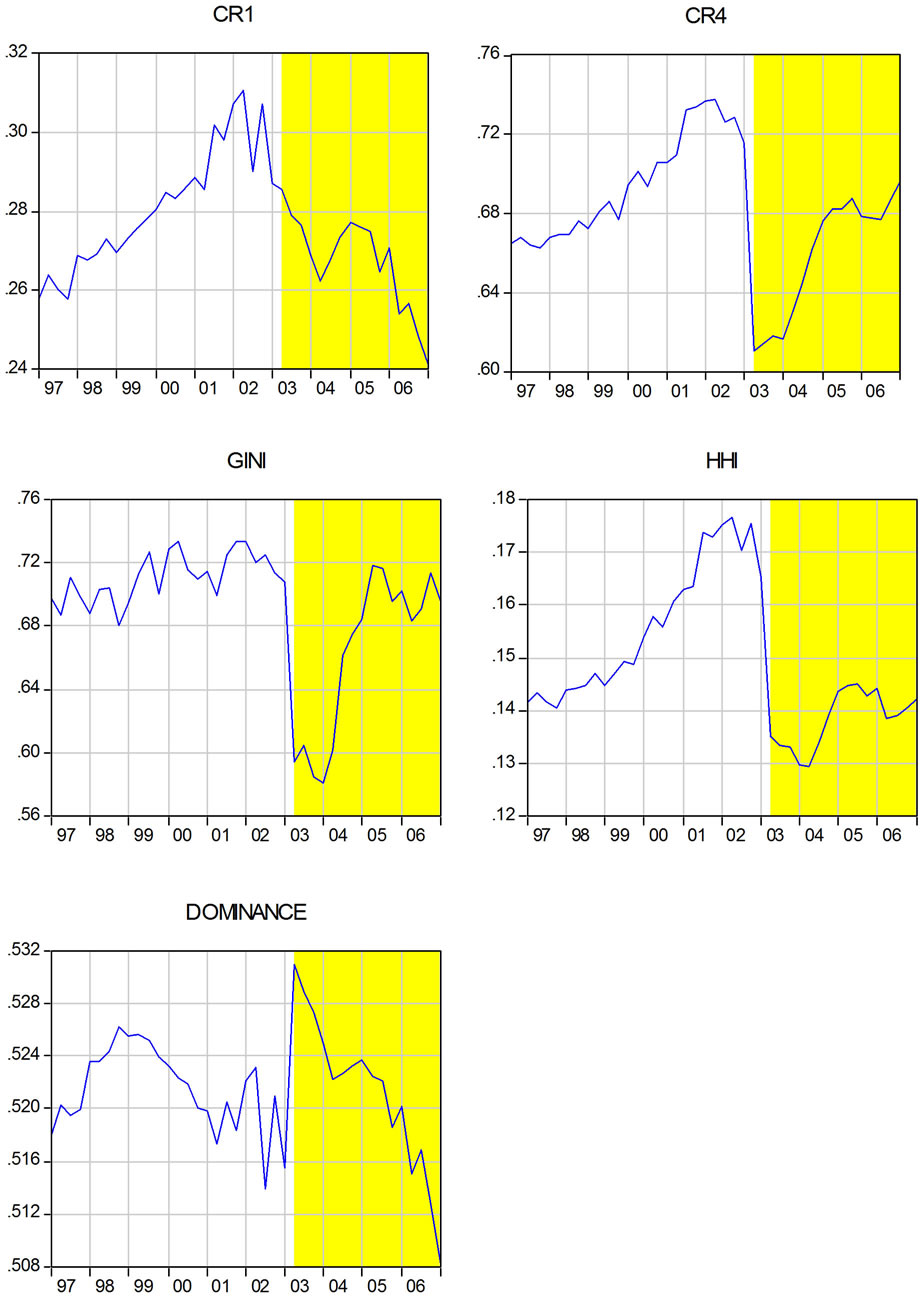
Figure 6(a) gives the cross section market concentration and dominance measures for package shares at each time point in the sample. The results are interesting. The one firm dominance has decreased after policy change. CR1 increases during the pre-policy period from 26% to 31% but during policy period it decreases to 24%. CR4 gives a different view of firm share concentration. It decreases first sharply in the beginning of the policy period but increases back to the pre-policy level of 70% later on.
The Gini coefficient nicely sums up the behaviour of CR1 and CR4. It first has a large jump downwards at the
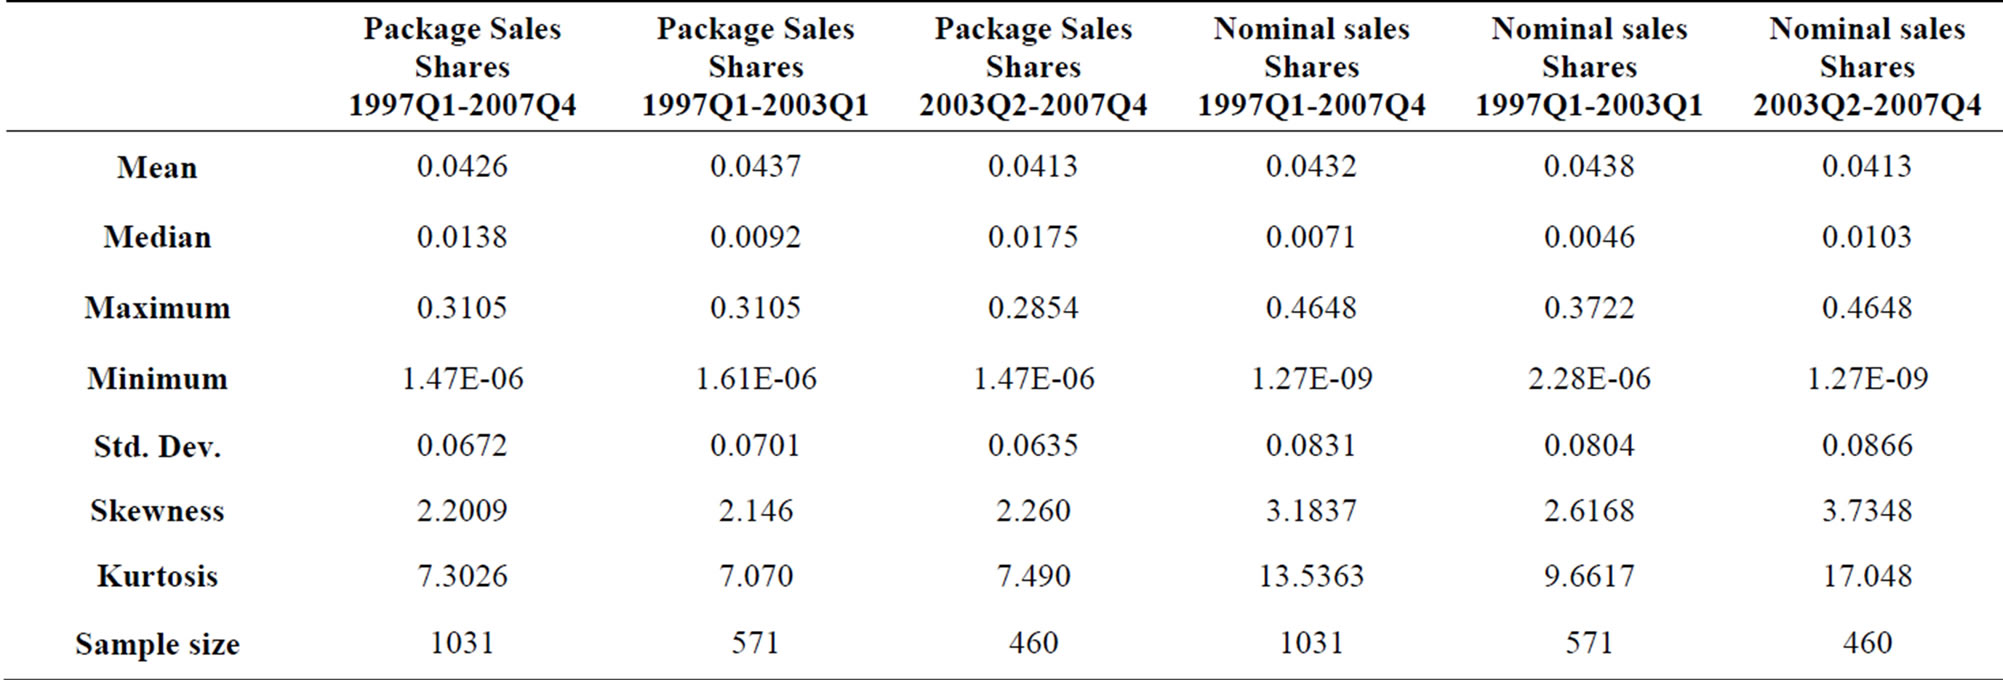
Table 1. Summary statistics of firms’ package and nominal sales shares 1997Q1-2007Q4.
 (a)
(a)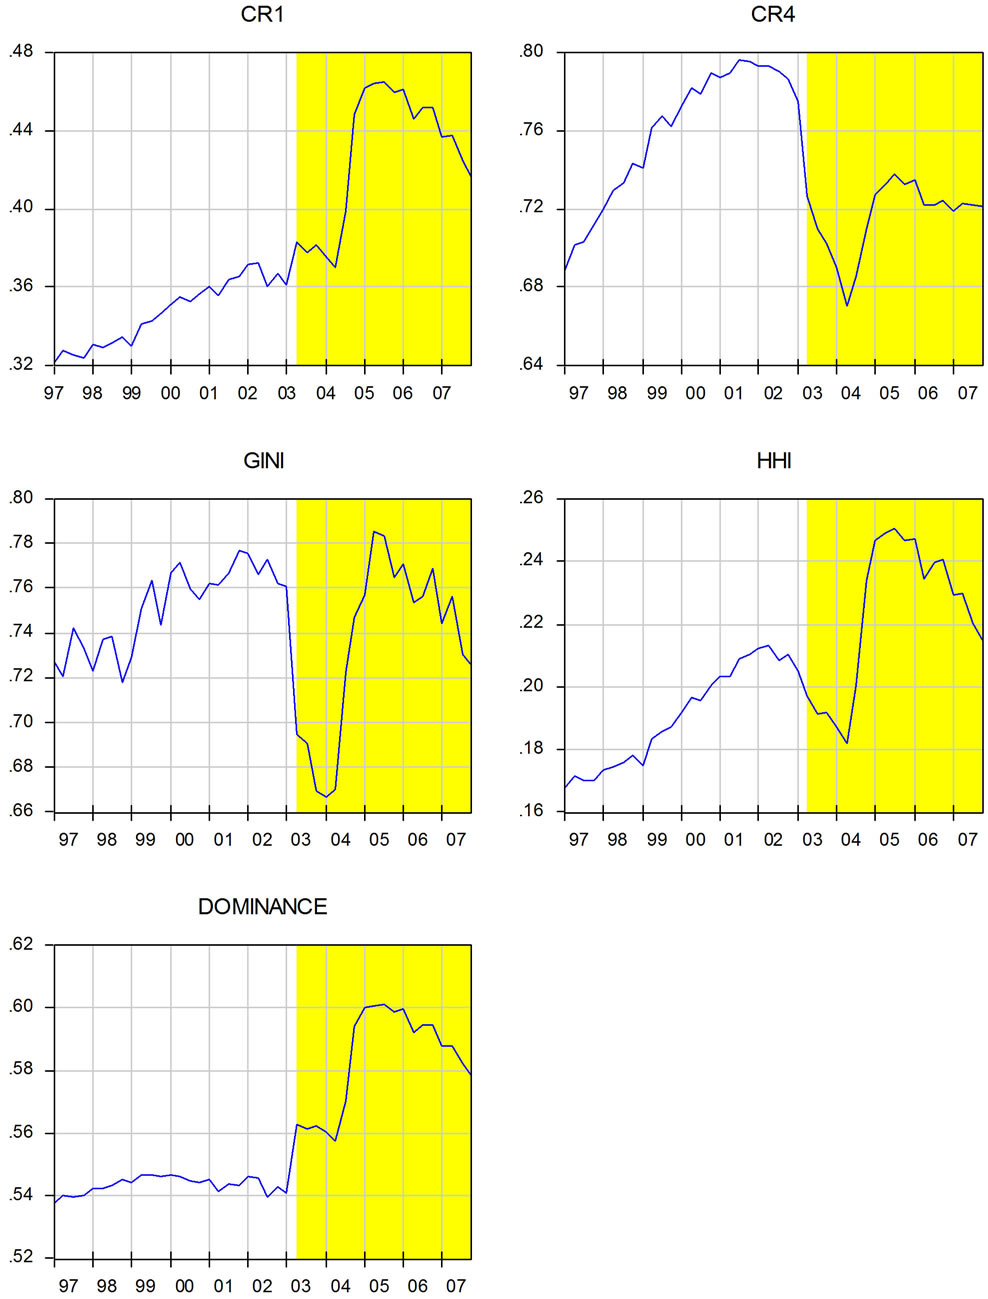 (b)
(b)
Figure 6. (a) Values of concentration indices by time for package shares; (b) Values of concentration idices by time for nominal sales shares.
beginning of the policy period but afterwards it stabilises at the level of pre-policy period. If the Gini coefficient were our only measure of market share inequality we infer that the substitution policy has decreased the share inequality only temporarily. Note that HHI measurements conflict with the results of the Gini coefficients. HHI shows that the market concentration has decreased during the substitution policy period. Finally, the dominance measure confirms the results given by the other measures. The package share market dominance and concentration have decreased since the price lowering generic substitution policy started in Finland on the 1st of March 2003.
The results of concentration analysis for nominal sales shares are different (see Figure 6(b)). Contrary to the results with package sales shares the nominal sales shares show increasing market share inequality and dominance during the substitution policy period. Only CR4 measures show decreasing concentration during the policy period. The result differences in Figures 6(a) and (b) can be explained by the fact that the prices matter in the nominal sales shares. Evidently the dominant firms still exercise their market power in price setting after the policy change.
4.5. Market Share Inequality and the Number of Firms
In the method section of the paper (see Section 3) we argued that the structure of concentration measure  entails that “iso-concentration” curves have a positive slope in (I,N)-space and that concentration C increases because of increased firm share inequality (I) with a given number of firms (N). Figure 7 below shows that these properties are only partly fulfilled for the used index values. Figure 7 depicts the non-parametric regression fits between different inequality measures and the number of firms augmented with marginal density estimates for the variables.
As Figure 3 showed earlier, the number of firms was highest during the policy period and we have shaded the region with these values in yellow in Figure 7. The re-
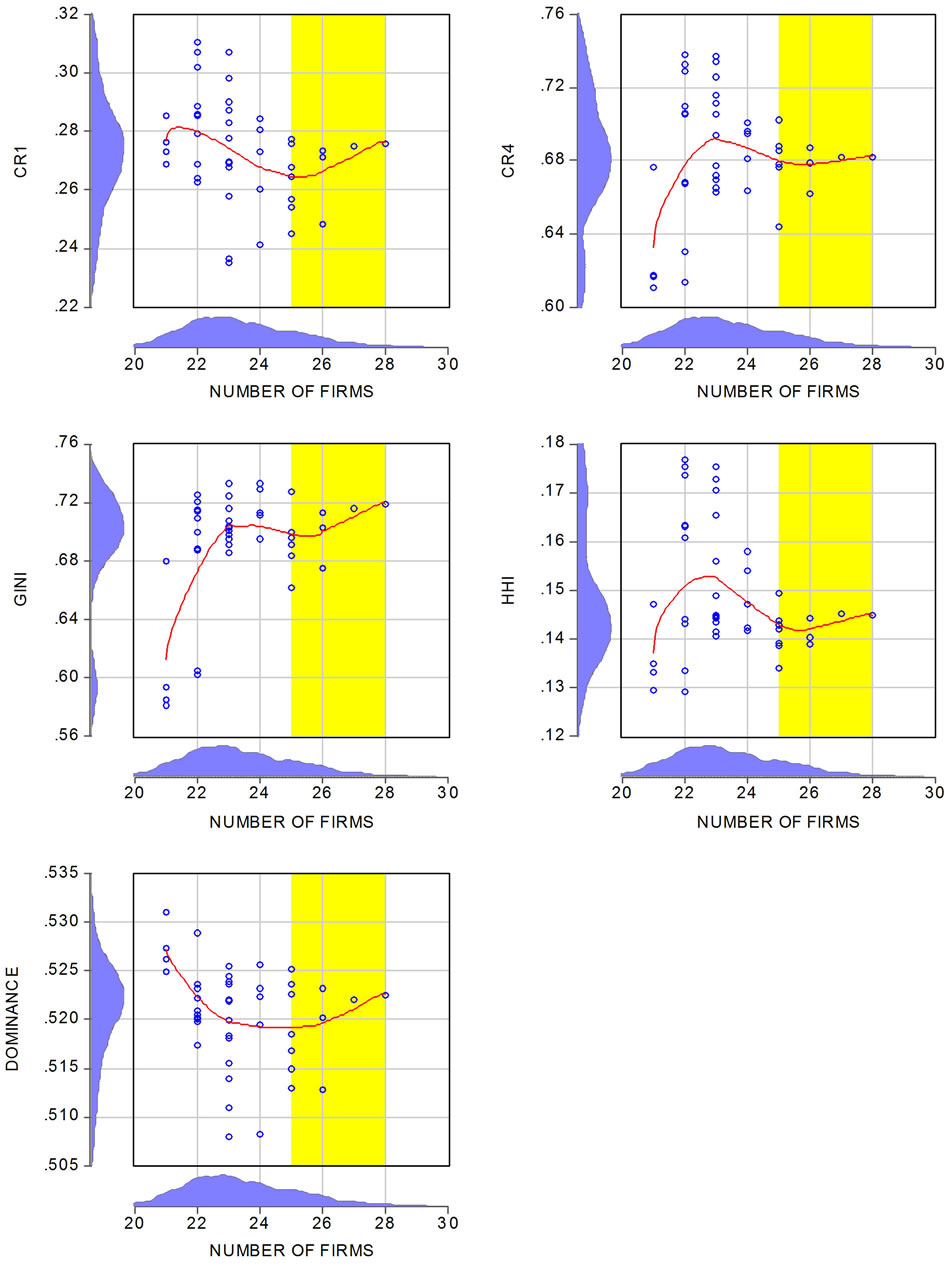
Figure 7. Non-parametric regressions for package share concentration indices on the number of firms.
sults indicate that substitution policy that started on the 1st of March 2003 has not increased market concentration; that is, competition deferring effects, like market share inequality, are not observed. The same regression analysis for the nominal sales shares is found in Appendix. The results show once again that, except for CR4, market concentration and inequality increased during the policy period.
4.6. Policy Effects on Whole Market Shares
In order to give a more compact view of how substitution policy affects firms’ market shares we cast the analysis in the panel regression framework. As the package share distribution has a long right tail we use logarithmic transformation in this context. Log of package shares  is regressed on time trends controlling for unobserved time effects, and on policy dummy variable (POLICYt) taking a value of 0 before the substitution policy and a value of 1 after the policy started. We added also a trend variable starting at 2003Q2 to model the policy period share time effects. The model has the following form
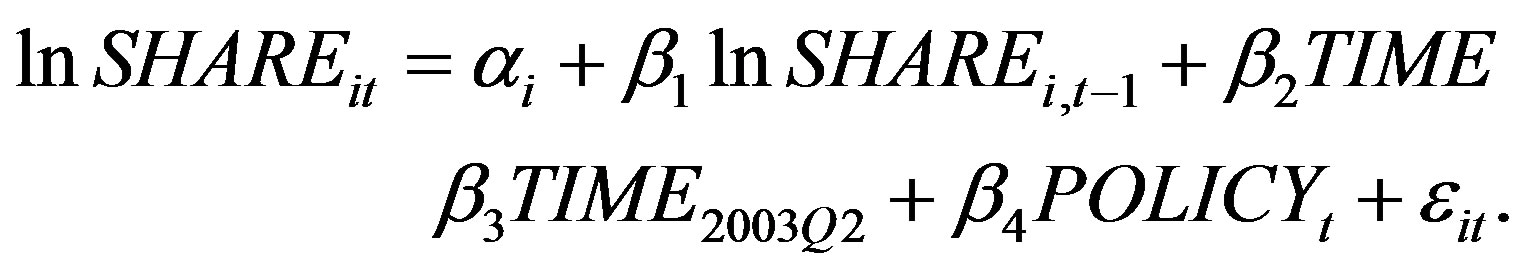
The model is a dynamic fixed effects model with firm dummy variables  to control for firm level share heterogeneity.
The AR(1) specification for endogenous variable is included to handle the strong autocorrelation in shares. The model is not expected to provide unbiased estimates for model coefficients because of the lagged endogenous variable in the right hand side of equation. The bias of magnitude of  can be significant in some cases as our panel data is unbalanced with short periods for some shares. However, this problem is secondary compared to general specification problems of finding a suitable model to policy change effects [26].
The results in Table 2 show that direct policy effects are positive indicating a 66% increase in average share due to the substitution policy. In comparison to the concentration results earlier, this result is conflicting. However, such a comparison is not correct since concentration indices measure market inequality but above type regression models how all package shares—both large and small—in the sample react in average to policy change when we also control for observed downward shift in shares during the policy period. Estimate for TIME2003Q2 has a value of –0.66 at the end of the sample period (i.e. T = 44) with size effect of –48% on shares. Thus the estimation result for the POLICY variable gives the counterfactual argument that shares would be 66% higher if the policy change had not happened in spite of the fact it happened. Thus the overall effect of policy change is close to 18% increase in average firm market shares. Note the regression result for log of nominal sales shares does not differ from the results in Table 2 (not reported).
4.7. Number of Firms and Substitution Group Market Shares
The other dimension of competition between the firms takes place in the drug substitution groups. These groups are built up by drug authorities to foster competition between beta blockers having similar active ingredients or treatment effects. The price margins set by authorities for groups are determined by the cheapest product price in each group. The substitution groups form a new dimension for the market because firms are forced to meet other firms in the groups with highly substitutable products. This has a clear effect on their market shares inside the groups and between the groups—that is, the whole market shares. As the firms’ drug product diversity is not large in the beta blocker market, they can operate only in a few substitution groups at the same time. Thus the number of firms in each substitution group is not expected to be as large as in the whole market. Figure 8 gives the average number of firms across the substitution groups. The number of firms has increased during the policy period but this has only been a temporary phenomenon. There is a connection to the number of firms in the whole markets (see Figure 3) but also the number of substitution groups is larger in the policy period than in the pre-policy period. In response to the policy change the authorities have also formed some new groups.
4.8. Firms’ Package Shares in Substitution Groups
In this context interest lies more in the firm package
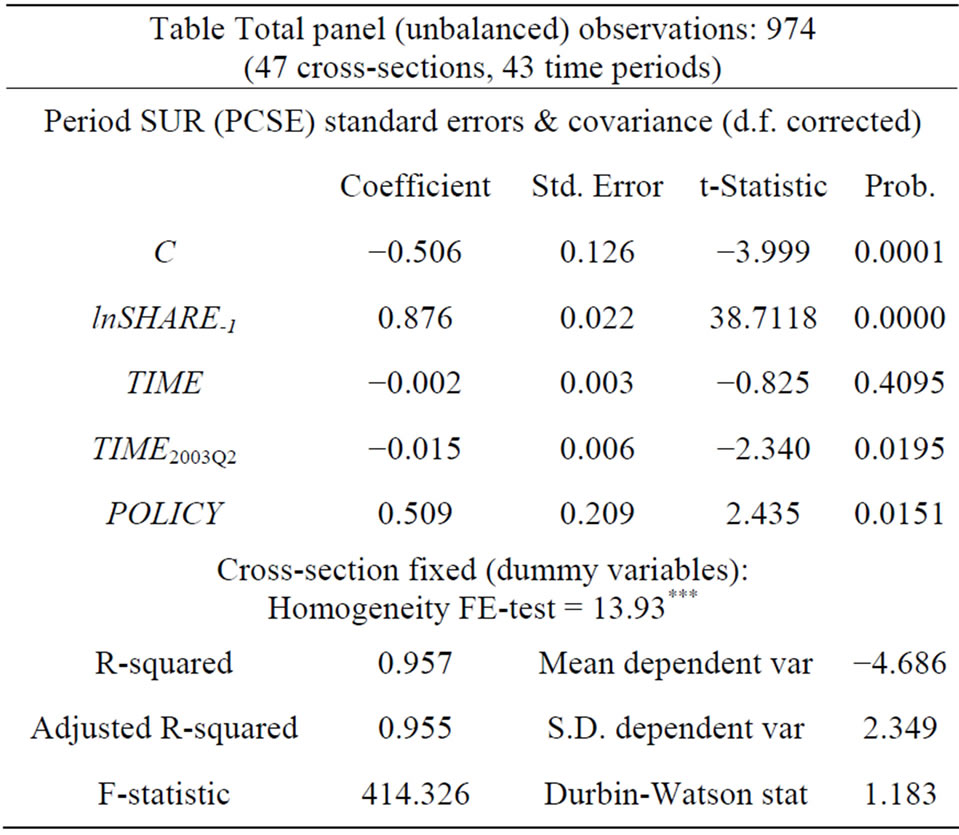
Table 2. Policy effects on log of package shares.
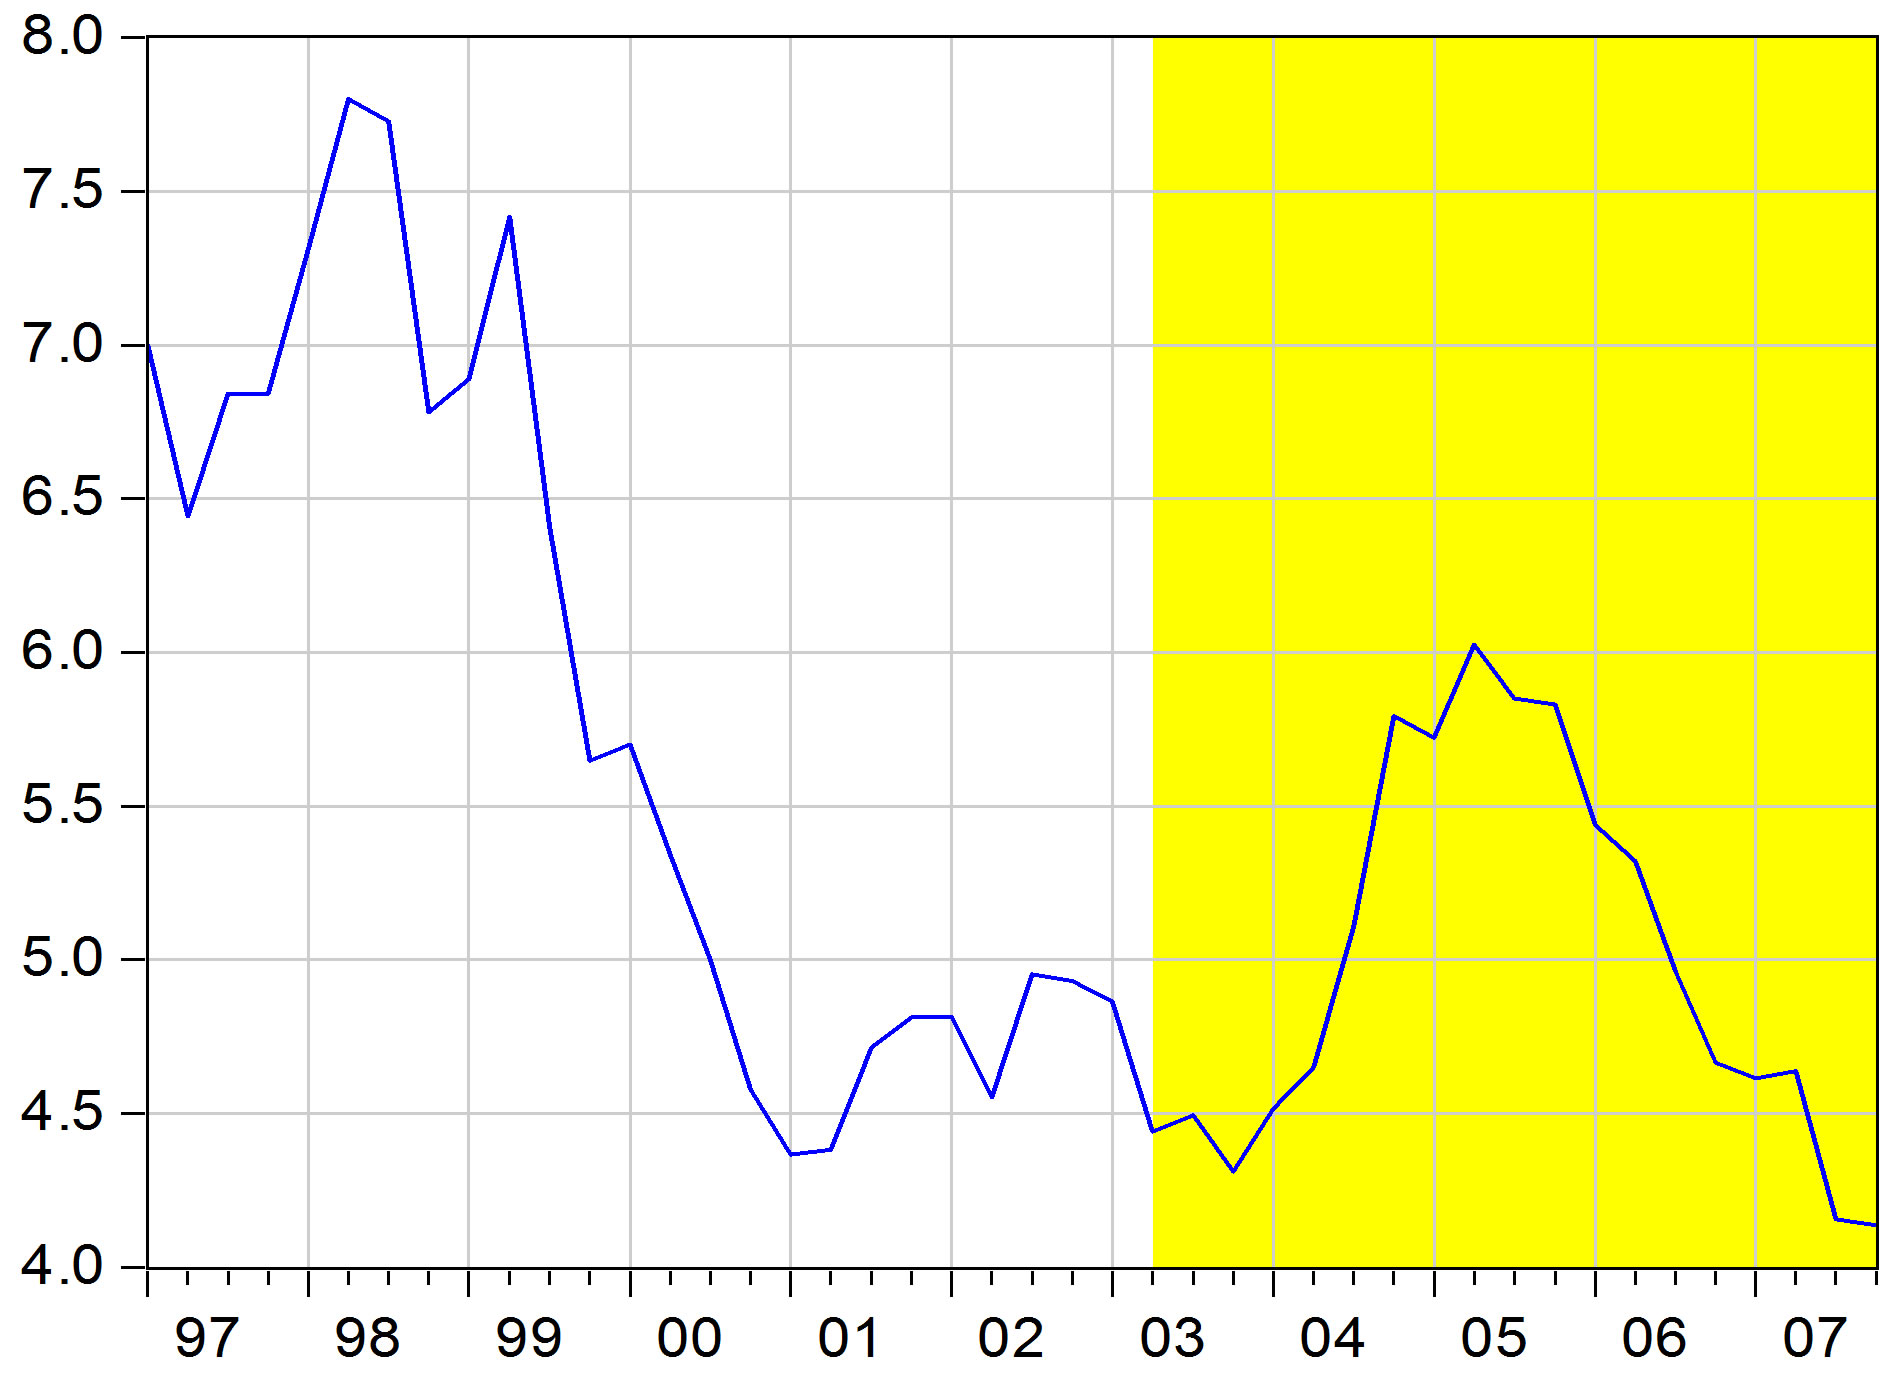
Figure 8. Average number of firms in substitution groups by time.
shares in different substitution groups than in the firms’ shares across the substitution groups. Figure 9 gives the means of cross section substitution group package shares in the sample period. Comparing this with whole market mean shares (see Figure 3), we observe that substitution group mean shares are much higher.
The distribution analysis of group package and nominal sales shares shows that the histograms (Figure 10) are two peaked with peaks close to zero and one indicating that some dominant firms are sole sellers in some groups. The differences in share distributions before and after the policy change and between the package and nominal sales shares are not large (see Table 3).
However the concentration indices are sensitive to the substitution policy (see Figure 11). They all show a clear drop in the index values during 2003 as a response to policy change. The values are still at high levels during the policy period for CR1, CR4 and Dominance indicating that significant market share inequality and concentration are present in the substitution groups. The figure for nominal group sales shares indices are close to those in Figure 11 (not reported).
Note that declining market shares were not found in the brand protected substitution group 0 where policy is not conducted. Figure 12 gives the concentration indices in group 0. The number of firms declined during the sample period from 20 to 9 in this group.
4.9. Policy Effects on Group Market Shares
Substitution group approach enables us to use the difference-in-difference (DD) approach to test policy effects in the quasior pseudo-treatment framework. As the substitution policy is not exercised in group 0 we can treat it as control group, and the rest of the groups compromises a treatment group where the policy change (treatment) started in 2003Q2. The typical DD-test model has the following panel data form [26].
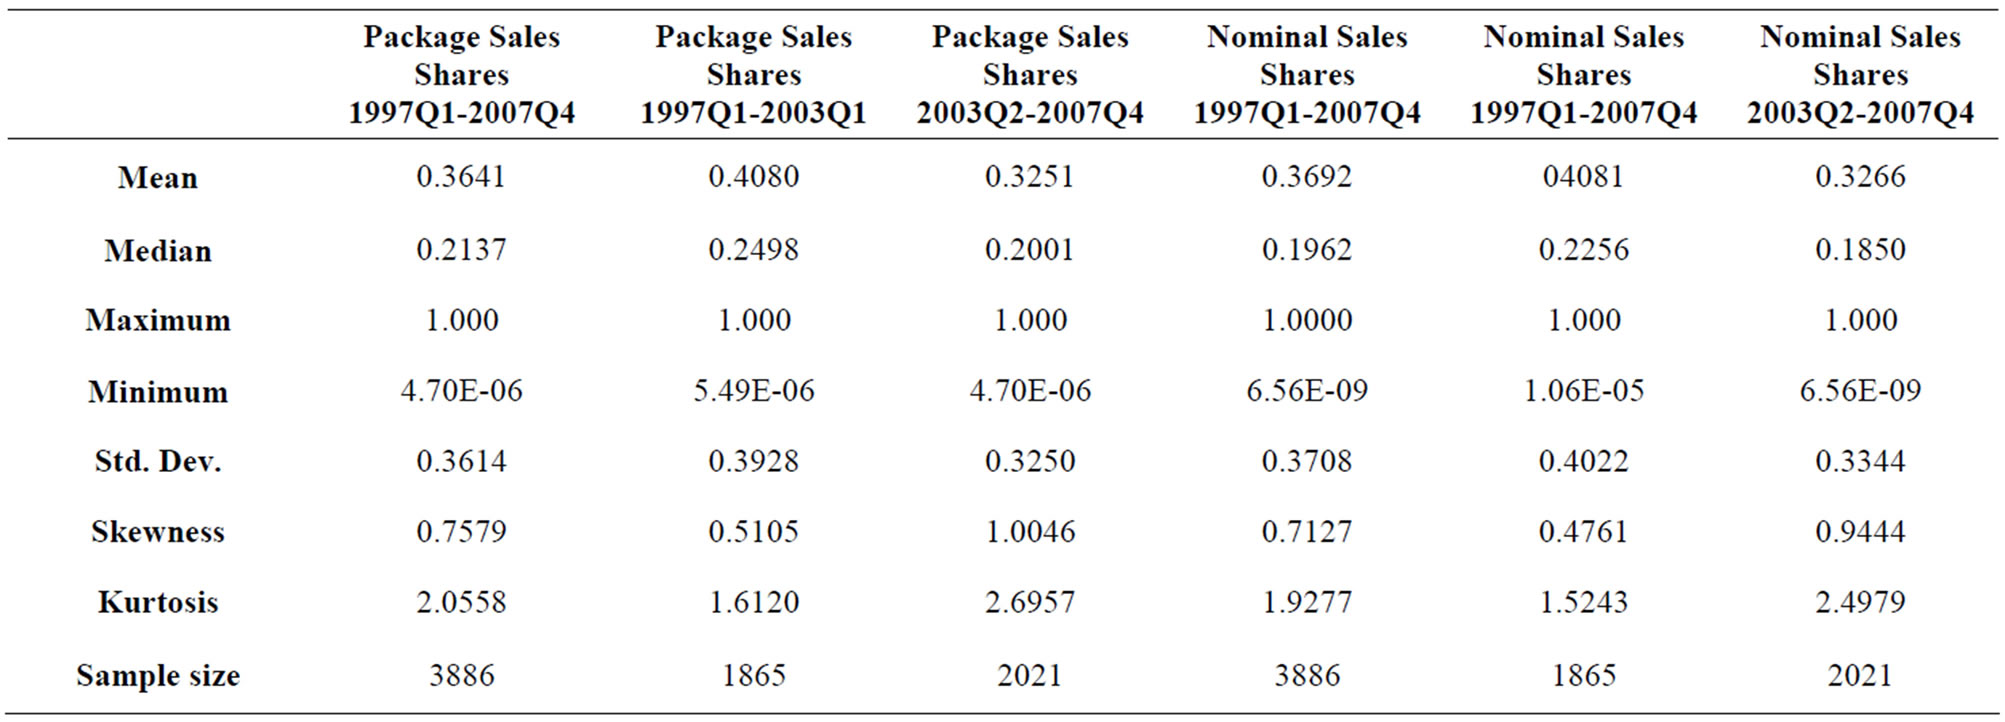
Table 3. Summary statistics of group package and nominal sales shares.
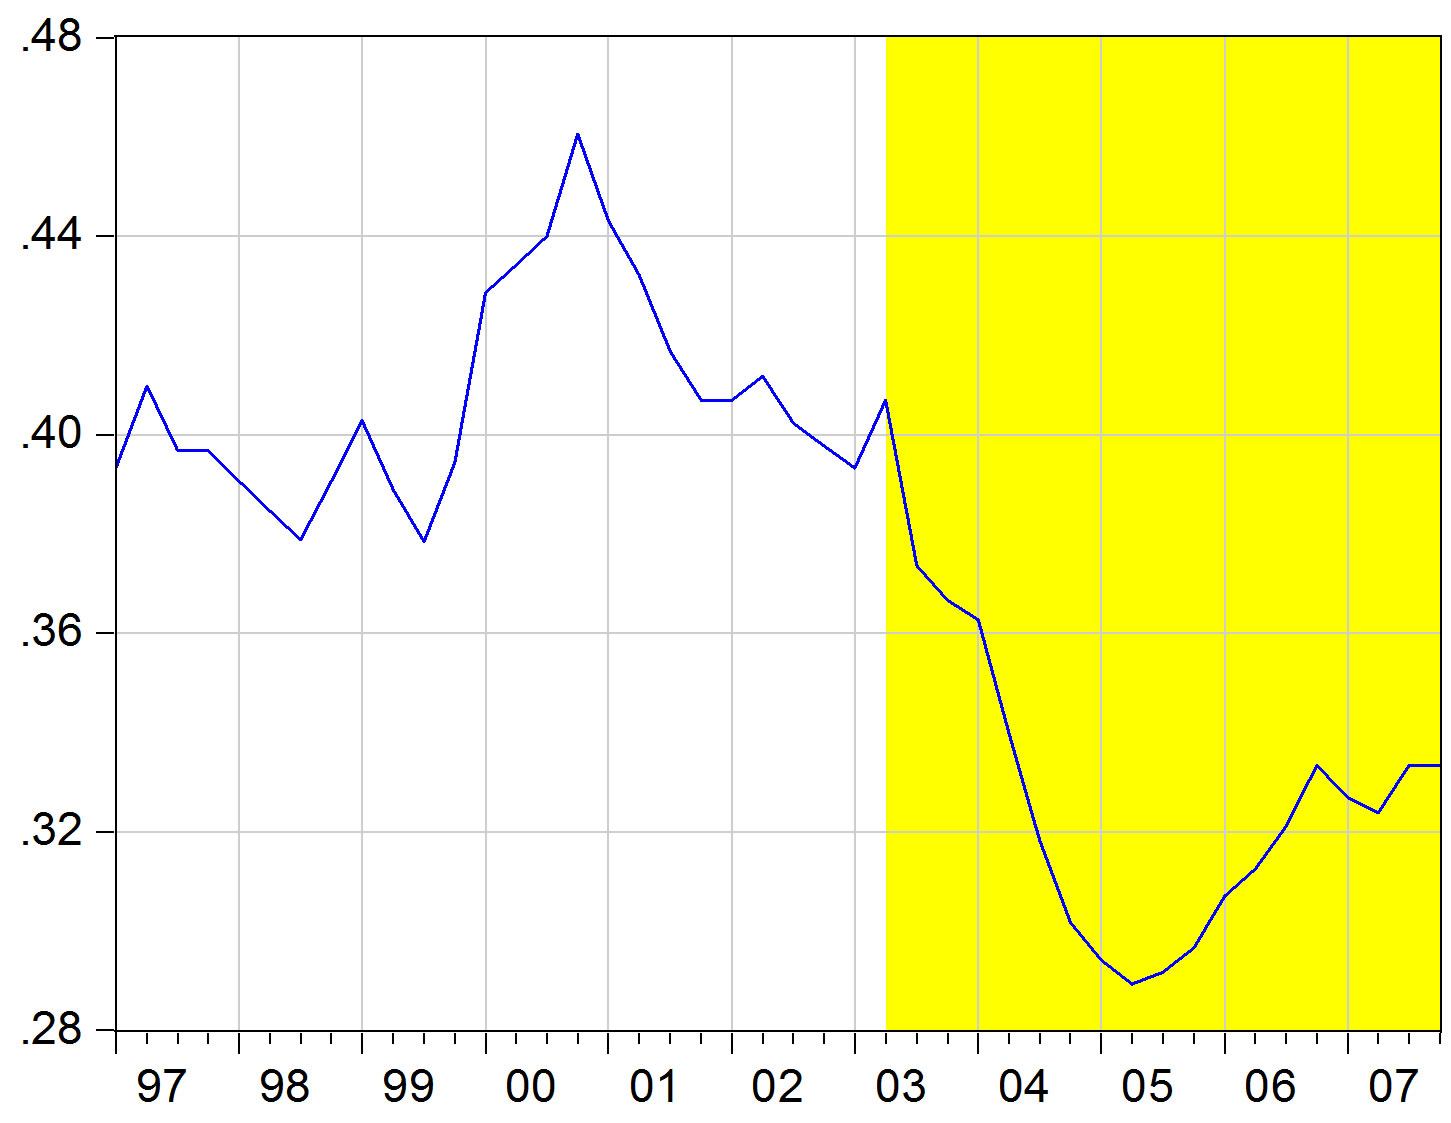
Figure 9. Means of group package shares by time.
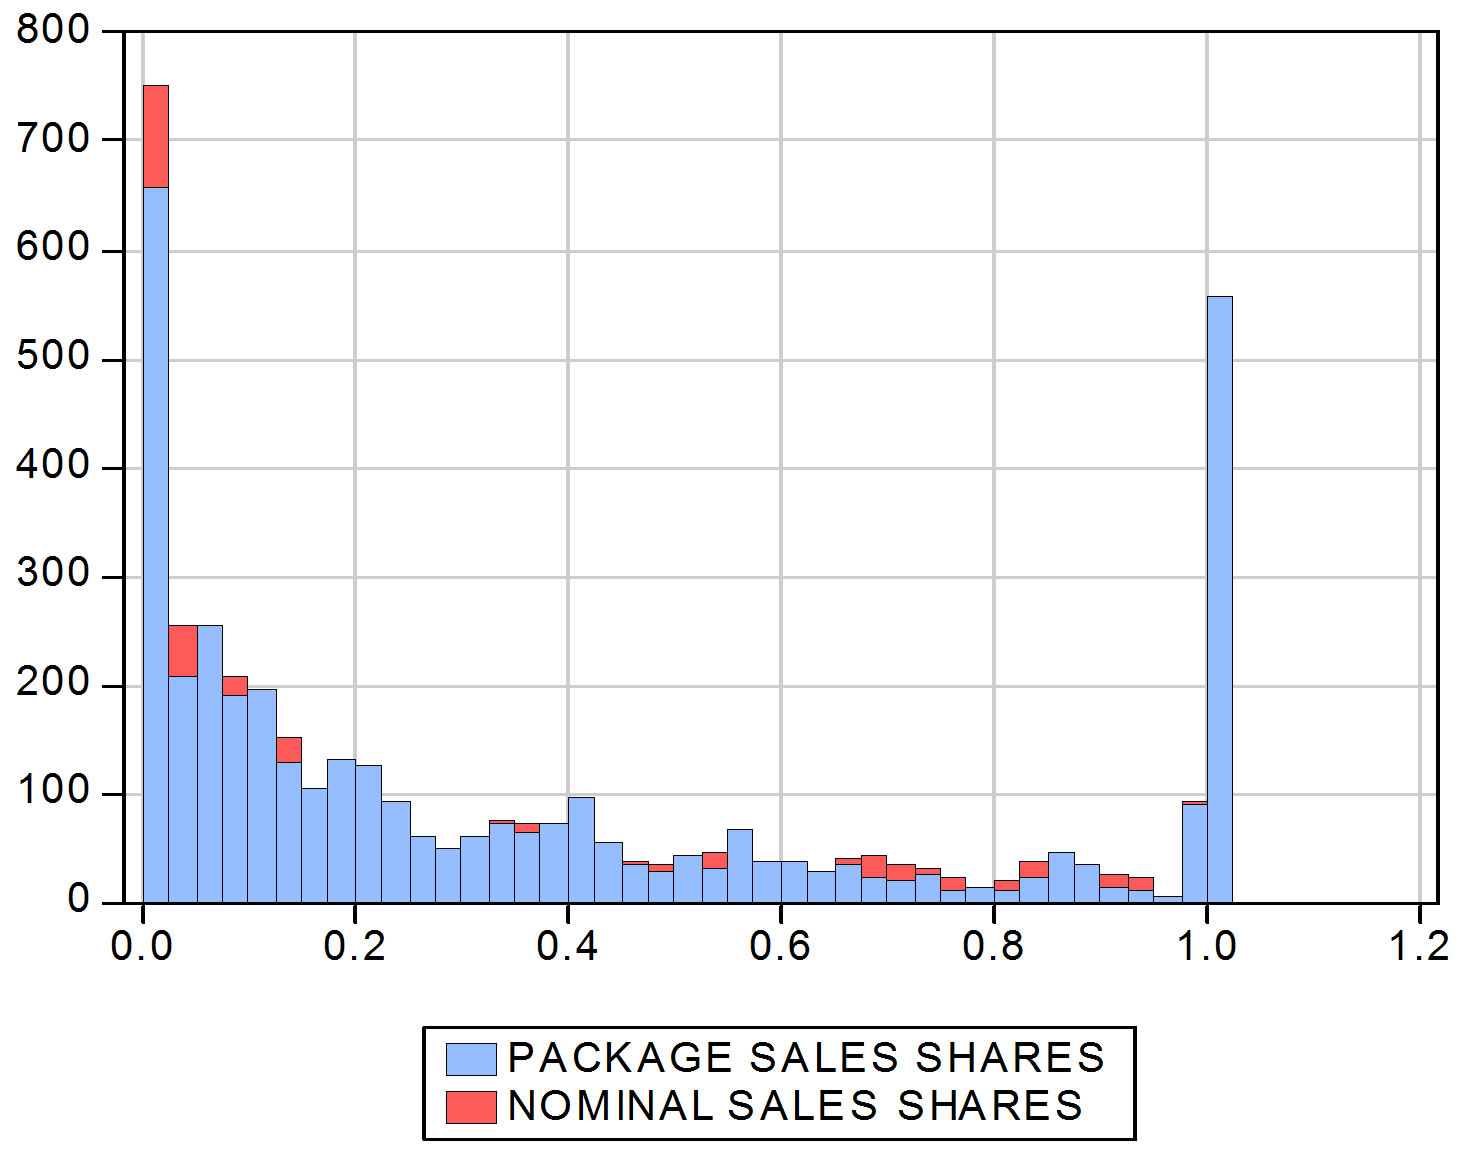
Figure 10. Histograms of group package and nominal sales.
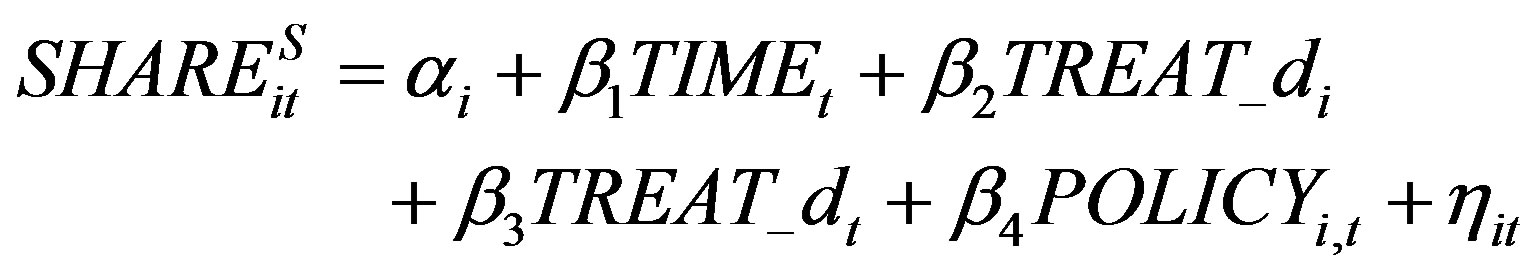
where TIMEt is the time trend,  gets value of 0 for substitution group 0 and value 1 for the other groups,
  gets value 1 starting from 2003Q2 and value 0 before it, and
  is defined as
 . Thus, if we take the time difference for the model part that entails only the treatment group observations we have
 . For the con
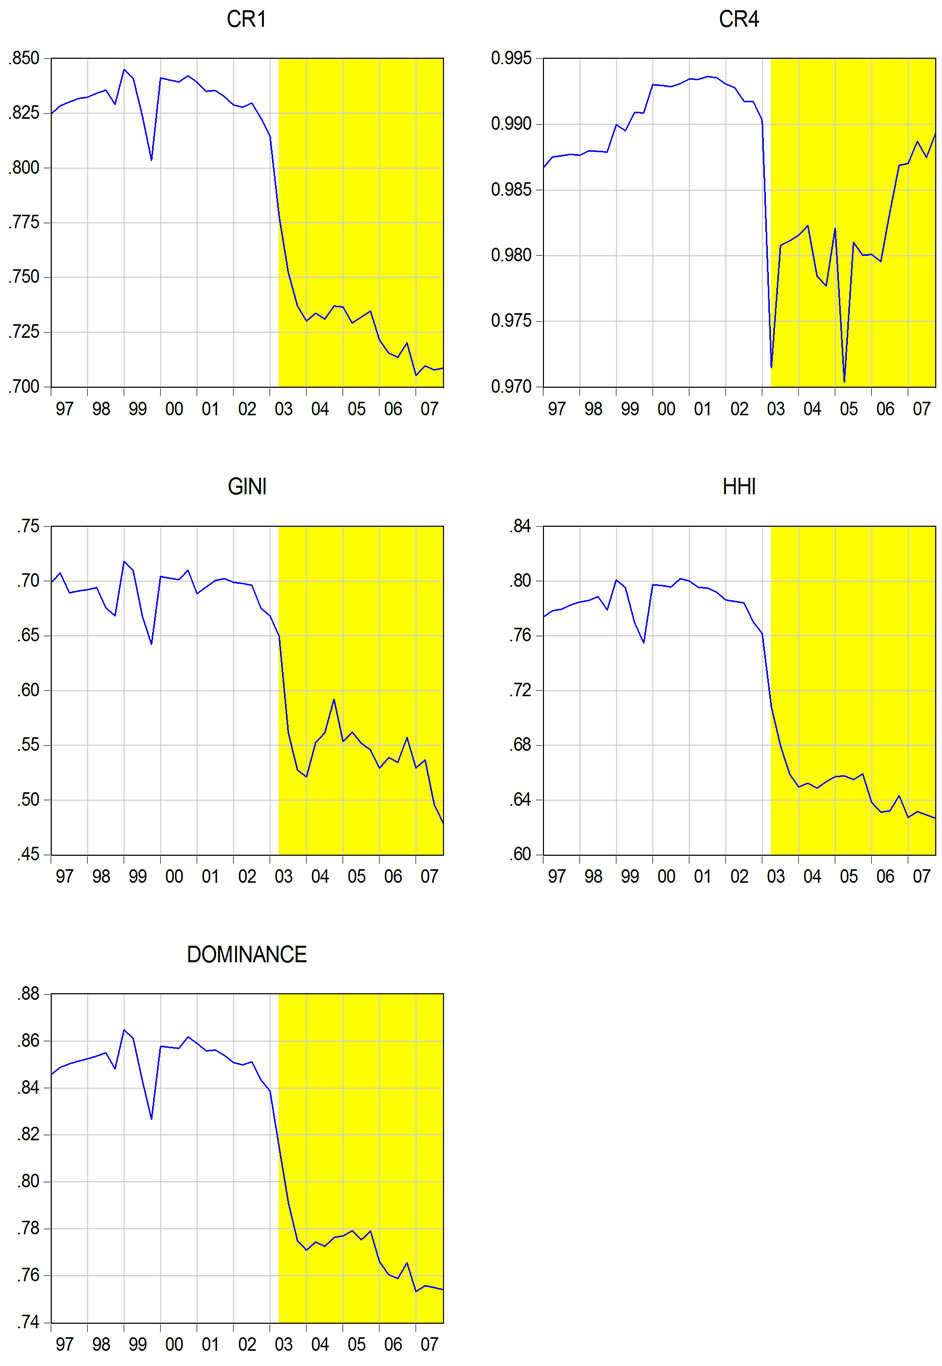
Figure 11. Means of group concentration indices of package shares by time.
trol group observations time difference gives .
.
Subtracting these from each provide the DD-estimate  for the policy effect. We estimated the DD-model in the fixed effects panel form.
  variable was excluded because of multi-collinearity.
The results in Table 4 show that the substitution policy has decreased group market shares in average with a
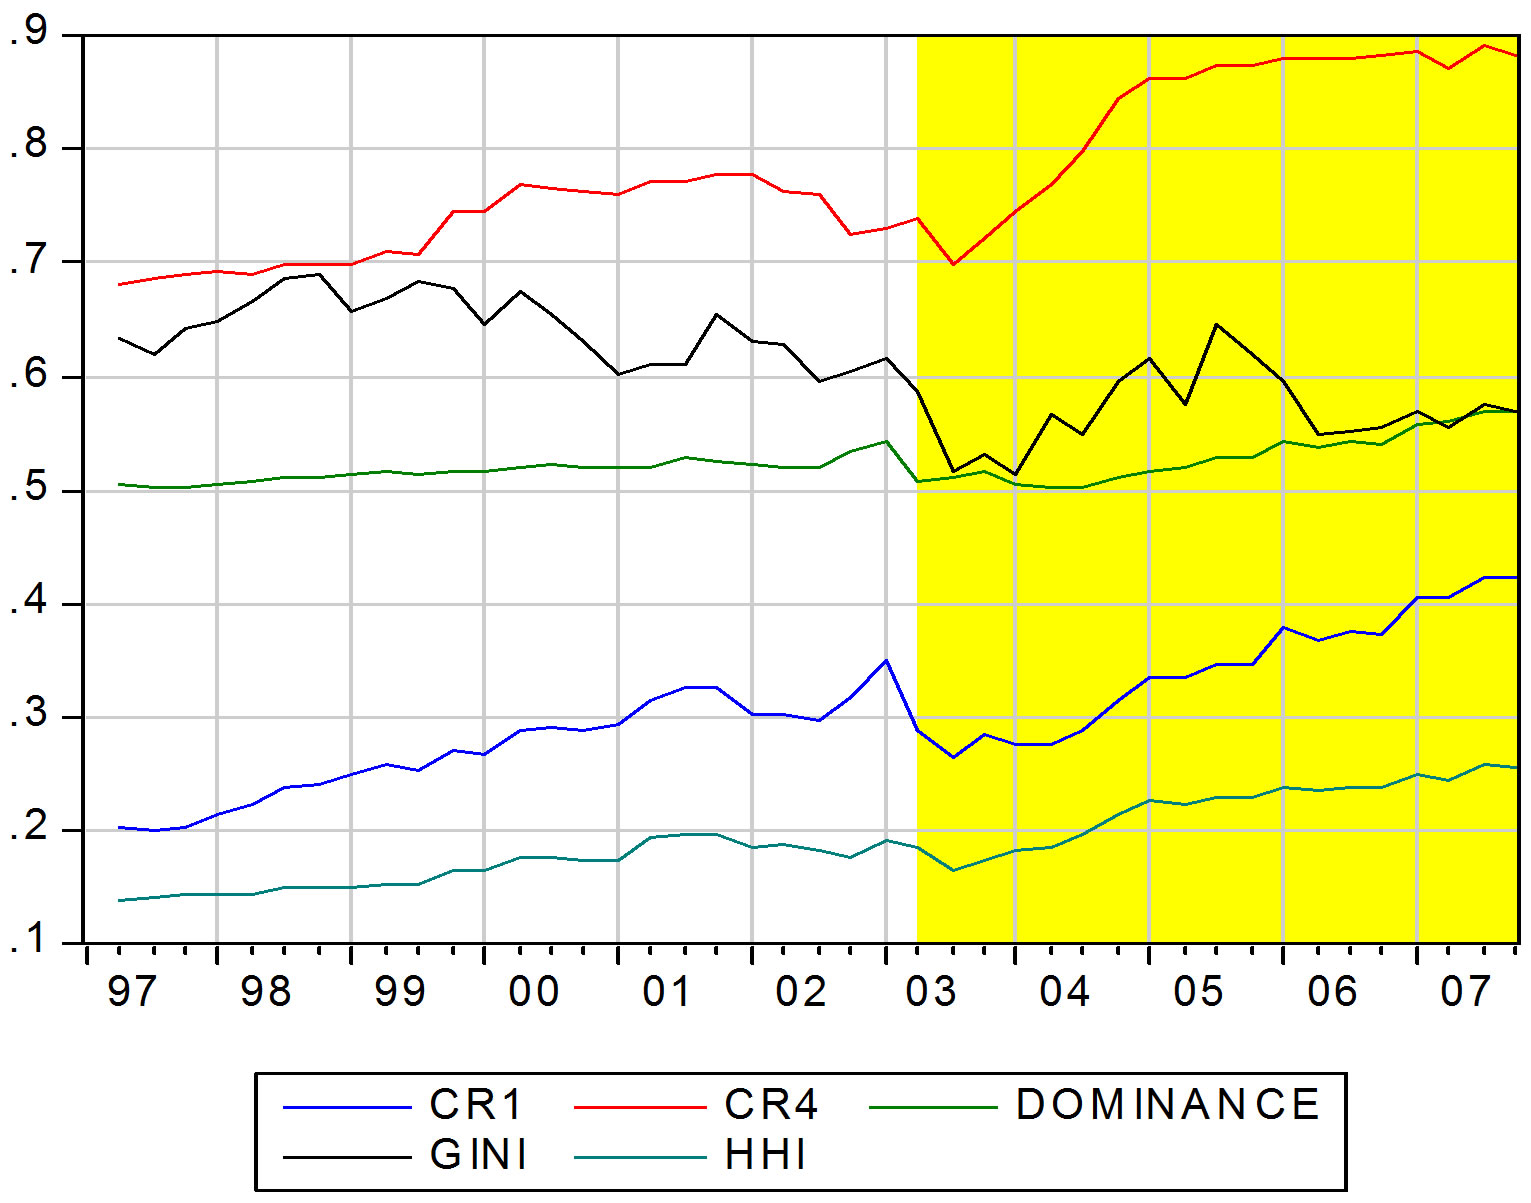
Figure 12. Concentration indice values in substitution group = 0 by time.
value of 0.19 compared to the non-policy group’s average level of 0.48. The result is line with results from the graphical and concentration analysis. Results (not reported) for nominal sales shares are close to the results in Table 4.
5. Discussion
The results obtained for the whole Finnish beta blocker market and substitution group markets with package shares are not in conflict with each other. The introduction of generic substitution on the 1st of March 2003 has led to less unequal markets. However, with nominal sale shares we encountered a conflicting result. The concentration indices for nominal shares indicated that there was less market equality after the introduction of substitution policy in March 2003 but this was not found for the substitution group specific markets. However, the anomaly is not a real one because it is quite clear that whole market firm share dynamics must be different from the substitution group share dynamics. Note that group shares are not firm specific. They are the average shares of firms operating in each group but the firms operate in many substitution groups. Firm-specific whole market shares can be derived from the firm-specific substitution group shares by adding them with corresponding group weights, but the average group shares are not explicitly related to any whole market firm shares. Thus share distributions of firms’ group shares are quite different from group share distributions.
We argue that the group shares are important in this context. Note that the situation is complex as the authorities also form new groups with different firm combinations, and firms entering and exiting the groups still operate in some other groups. The sizes of total market shares compared to the substitution group shares are very different. In addition, the content of substitution group 0 is also unstable during the sample period. The number of share observations in this group is highest (74) in
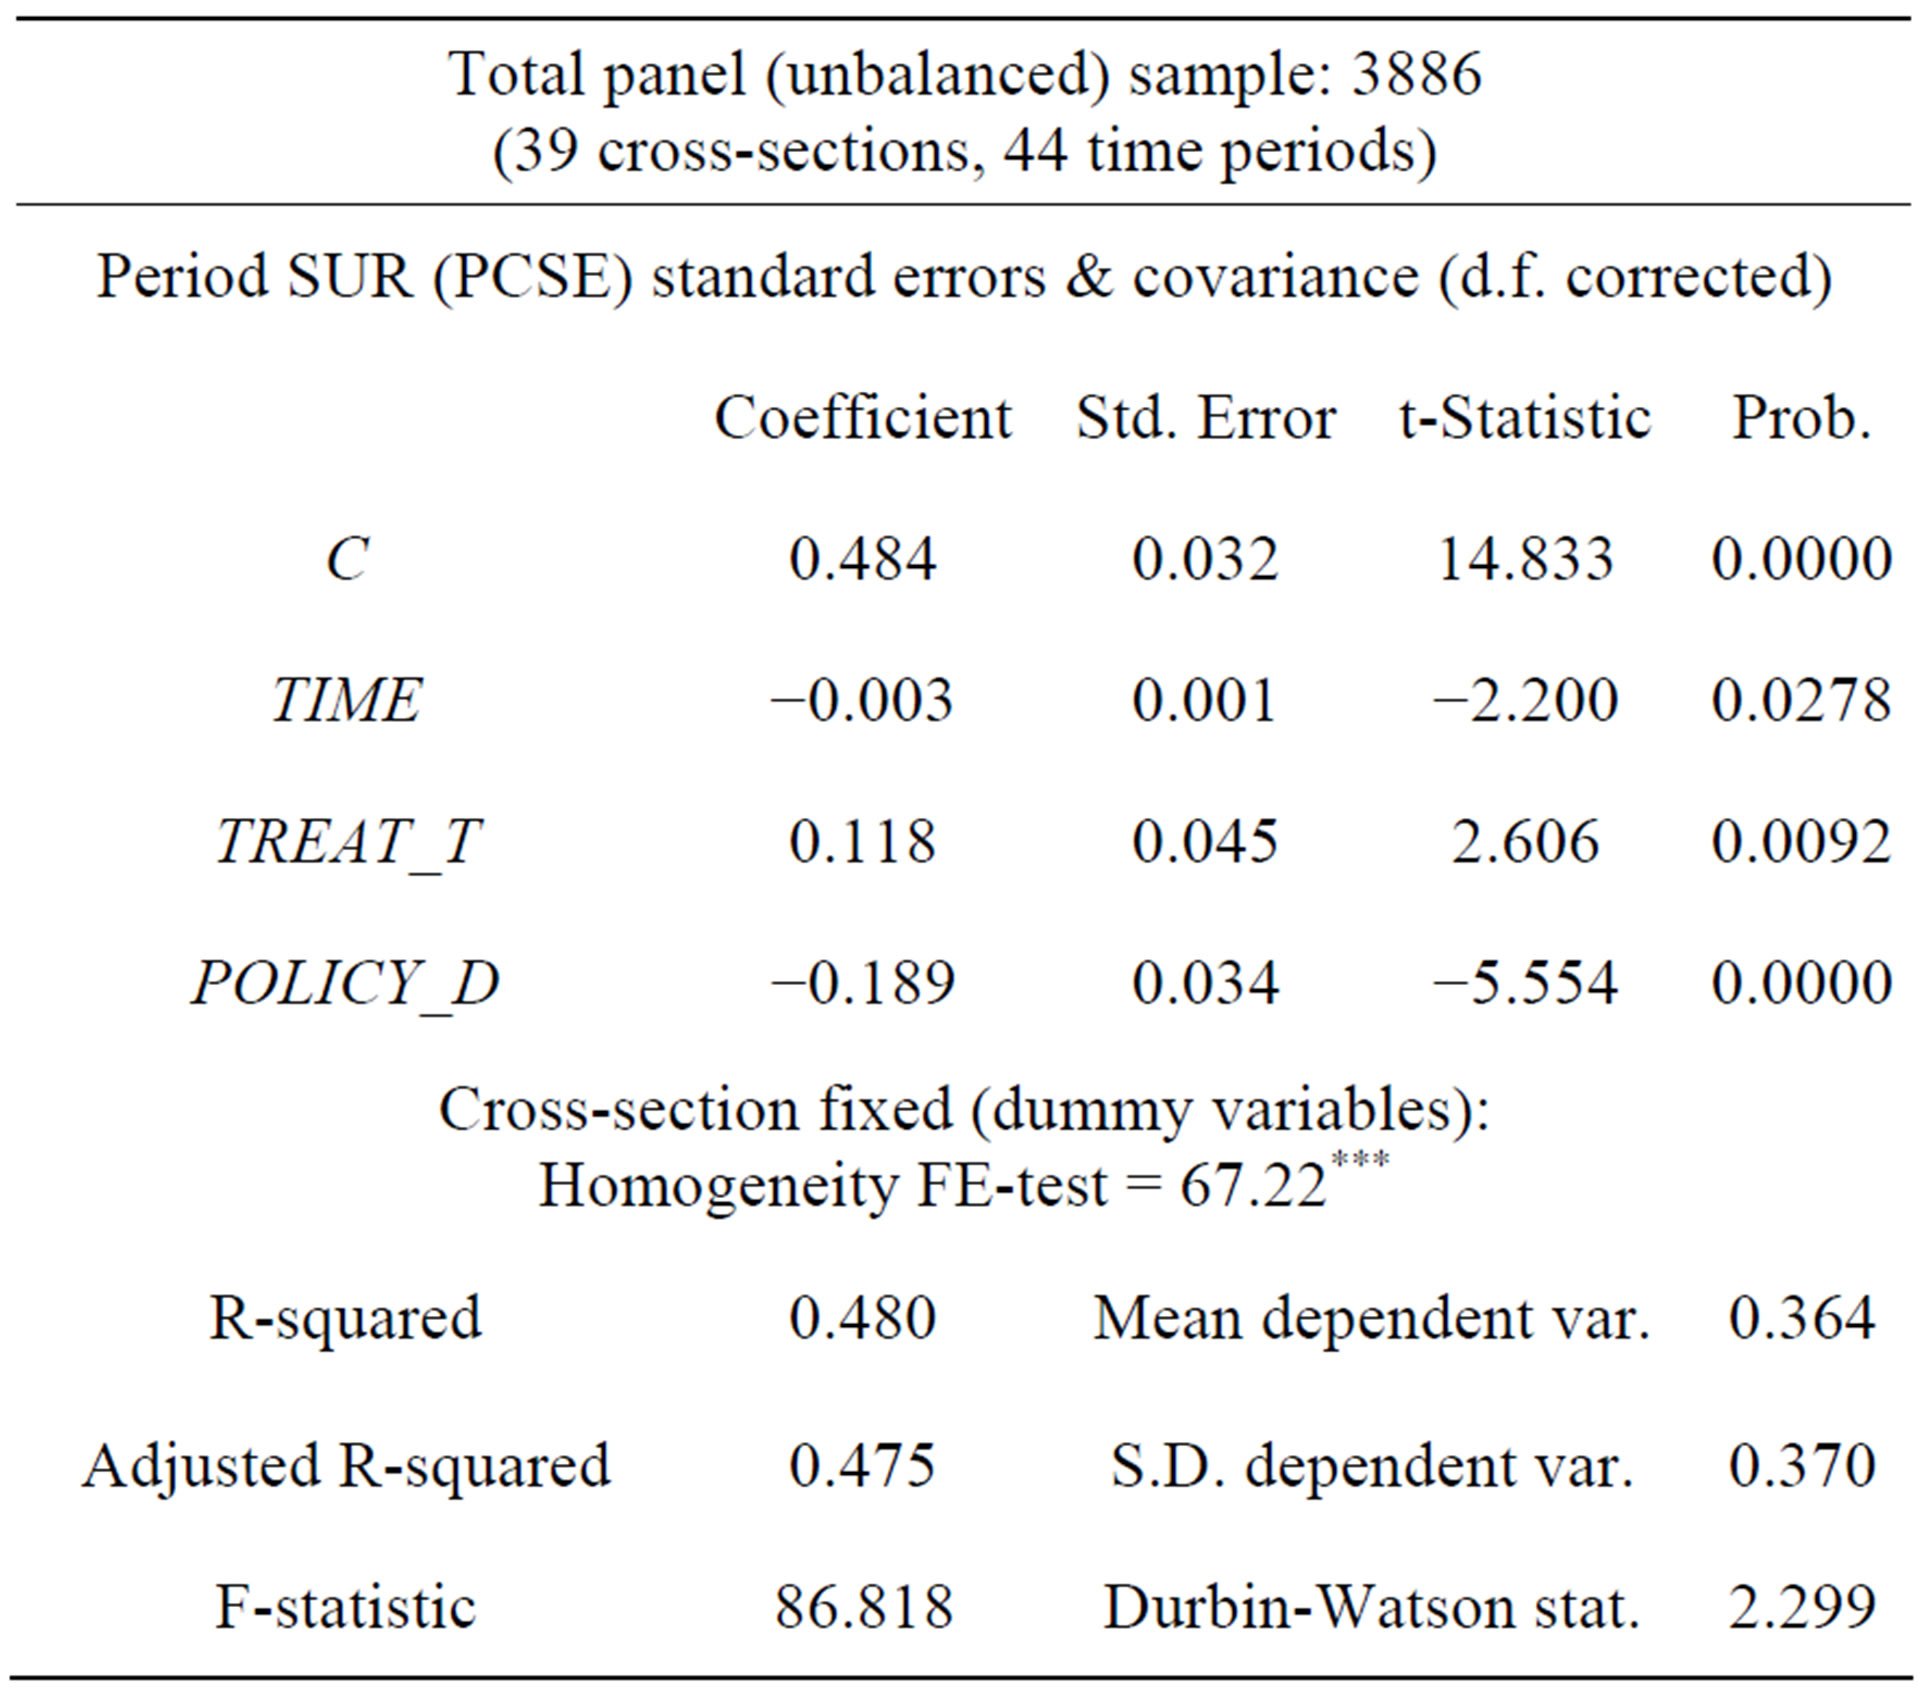
Table 4. Policy effects on substitution group package shares.
1997Q1 and it declines to 17 observations at the end of sample (2007Q4) because of the decrease number of firms in the group. Less new protected brand names are introduced into markets and market concentration is increasing in the group 0. However, excluding group 0 from the general group analysis has not an effect on obtained results above.
A more transparent way to understand the diverging share results is to observe that competition in the substitution groups is regulated by the drug authority by group formation based on the similar active molecules. There is no information available concerning the possibility that groups are also built up targeting equal market shares in groups. However, price competition inside the substitution groups should lead to more equal shares if the firms follow the group’s price bands and react to other firms’ pricing rules. Note that other pricing strategies can be used also. Firms can hold-up with brand loyalty and use own generics policies. Evidently some brand names with large total market shares conduct pricing policy above the price bands. This can also explain the increasing inequality of nominal shares in whole markets during the policy period. Thus the analysis that uses nominal shares must also pay attention to firm level prices as an explanation for increased concentration.
6. Conclusions
The conducted two dimensions of market shares analysis led to the conclusion that firm level concentration with nominal shares has not declined in the entire Finnish beta blocker market in response to generic substitution policy which started on the 1st of March 2003. The results with firm-specific volume sales shares (i.e. package shares) in the whole market showed that the beta blocker market was more equal in the policy period compared to prepolicy market period. These results were partly not supported by the panel regression approach with policy period trend and policy dummy on log of firm shares. When the share analysis is cast in the substitution group level dimension—that is, how equal are different group’s firm shares—the results showed that policy change has lead to more equal group share distributions compared to the pre-policy period. Difference-in-difference panel regression results did not reject this result.
We argue that the whole market analysis based on the firm-specific data is more important than the substitution group analysis as the firms are the decision-making units in one relevant drug market (i.e. beta blockers) and the competition takes place between the firms in this context. The substitution group is a regulatory framework that enhances the price competition. However, the firms can control their group entries and exits and can pool their different group shares in such a way that their whole market shares are not necessarily eroded. The increased market nominal market shares for dominant firms showed that shares are supported with firm-specific pricing. Thus, although group dominant firms have lost, in average, their pre-policy substitution group market shares during the policy era, firms’ whole market nominal shares have increased. In this context, the target of EU drug policy in Finland has not been successful in spite of success in drug price reductions.
REFERENCES
- D. Dranove and M. A. Satterthwaite, “The Industrial Organization of Health Care Markets,” In: A. J. Culyer and J. P. Newhouse, Eds., Handbook of Health Economics, Vol. 1, Elsevier, New York, 2000, pp. 1094-1139.
- M. Gaynor, “What Do We Know About Competition and Quality in Health Care Markets,” NBER wp-12301, Cambridge, 2006. http://dx.doi.org/10.3386/w12301
- M. Kyle, “Strategic Responses to Parallel Imports,” The B. E. Journal of Economic Analysis & Policy, Vol. 11, No. 2, 2011.
- P. Barros and X. Martinez-Giralt, “Health Economics: An Industrial Organization Perspective,” Routledge, London, 2012.
- G. Perry, “The European Generic Pharmaceutical Market in Review: 2006 and Beyond,” Journal of Generic Medicines, Vol. 4, No. 1, 2006, pp. 4-14. http://dx.doi.org/10.1057/palgrave.jgm.4950041
- D. Simoens and S. De Coster, “Sustaining Generic Medicines Markets in Europe,” Journal of Generic Medicines, Vol. 3, No. 4, 2006, pp. 257-268. http://dx.doi.org/10.1057/palgrave.jgm.4940128
- R. Miraldo, “Reference Pricing and Firms’ Pricing Strategies,” Journal of Health Economics, Vol. 28, No. 1, 2009, pp. 176-197. http://dx.doi.org/10.1016/j.jhealeco.2008.09.006
- J. Puig-Junoy, “The Impact of European Pharmaceutical Price Regulation on Generic Price Competition: A Review,” Pharmacoeconomics, Vol. 28, No. 8, 2010, pp. 649-663. http://dx.doi.org/10.2165/11535360-000000000-00000
- I. Moreno-Torres, J. Puig-Junoy and J.-R. Borrell, “Generic Entry into the Regulated Spanish Pharmaceutical Market,” Review of Industrial Organization, Vol. 34, No. 4, 2009, pp. 373-388. http://dx.doi.org/10.1007/s11151-009-9214-3
- R. Reiffen and M. R. Ward, “Generic Drug Industry Dynamics,” Review of Economics and Statistics, Vol. 87, No. 1, 2005, pp. 37-49. http://dx.doi.org/10.1162/0034653053327694
- M. A. Hurwitz and R. E. Caves, “Persuasion or Information? Promotion and the Shares of Brand Name and Generic Pharmaceuticals,” Journal of Law and Economics, Vol. 31, No. 2, 1988, pp. 299-320. http://dx.doi.org/10.1086/467158
- H. G. Grabowski and J. M. Vernon, “Longer Patents for Increased Generic Competition in the US,” Pharmacoeconomics, Vol. 10, No. 2, 1996, pp. 110-123. http://dx.doi.org/10.2165/00019053-199600102-00017
- L. Magazzini, F. Pammolli and M. Riccabonu, “Dynamic Competition in Pharmaceuticals. Patent Expiry, Generic Penetration, and Industry Structure,” European Journal of Health Economics, Vol. 5, 2004, pp. 175-182.
- K. Podnar, B. Molj and U. Golob, “How Reference Pricing for Pharmaceuticals Can Increase Generic Share of Markets: The Slovenian Experience,” Journal of Public Policy & Marketing, Vol. 26, No. 1, 2007, pp. 89-101. http://dx.doi.org/10.1509/jppm.26.1.89
- D.R. King and P. Kanavos, “Encouraging the Use of Generic Medicines: Implications for Transition Economics,” Croatian Medical Journal, Vol. 43, 2002, pp. 462-469.
- T. Aronsson, M. A. Bergman and N. Rudholm, “The Impact of Generic Drug Competition on Brand Name Market Shares-Evidence from Micro Data,” Review of Industrial Organization, Vol. 19, No. 4, 2001, pp. 425-435. http://dx.doi.org/10.1023/A:1012504310953
- J. Puig-Junoy, “Price Regulation Systems in the Pharmaceutical Market,” In: J. Puig-Junoy, Ed., The Public Financing of Pharmaceuticals, EE Publishers, London, 2005. http://dx.doi.org/10.4337/9781845424664.00011
- D. Bernheim and M. Whinston, “Multimarket Contact an Collusive Behaviour,” Rand Journal of Economics, Vol. 21, 1990, pp. 1-26. http://dx.doi.org/10.2307/2555490
- J. Mestre-Ferrandiz, “The Impact of Generic Goods in the Pharmaceutical Industry,” Health Economics, Vol. 8, No. 7, 1999, pp. 599-612. http://dx.doi.org/10.1002/(SICI)1099-1050(199911)8:7<599::AID-HEC479>3.0.CO;2-K
- A. Hollis, “How Do Brand’s ‘Own Generics’ Affect Pharmaceutical Prices,” Review of Industrial Organization, Vol. 27, No. 4, 2005, pp. 329-350. http://dx.doi.org/10.1007/s11151-005-5469-5
- F. J. Coronado-Saleh, “Market Structure and Regulation in Pharma-ceutical Markets,” Ph.D. Thesis, Universitat Pompeu Fabra, 2010.
- M. Waterson, “Economic Theory of the Industry,” Cambridge University Press, Cambrdge, 1984.
- P. Clarke and S. W. Davies, “Market Structure and Price Cost Margins,” Economica, Vol. 49, No. 195, 1982, pp. 277-287. http://dx.doi.org/10.2307/2553628
- P. J. Lambert, “Advanced Mathematics for Economist. Static and Dynamic Optimization,” Blackwell, 1985.
- A. Melnik, O. Shy and R. Stenbacka, “Assessing Market Dominance,” Journal of Economic Behaviour & Organization, Vol. 68, No. 1, 2008, pp. 63-72. http://dx.doi.org/10.1016/j.jebo.2008.03.010
- J. D. Angrist and J.-S. Pischke, “Mostly Harmless Econometrics. An Empiricist Companion,” Princeton University Press, 2009.
Appendix
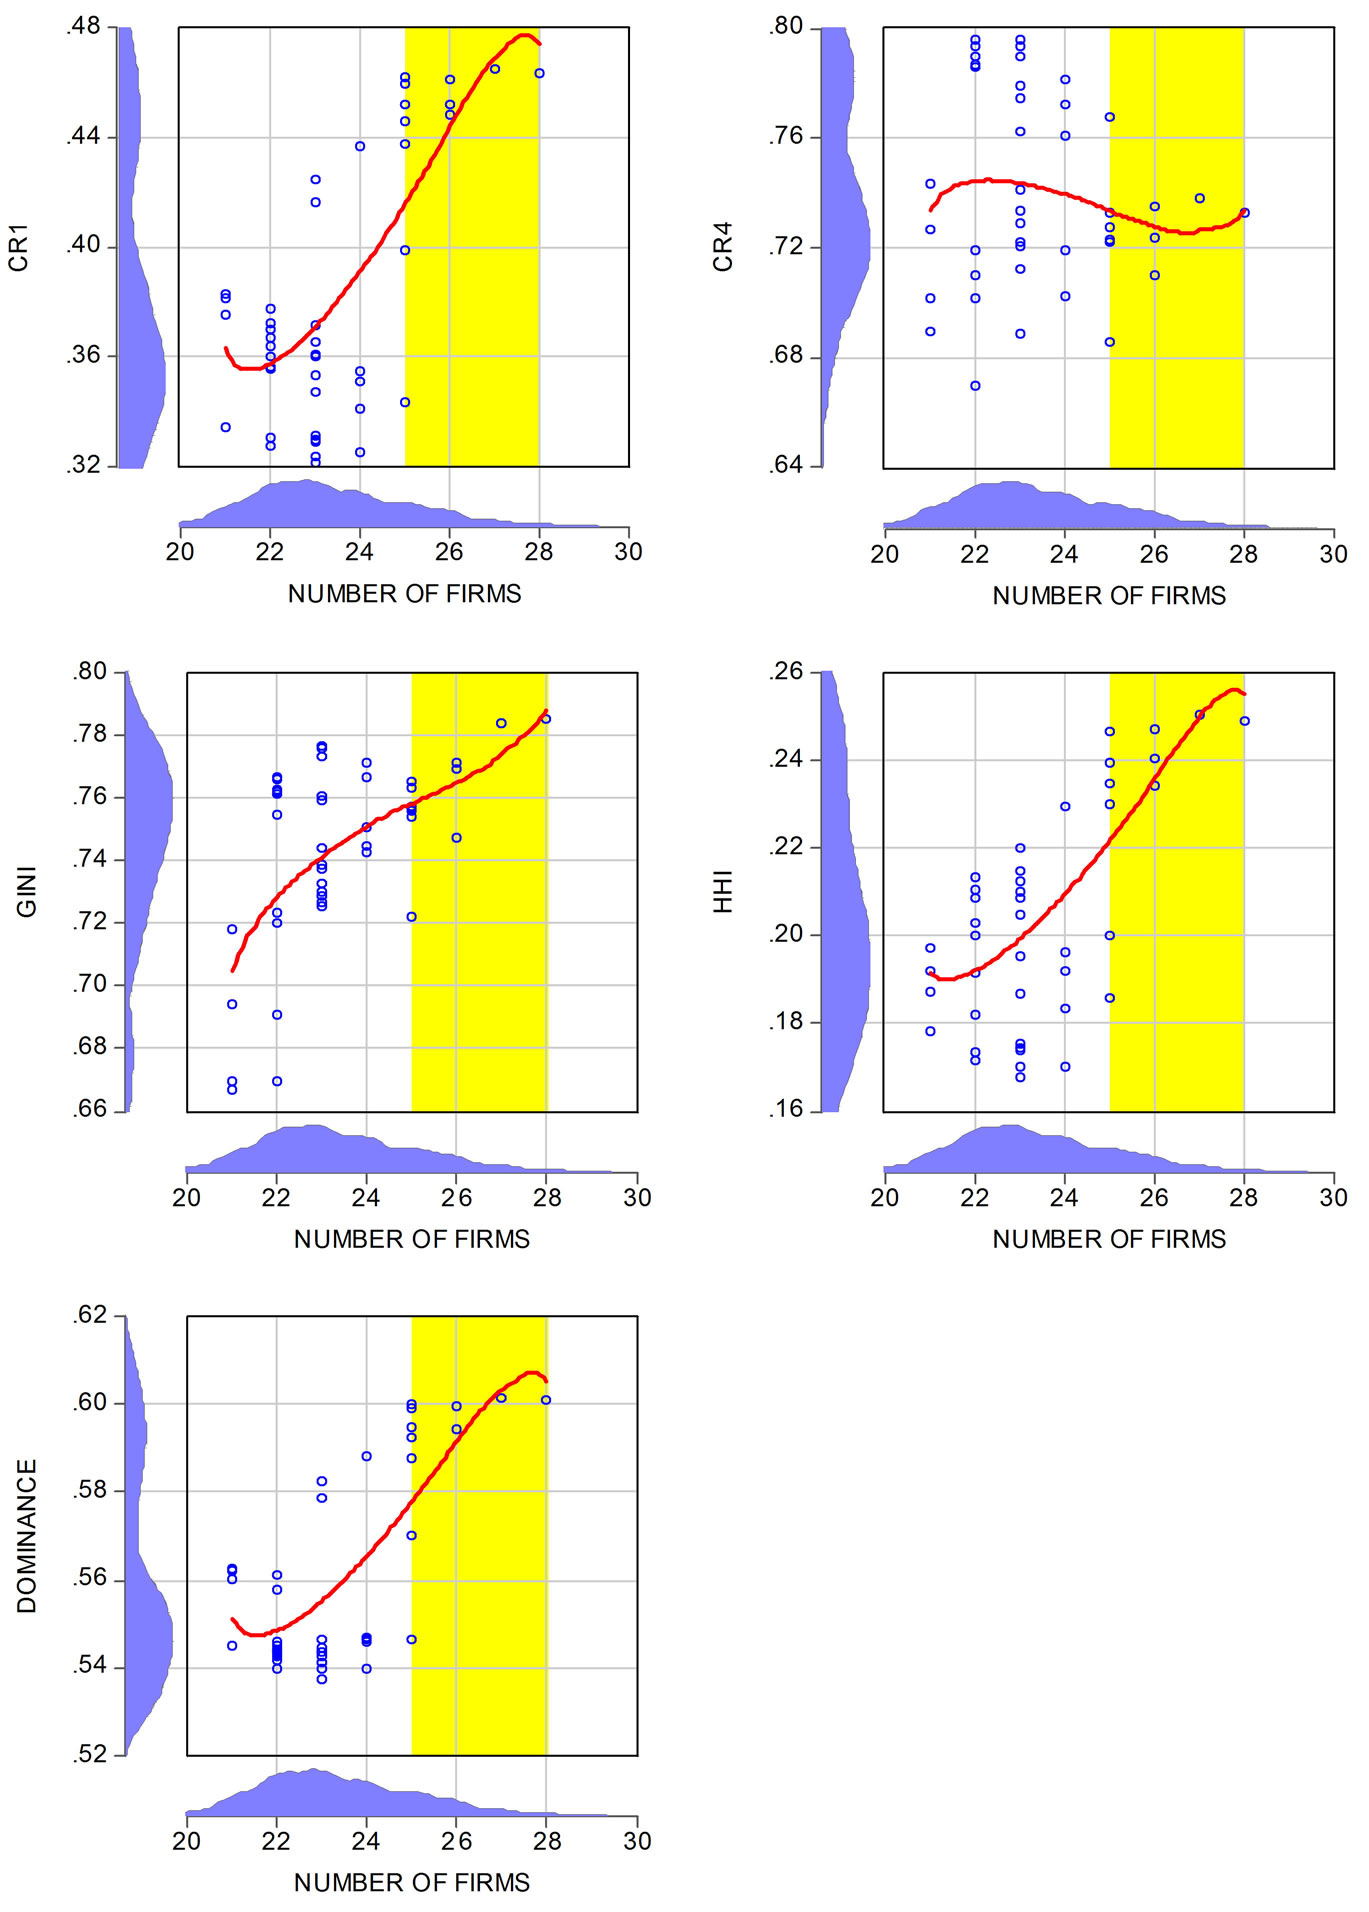
Figure A1. Non-parametric regressions for nominal sales share concentration indices on the number of firms.