Modern Economy
Vol. 4 No. 5 (2013) , Article ID: 32385 , 9 pages DOI:10.4236/me.2013.45042
The Educational Development Index: A Multidimensional Approach to Educational Achievements through PISA*
Department of Economics, Pablo de Olavide University & Ivie, Seville, Spain
Email: avillar@upo.es
Copyright © 2013 Antonio Villar. This is an open access article distributed under the Creative Commons Attribution License, which permits unrestricted use, distribution, and reproduction in any medium, provided the original work is properly cited.
Received February 28, 2013; revised March 30, 2013; accepted April 25, 2013
Keywords: Education; PISA; Multidimensional Measurement; Performance; Equity; Quality
ABSTRACT
This paper proposes a multidimensional index that summarizes three relevant aspects of the educational achievements, out of the data provided by the PISA Report, concerning reading abilities of 15-year-old students from 65 countries. The three aspects considered are: performance, equity, and quality. The Educational Development Index (EDI) is the geometric mean of the normalized values of those three variables. We analyse the distribution of the variables that approach those three aspects and the resulting index, relative to the corresponding means of the OECD countries.
1. Introduction
The Programme for International Student Assessment (PISA) provides the broadest dataset for the evaluation of schoolchildren performance and the characteristics of their schooling and family environment. It is a triennial worldwide test of 15-year-old schoolchildren’s scholastic performance, the implementation of which is coordinated by the OECD. The aim of the PISA study is to test and compare schoolchildren’s performance across the world, with a view to improving educational methods and outcomes.
Around 470,000 students completed the assessment in 2009, representing about 26 million 15-year-olds in the schools of the 65 participating countries and large economies. Students also answered a questionnaire on their personal background, their learning habits, their attitudes towards reading, and their engagement and motivation. As a result, PISA 2009 provides an extensive and extremely rich profile of knowledge and skills among 15-year-olds in 2009, as well as contextual indicators relating performance results to student and school characteristics.
| 1Reading literacy can be defined as the understanding, using, and reflecting on written texts, in order to achieve one’s goals, to develop one’s knowledge and potential, and to participate in society. |
PISA surveys started in 2000 with the aim of evaluating the students’ ability, about the end of compulsory education, in three different domains: reading, mathematics and science. Every period of assessment specialises in one particular category, but it also tests the other two main areas studied. The subject specialisation is rotated through each PISA cycle. In 2000 the major domain was reading while in 2003 and 2006 were mathematics and science respectively. Therefore, although information for any of the domains is available in all waves, there are some differences in the pieces of information obtained for a specific domain from different periods. The 2009 report has focused again on reading abilities, so that a first cycle has been completed for this dimension.
There are many aspects that can be analysed with the rich database that PISA provides, some of which are already carefully dealt with in the different volumes of the PISA report. Many other specific questions can be addressed by exploiting the corresponding microdata. Our focus here is to find a way of synthesising the most basic traits of the educational performance of those countries participating in the PISA survey, focusing on reading literacy1. To do so we elaborate a multidimensional evaluation index that integrates three different dimensions that we deem essential: performance, equity, and quality. That index has many aspects in common with the new Human Development Index [1], even though it avoids some of its problems (see [2,3]).
The reason to focus on reading literacy is not only that the 2009 survey specializes on the study of this dimension. It is mostly due to the fact that “reading skills play a central role in an individual’s learning at school. The ability to read and understand instructions and text is a basic requirement of success in all school subjects. The importance of literacy skills does not, however, come to an end when children leave school. Such skills are key to all areas of education and beyond, facilitating participation in the wider context of lifelong learning and contributing to individuals’ social integration and personal development”2. Indeed, “Levels of reading literacy are more reliable predictors of economic and social wellbeing than is the quantity of education as measured by years at school or in post-school education… It is the quality of learning outcomes, not the length of schooling, that makes the difference.” [4, p. 32].
2. A Multidimensional Index of Education
2.1. Three Dimensions
We propose here a multidimensional index of educational achievements that provides a summary picture of the performance of the different educational systems, concerning reading literacy, while keeping the simplicity of real-valued measures. The index is intended to exploit some of the key data available in the PISA reports, beyond the students’ scores in the different competencies.
Let us recall here that building a multidimensional index always involves three critical decisions: a) The number and nature of the dimensions considered; b) The choice of the variables that measure those dimensions; and c) The selection of the aggregation formula. Those decisions, that are neither easy nor independent, determine the picture we obtain concerning the performance of the different educational systems.
We consider here three different dimensions of the educational achievements for a society in a given period: Performance, Equity and Quality. Performance refers to the overall achievement of society and is captured by the mean scores of the test corresponding to the aspect under consideration (reading competence here). Equity tries to measure the degree of equality of opportunity of the educational systems, in terms of the dependence of the observed scores on the socioeconomic environment (the more dependence we observe the less equitable the educational system). Finally, quality tries to approach the relative thickness of the tails in the distribution of outcomes.
Those three dimensions are certainly important and will be treated symmetrically. Needless to say, one can think of other dimensions that are also relevant and/or of different degrees of relevance for those dimensions. Note, however, that the more dimensions we consider the more dependent becomes the index on the specific aggregation process and, in particular, on the weights we attach to those dimensions. Moreover, most of those dimensions tend to be rather elusive when it comes to precise their meaning and to select the variables that can measure them. A number of reasonable alternatives are always available and building an index of this nature involves a good deal of simplification and compromise.
Three preliminary remarks are in order:
● When we speak of “educational system” we refer to something much broader than the schooling system, as it inevitably includes the families’ and society’s involvement in the educational process. This matters when interpreting the nature of the results obtained: better values of the index cannot be fully explained by the differences in the schooling system, since there are other environmental factors that contribute to that outcome.
● There are some countries in which a relevant fraction of 15-year-old population has left the school by the time they are 15 (e.g. more than 30 % in the case of Turkey or Mexico). As PISA excludes 15- year-old students who are not enrolled in any form of educational institution, some of the figures we obtain overestimate educational opportunities and outcomes.
● We restrict ourselves to the choice of variables that are provided directly by the PISA report and aim at building a summary measure easy to interpret and easy to understand for a wide audience. In that respect we very much follow the approach of the UN human development index.
2.2. The Structure of the Index
The Educational Development Index, EDI for short, is a summary evaluation of the three dimensions of educational outcomes mentioned above: performance, equity and quality. The index consists of the geometric mean of the normalized values of the variables that approximate those dimensions.
Consider a society i (typically a country or a region) in a given reference period (year 2009 in our case) and suppose we have the relevant data on performance, equity and quality of the target population. Let Pi, Ei, Qi denote those values. The Educational Development Index is given by:
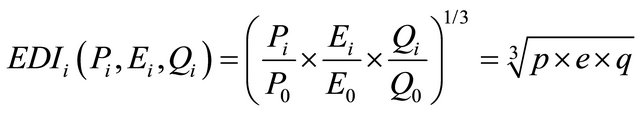 (1)
(1)
where P0, E0, Q0 are some reference values selected so that the resulting normalized variables, p, e, q, are easy to interpret. The normalization is convenient in order to set the values of the different dimensions into some type of common units.
We shall take as reference values the average of each variable within the OECD, so that one hundred times x tells us the percentage of the OECD average that this variable represents, for x = p, e, q. All normalized variables represent, therefore, shares on the OECD average and their values are easily understandable.
Observe that this type of normalization, in terms of shares, implies that a change of the reference values will affect neither the ranking that the EDI produces among the different countries nor the relative valuations of any two societies, nor the associated marginal rates of substitution. Indeed, the marginal rate of substitution between any two components within a country, Pi and Qi, say, is given by the simple expression Pi/Qi, which is obviously independent on the chosen reference values.
The geometric mean is an aggregator that exhibits much better properties than other standard summary measures (e.g. the arithmetic mean) as it introduces the familiar decreasing marginal rates of substitution among its components. Or, from a different perspective, it is an aggregator that penalises the dispersion of its components so that getting high values of the index requires doing well in all the three dimensions. Moreover, the geometric mean is a common centrality measure with an intuitive interpretation that many people can understand.
The geometric mean can be characterized in terms of reasonable assumptions that adjust well to this context. See for instance [2,3,5-7].
3. The Components of the Multidimensional Index of Education
We describe in this section the nature of the variables that enter the Educational Development Index.
3.1. Performance
One of the assets of the PISA report is that it provides a unified scoring system to evaluate the performance of 15-year-old students in very different countries. The units of those scores are set with respect to the values obtained in the 2000 wave of the report, by taking a value of 500 for the average of the OECD Member States with a standard deviation of 100.
Besides the average score the PISA report classifies the students in six (actually seven) categories defined by a gradual increase of reading competence. Each of those levels is defined in terms of the capacity of the students to achieve certain cognitive processes and operationalized in term of ranges of the scores obtained by the students (see Figure 1. 2.12 in volume I of the PISA report for details).
Table 1 below describes the score intervals for those levels.
The distribution of the scores among the countries shows a relatively low dispersion: the coefficient of variation is just 0.1102. This figure goes down to 0.046 for the OECD countries. Yet, the difference between top and bottom performers is huge: there are 242 score points of difference between Shangai-China and Kyrgyzstan, which corresponds to six formal years of schooling. The difference between the top and the bottom OECD countries (Korea and Mexico, respectively) is of 114 score points, more than the equivalent of two school years.
Spain represents the median of the distribution, with some 97.6% of the mean score of the OECD. Israel, Croatia, the Slovak and the Czec republics, Slovenia and Greece are around the median. Italy, Macao-China, Portugal, United Kingdom, Hungary and Denmark have scores very close to the mean of the OECD. The top performers are Shanghai-China (with an impressive mean score of 556), Korea, Finland, Hong Kong-China, Singapore and Canada. At the bottom of the global distribution we find Kyrgyzstan, Azerbaijan, Peru, Panama, Qatar, Albania and Kazakhstan.
Table 2 gives the top ten OECD countries with respect to average scoring in reading literacy.
3.2. Equity
We approach the equitability of educational systems following the very same ideas expressed in the PISA report: “In a system characterised by an equitable distribution of educational opportunities, students’ performance is independent of their background… In this system, the relationship between academic achievement and student
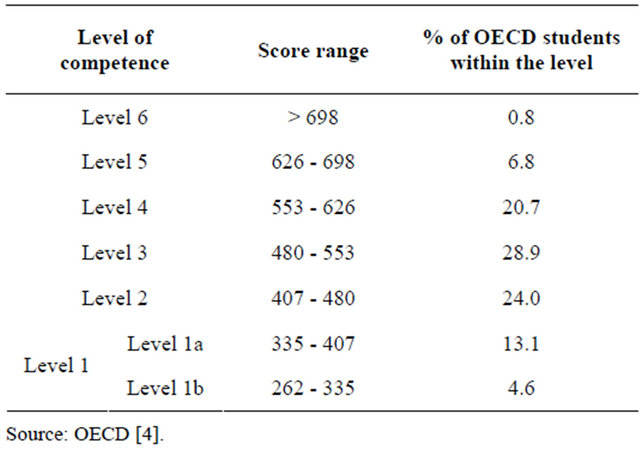
Table 1. Levels of reading competence.
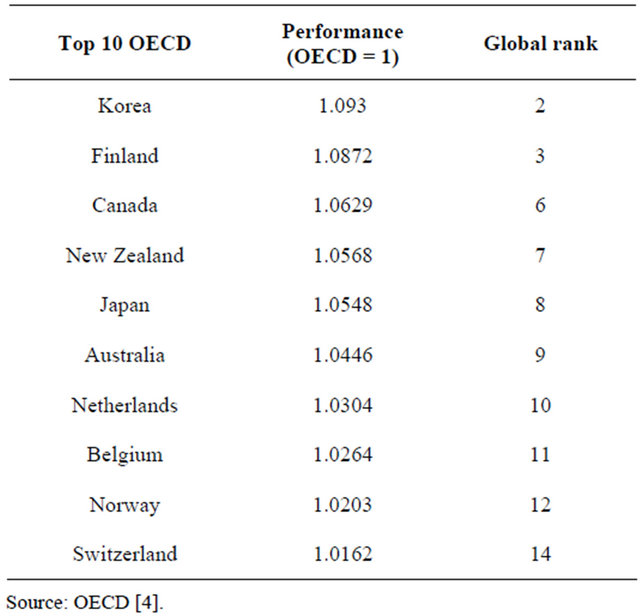
Table 2. Top OECD performers in reading literacy.
background is weak as all students enjoy the same opportunities to achieve their potential and their outcomes represent their efforts, abilities and ambitions fairly. In contrast, in a system characterised by a strong relationship between background and performance, some students, characterised by their socio-economic disadvantage, their family structure or the school location, are less likely to fulfil their academic potential because they do not enjoy the same opportunities.”
The notion of equity that seems best for the context is, therefore, that of equality of opportunity. During the last decades this notion has been developed by different authors and implemented in a variety of contexts (see [8]). This principle is especially pertinent when dealing with the outcomes of compulsory education, as it is the case with the PISA report, because compulsory education aims at providing a basic common body of knowledge and ability to all. The application of the equality of opportunity principle to this context interprets the observed educational outcomes as the result of two main factors, opportunity and responsibility. Responsibility has to do with effort. Opportunity refers to the agents’ external circumstances (aspects for which agents cannot be held responsible). The key point is that those differences in opportunity are considered as socially unfair. The measurement of those differences in opportunity becomes, therefore, the main methodological issue.
Even if we identify the equality of opportunity approach as the right venue to assess the equitability of an educational system, there is a wide variety of aspects that one may consider as part of the students circumstances: gender, nationality, religion, parental educational background, family wealth, location, etc. The more independent the observed outcomes of those aspects, the more equitable the educational system. Here we shall focus on the dependence of the PISA scores on the differences in the cultural and socioeconomic environment of schoolchildren3.
The PISA study provides a summary index of the main socioeconomic and cultural features of families and societies, the so-called ESCS index, and relates the observed performance to this variable4. All countries exhibit a positive correlation between socioeconomic conditions and performance, even though such a correlation is not too strong and differs substantially between countries. That implies the existence of other factors that are also very important in the explanation of differential outcomes, such as organizational aspects, the quality, motivation and involvement of schoolteachers, the attitudes of the families towards education and, of course, individual effort5.
The coefficient of determination, that is the square of the coefficient of linear correlation, between the ESCS and the average scores provides a suitable measure of the dependence of the scores con the students’ socio-economic environment within each country. This coefficient can be regarded as a measure of inequality of opportunity as it tells us the common variance between the two series of variables. Those data are provided by the PISA report and are, therefore, easy to handle and easy to interpret6. We use as a measure of equality the difference between the unity and the coefficient of determination, so that equity is zero when all the variance in the scores is explained by the students’ socio-economic conditions and it is one when there is nothing in common.
The diversity of the educational systems in this dimension is small and results in a coefficient of variation of 0.0546 (around one half the variability of the average scoring). The value of the coefficient of variation for the OECD countries is of 0.0306, slightly below that of the mean scores. The more equitable economies are MacaoChina, Qatar, Hong Kong-China and Iceland. The less equitable ones are Peru, Hungary, Uruguay and Bulgaria. Further details on the distribution of this variable are provided below.
Table 3 below shows the 10 Top OECD countries in this dimension.
3.3. Quality
Quality is also a rather elusive concept, hard to define and to compute. Again we find here a number of aspects that can be related to this notion. To approach this dimension we focus on the structure of the distribution of the students between the different levels of competence that PISA determines. The underlying idea is that the fraction of students with high levels of performance is a predictor of those who will get higher education and more likely to exert social leadership. And also that having a thick left tail anticipates that a relevant part of the population may well face problems in the labour market and in society in general. There is already some wellestablished evidence about those facts.
One of the simplest ways of having a proxy of the quality of an educational system would be to take the share of the students in the upper levels (levels 5 and 6 of the PISA study—see Table 1). Yet we think it worth keeping track of the left tail of the distribution as well: students below Level 2. The reason is that Level 2 is considered a baseline level of proficiency at which students begin to demonstrate the reading skills that will enable them to
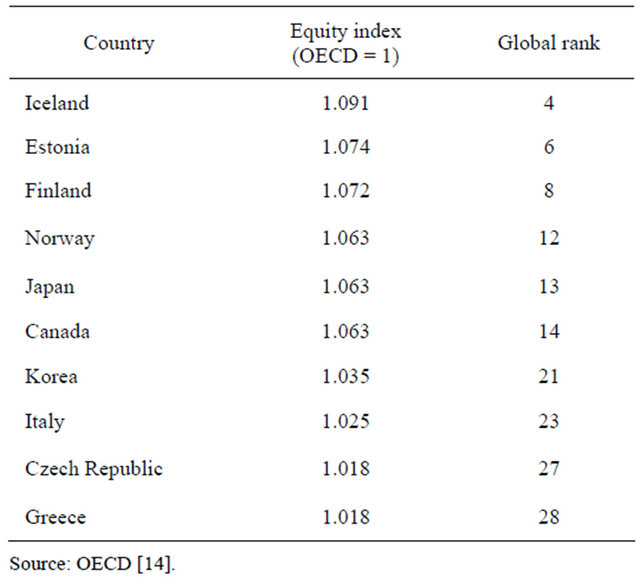
Table 3. Top 10 OECD countries concerning equity.
participate effectively and productively in life. Students who do not reach Level 2 have difficulties locating basic information that meets several conditions, making comparisons or contrasts around a single feature, working out what a well-defined part of a text means when the information is not prominent, or making connections between the text and outside knowledge by drawing on personal experience and attitudes7.
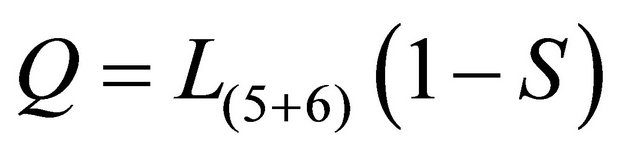
We understand the fraction of students below Level 2 as a measure of poverty in education (a simple head count ratio). Therefore, we propose to measure quality by adding up the share of the students in Levels 5 and 6, denoted by L(5 + 6), and deflating the figure so obtained by (1 – S), where S is the share of students below Level 2. That is, our quality index is given by:
 (2)
(2)
The quality index is an estimate of the excellence, associated with the students in the upper levels, discounted by a factor that approximates the fraction of minimal educational accomplishments. The idea is that a given fraction of excellent students becomes socially more relevant the smaller the fraction of people with poor education.
Note that, as the different levels are defined in absolute terms, any country might have 100% of students in any given level. Our quality measure, therefore, captures the relevant absolute differences in the countries’ performance.
This measure exhibits an extremely high variability, with a coefficient of variation around 0.946 (more than eight times the coefficient of variation of the average scoring). The value of the coefficient of variation for the OECD countries is 0.485 (more than nine times that of the corresponding average scoring). The quality ranking of the educational systems is headed by Shanghai-China, Singapore, New Zealand, and Finland, with values more than 200% above the OECD average. Germany and Poland exhibit values very close to that average. Austria and Slovenia represent the median of the whole distribution. Azerbaijan, Indonesia and Kyrgyzstan are those countries with smaller values (below 1% of the OECD average).
Table 4 shows the top ten OECD countries with respect to this index.
4. The Educational Development Index (EDI)
The overall educational achievements of the countries participating in PISA, as measured by the Educational Development Index, exhibits much more variety than the average PISA scores. The EDI has a coefficient of variation of 0.4577, more than four times larger than the coefficient of variation of the average scoring. The ratio for the OECD countries is similar: the coefficient of variation of the EDI is about five times that of the average scoring.
Slovenia and Portugal are the countries that represent the median of the whole distribution, with values around 84% of the OECD average. Austria and Macao-China are around the mean (which is some 78% of the OECD average). United Kingdom, Poland and Germany are around the mean OECD value. If we focus on the top 10 tiers, we find that five are Asiatic countries (ShanghaiChina, Singapore, Hong-Kong China, Korea, and Japan). The first six positions correspond to countries with values that exceed in more that 30% the average OECD index.
Table 5 gives the top 15 OECD countries according to the EDI. It shows a variety of countries including two Asian countries, two North American countries, two countries in Oceania, and nine European countries.
In the lower part of the distribution we also find a wide variety of countries. If we focus on the countries with an EDI below 30% of the average OECD, that correspond to the last 10 in the ranking, we find three former Soviet Union countries (Azerbaijan, Kazakhstan and Kyrgyzstan), two South-American countries (Panama and Peru), two from South-East Asia (Thailand and Indonesia), one European country (Albania), one from the Middle East (Jordan), and one from North Africa (Tunisia).
Table 6 provides a grand summary of the countries’ achievements in the different dimensions, as well as the evaluation according to the Educational Development Index (EDI). The last column provides a measure of the change in rank produced by the EDI with respect to that corresponding to the average scores (positive numbers indicate positions climbed up with the EDI vis a vis Performance and negative numbers positions descended).
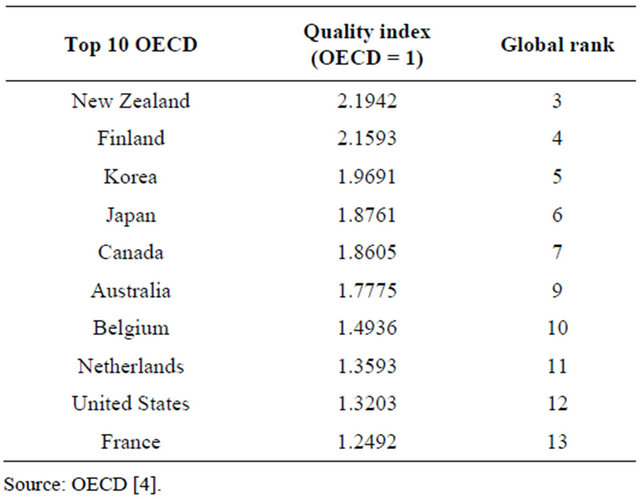
Table 4. Top quality countries in the OECD.
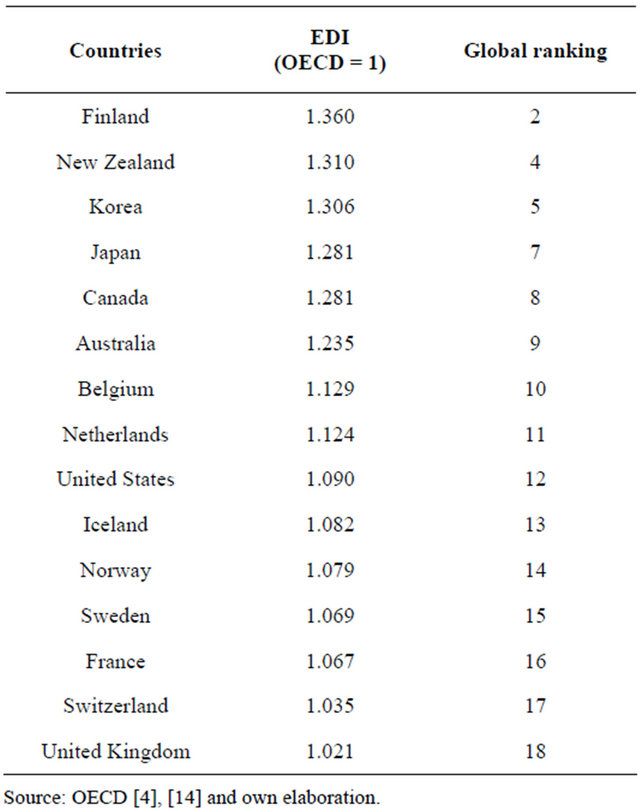
Table 5. Top 15 EDI in the OECD.
5. Summary and Discussion
We have presented in this paper a proposal to evaluate the educational development of the countries, out of the data in the PISA report concerning reading abilities, in terms of three different aspects: performance, equity and quality. The Educational Development Index (EDI) is the geometric mean of the normalized values of the variables that approach those dimensions. We have used this index to evaluate the educational development of all the countries that participate in the PISA exercise and compared the results with the average PISA scores.
The data show that the EDI produces a rank that, globally considered, does not differ very much from that obtained by considering the PISA average scores alone (there is around 60% of common variance between both variables). This is not surprising as the PISA scores are involved in the three variables that have been selected to calculate the EDI. Yet, the EDI allows uncovering relevant differences among the countries with respect to some key features of the educational systems. Equity and quality exhibit patterns of behaviour that can be very different in pair-wise comparisons and shed light on the nature of the differential achievements. Indeed, the analysis of the distribution of the different variables is worth on its own, as it provides valuable information on the differences of the countries with respect to in the selected dimensions.
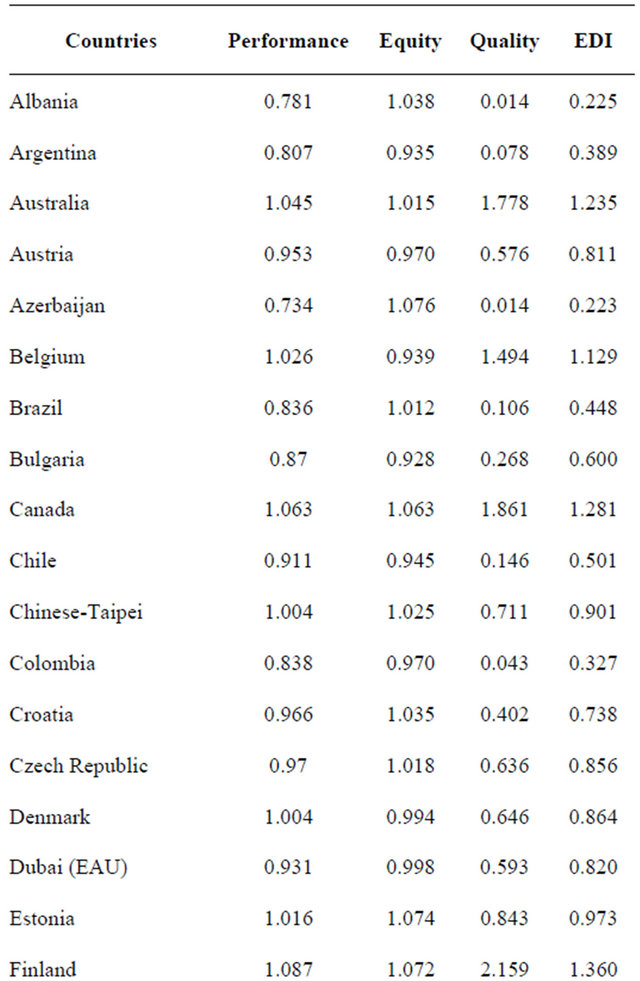
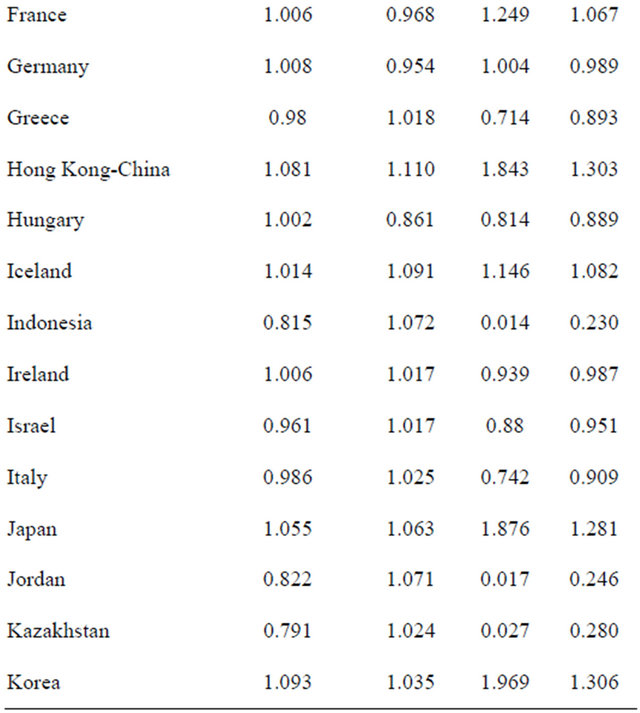
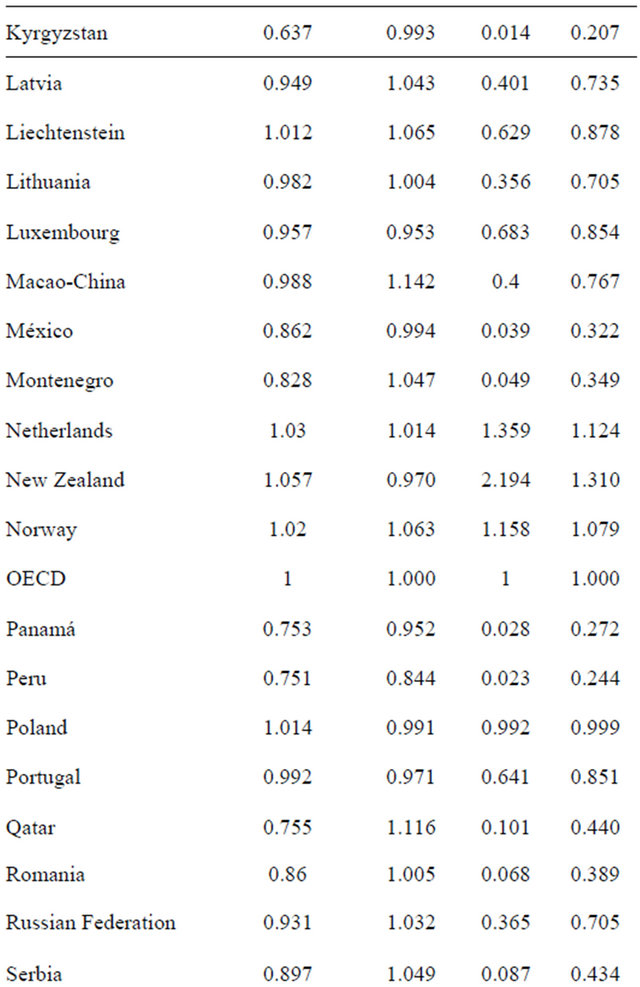
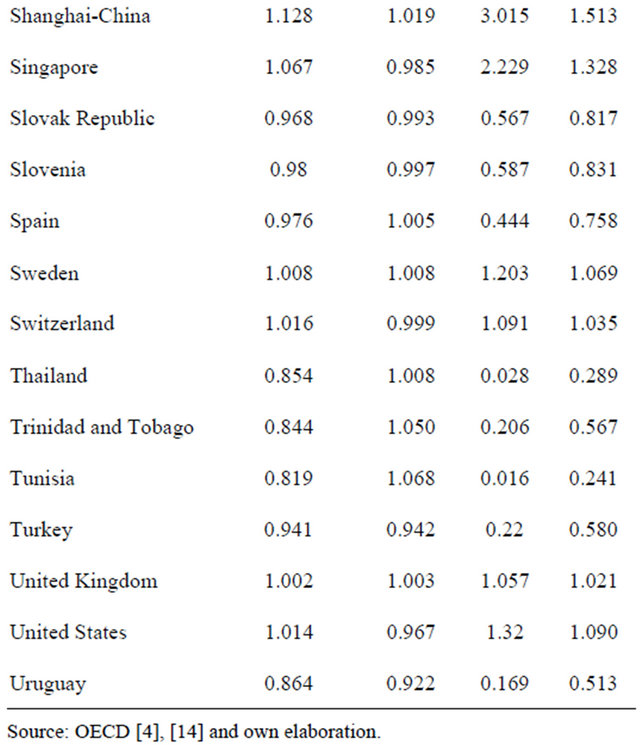
Table 6. Summary of the countries’ achievements (PISA 2009).
The different behaviour of the average performance and the EDI is well illustrated in Figure 1, where we present the shape of the distribution, ordering the countries according to their Performance values (from top to bottom). Figure 1 points out two main aspects. First, that the variability is much higher for the EDI. Second, that there are also many changes in the ranking (that appear as peaks in the EDI line).
The change between the values of performance and EDI for the OECD countries is also relevant. The EDI index for Finland, New Zealand, Korea, Canada and Japan is more than 20% greater than the corresponding index of performance. In the other extreme, Spain, Turkey, Chile and Mexico show EDI values more than 20% below the performance index (with an extreme of 54% below for Mexico).
If we compute the coefficient of correlation between each pair of variables within the EDI we observe always a positive correlation, with relatively low values for quality and equity (0.33), a moderate value for performance and equity (0.48), and a high value for performance and quality (0.83). Which means, in particular, that one can not assume that higher quality goes against equity. The data suggest the opposite relationship.
A general conclusion worth stressing is the following: “While better educational outcomes are a strong predictor of economic growth, wealth and spending on education alone are no guarantee for better educational outcomes. Overall, PISA shows that an image of a world divided neatly into rich and well-educated countries and poor and badly-educated countries is out of date.” (The OECD General Secretary). This conclusion has very important implications for the near future. As we have seen, there are relatively less developed countries that are getting very good educational outcomes whereas some others, relatively better placed, are far from succeeding. That anticipates a rapid progression in the development ladder of the formers and increasing difficulties for the latter.
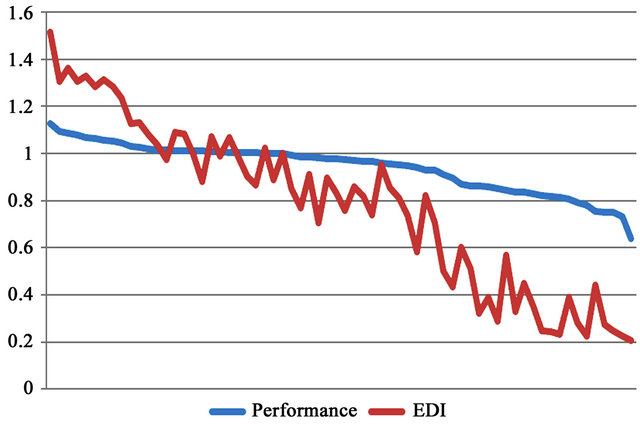
Figure 1. The shape of the distribution of Performance and EDI.
There is one aspect that we have decided not to introduce explicitly in the index, even though it should be taken into account when interpreting the outcomes of some specific countries. It refers to the differential coverage of the 15-year-old population provided by the PISA report. There are countries in which a relevant part of 15-year-old population has abandoned the educational system and are, therefore, out of the sample. As there is no information on that part of the population it is hard to decide how to adjust the data to take into account those different participation rates. The simplest way of introducing that element into our analysis would be to multiply each country’s indicator by the share of the 15-year-old students that are in the system. That would imply substantial losses in the EDI value of some countries, such as Albania (30%), Argentina (22%), Azaerbaiyian (35%), Brasil (28%), Colombia (33%), Indonesia (39%), Kyrgizstan (23%), Mexico (31%), Panama (40%), Turkey (35%) and Uruguay (28%). The change produced by this type of measure can be easily done out the tables provided in the PISA report. Yet this aspect probably deserves a specific analysis on its own.
Finally, it is worth noting that the data required to elaborate this index are provided by the OECD in an easily usable form (standard spread-sheets), so that the interested reader can perform alternative evaluation exercises. This applies, in particular, to the weights with which performance, equity, and quality enter the index (those weights can be changed by using differential powers, to express our judgement of the relevance of those aspects).
REFERENCES
- United Nations Development Program, “The Real Wealth of Nations: Pathways to Human Development,” 2010.
- C Herrero., R. Martínez and A. Villar, “Multidimensional Social Evaluation. An Application to the Measurement of Human Development,” Review of Income and Wealth, Vol. 56, No. 3, 2010, pp. 483-497. doi:10.1111/j.1475-4991.2009.00375.x
- C. Herrero, R. Martínez and A. Villar, “A New2 Human Development Index,” Journal of Human Development and Capabilities, Vol. 13, No. 2, 2011, pp. 247-268. doi:10.1080/19452829.2011.645027
- OECD, “PISA 2009 Results: What Students Know and Can Do. Student Performance in Reading, Mathematics and Science,” Vol. I, 2010.
- J. E. Foster, L. F. López-Calva and M. Székely, “Measuring the Distribution of Human Development: Methodology and an Application to Mexico,” Journal of Human Development and Capabilities, Vol. 6, No. 1, 2005, pp. 5-29. doi:10.1080/1464988052000342220
- S. Seth, “Inequality, Interactions, and Human Development,” Journal of Human Development and Capabilities, Vol. 10, No. 3, 2009, pp. 375-396. doi:10.1080/19452820903048878
- S. Seth, “A Class of Association Sensitive Multidimensional Welfare Indices, Mimeo,” Vanderblit University, Nashville, 2010.
- J. Roemer, “Equality of Opportunity,” Harvard University Press, Cambridge, 1998.
- D. Checchi and V. Peragine, “Regional Disparities and Equality of Opportunity: The Case of Italy,” IZA Working Paper 1874, 2005.
- V. Peragine and L. Serlenga, “Equality of Opportunity for Higher Education in Italy,” In: J. Bishop and B. Zheng Eds., Research in Economic Inequality, Vol. 12, 2007.
- A. Lefranc, N. Pistolesi and A. Trannoy, “Equality of Opportunity: Definitions and Testable Conditions, with an Application to France,” ECINEQ Society, Working Paper, 2006, p. 53.
- A. Calo-Blanco and A. Villar, “Quality of Education and Equality of Opportunity in Spain. Lessons from PISA,” Fundación BBVA, Working Paper, 2010.
- A. Calo-Blanco and J. I. García-Pérez, “On the Welfare Loss Caused by Inequality of Opportunity,” Econ Working Paper No. 1212, 2012.
- OECD, “PISA 2009 Results: Overcoming Social Background,” Equity in Learning Opportunities and Outcomes (Volume II), 2009.
- F. H. G. Ferreira and J. Ginoux, “The Measurement of Educational Inequality: Achievement and Opportunity,” IZA Working Paper No. 6161, 2011.
- A. Villar, “Welfare Poverty Measurement,” Econ Working Paper 1202, 2012.
NOTES
*This work is part of a research project funded by the Fundación BBVA. The first version was written while I was visiting the Department of Economics at the University of York. I would like to thank for the hospitality of the institution. Thanks are also due to the comments of an anonymous referee. Financial support from the Spanish Ministry of Economics and FEDER Funds, under project ECO2010-21706 and FEDER, is gratefully acknowledged.
2European commission. Directorate-General for Education and Culture. European report on quality of school education sixteen quality indicators. Report based on the work of the Working Committee on Quality Indicators. May 2000.
3Some analysis of this type can be found in the literature, using former PISA waves. See [9-13].
4“Socio-economic background is measured by the PISA index of economic, social and cultural status (ESCS). This index … combines information on parents’ education and occupations and home possessions. The index was derived from the following variables: the international socio-economic index of occupational status of the father or mother, whichever is higher; the level of education of the father or mother, whichever is higher, converted into years of schooling; and the index of home possessions, obtained by asking students whether they had a desk at which they studied at home, a room of their own, a quiet place to study, educational software, a link to the Internet, their own calculator, classic literature, books of poetry, works of art (e.g. paintings), books to help them with their school work, a dictionary, a dishwasher, a DVD player or VCR, three other country-specific items and the number of cellular phones, televisions, computers, cars and books at home … ” (Cf. [14, p. 29]).
5The report gives an estimate of the equity of the educational systems in terms of the slope of the regression line that links the values of the ESCS index and the observed scores. This is called the socio-economic gradient and tells us how much the score would increase when the ESCS index increases by one unit. The larger the increase, the more dependent the outcome of the ESCS index and, therefore, the less equitable the educational system. In a fully equitable system the observed scores should be independent on the socioeconomic conditions of the families (that would correspond to a flat line). On average across OECD countries, the slope of the gradient corresponds to 38 differential score points.
6See [15] for a convincing discussion in favour of this measure of equality of opportunity in education.
7A study of the distribution of educational poverty appears in [16].