Modern Economy
Vol.4 No.1(2013), Article ID:27598,10 pages DOI:10.4236/me.2013.41007
Measuring Trade Costs in Economic Community of West African States (ECOWAS)
1Institute of Statistical, Social and Economic Research, University of Ghana, Accra, Ghana
2Department of Economics, University of Ghana, Accra, Ghana
3Research Department Bank of Ghana, Accra, Ghana
Email: akaobo@yahoo.com
Received October 31, 2012; revised December 1, 2012; accepted January 2, 2013
Keywords: Trade Costs; Intra-ECOWAS Trade; Exports; Gravity Model
ABSTRACT
In this paper, we measure trade costs for ECOWAS countries and infer their impact on trade flows. The paper applies an unconditional general equilibrium trade model consistent with the Ricardian and heterogeneous firms’ models of trade to estimate a trade cost equation to obtain the tariff equivalent trade cost measure for ECOWAS countries. The method expresses the trade cost parameters as a function of observable trade data. We find that over the period 1980-2003, the cost of trading within SSA was the highest, compared to other regional groups, at an average tariff equivalent of 271.5 percent. On average ECOWAS countries traded with their trading partners at a tariff equivalent trade cost of 268.2 percent, higher than countries from other regional blocs within and out of SSA. With regards to trade flow involving ECOWAS countries, estimates of tariff equivalent trade costs indicates that on average ECOWAS countries traded among each other at a lower cost than with other trading partners from economic blocs out of ECOWAS. This could be attributed to the positive impact of regional trade integration efforts. Over the years especially since 2000, ECOWAS seemed to have promoted intra-ECOWAS trade especially with regards to export of manufactures. With regards to countries within ECOWAS, intra-ECOWAS trade costs with Cote d’Ivoire were the lowest at an average tariff equivalent trade cost of 138.5 percent and this was significantly lower than Ghana, Nigeria and Benin.
1. Introduction
The high and rising level of trade costs has generated intense academic and policy interest on the level and its impact on trade flows and economic integration. Higher trade costs are an obstacle to trade and impede the realization of gains from trade liberalization (see De [1]). Indeed, the international trade literature is replete with studies on the impact of trade costs on the volume of trade (see for example Anderson and van Wincoop [2]). Regional integration is also seen as the resultant of reduced costs of transportation in particular and other infrastructure services in general (Khan and Weiss [3]). Commitment towards removal of trade barriers as well as initiatives to have fair assessment about the size and shape of trade costs among countries would definitely strengthen economic integration process. Thus, reducing international trade costs and hence improving trade competitiveness would have a very significant impact on intra-regional trade. It is therefore unsurprising that trade facilitation and trade cost reduction programs or targets form important component of bilateral or regional trade and economic integration initiatives.
Trade costs as argued by Obstfeld and Rogoff [4] explain all the six major puzzles of international macroeconomics (see [3]). Its importance in international trade cannot be over-emphasized as they are large and variable, impose significance implications on welfare, linked to policy, and matter for economic geography. By distorting the relative price of domestic to foreign goods, trade costs distort the worldwide allocation of production and consumption as well as welfare. Indeed, estimates indicate that for each per cent reduction in trade transaction costs, world income could increase by US $30 to $40 billion (see for example, OECD, [5]; and Francois et al. [6]). Irarrazabal et al. [7] simulations also indicate that the welfare costs are roughly 50 per cent higher when tariffs are per-unit compared to a modeling variable trade costs as an ad valorem tax equivalent (iceberg costs).
The high trade costs have been touted as one of the main determinants of the persistent low level of intra-regional trade in ECOWAS. In most ECOWAS countries, though tariff rates have fallen considerably over the years, the existence of numerous (uncontrolled) check points along the ECOWAS community’s highways and border points and various ports (airports and seaports) as well as the accompanying illegal charges contribute significantly to the costs of doing business in the sub-region. The bureaucracies and other indirect costs that are not policy induced, in particular, have been recognized to constitute the most significant hindrances to integration, trade and more importantly export supply response capacity of West Africa (see Alaba [8]).
Portugal-Perez and Wilson [9] have shown that transport costs in Africa are about 2.5 times those of industrialized countries. World Bank Doing Business Report [10] indicates that the trading costs for African countries, in general, are about twice as high as those in high-income OECD countries. Estimates indicate that average trade costs for African countries are equivalent to an ad valorem term of 425 per cent and that transport costs are 63 per cent higher in African countries compared with the average in developed countries (UNECA [11]).
Yet very little is known about the level and intensity of trade costs in ECOWAS countries and to what extent these costs are compared to other trade costs in other regional sub-groupings. No empirical study has been undertaken to estimate the level and extent of trade costs in ECOWAS. This paper therefore seeks to address this knowledge gap by estimating and analyzing intra and extra-regional trade costs of ECOWAS.
The remaining part of this paper is organized as follows. In the next section, we present intra and interECOWAS trade flows and the structure of ECOWAS exports as well as trade costs. Section three deals with literature review on trade costs and its measurement, with methodology and data description discussed on section four. We offer estimation and analysis of results on section five with conclusions on the last section of the paper.
2. Trade Costs in ECOWAS
Contribution of ECOWAS to global trade is very small. In terms of exports, ECOWAS account for less than one per cent of world merchandise exports. Marginalization of ECOWAS in global trade is also manifested in its very low share of intra-regional exports in its total exportsintra-ECOWAS’ share of total ECOWAS exports has been insignificant and have hovered around 9.2 per cent since 2005 though it increased marginally from 8.8 per cent in 2005 to 9.2 per cent in 2010. The EU and USA remains the major export destinations of ECOWAS exports. The EU and USA, on average, consumed about 57.8 per cent of ECOWAS exports compared with an intra-ECOWAS trade of 9.2 per cent for the period 2005-2010.
The poor performance of ECOWAS in global trade and intra-ECOWAS trade have been largely attributed to the high and rising cost of trade incurred in transporting and moving across borders1. For Lyakurwa [12], the high transaction costs constitute the most binding trade constraint in African countries. The high transport cost and infrastructural costs which are enormous in ECOWAS countries are attributed to, among other things, inappropriate and disproportionate arrangements of existing roads and railway links, air and sea transport and poor communication and disappointing power supply. Others are the burdensome documentation requirements, timeconsuming customs procedures, inefficient port operations and inadequate transport infrastructure lead to unnecessary costs and delays for traders (see Alaba [8]).
The Doing Business [14] indicates that in SSA, despite making the most improvements in trading across borders in 2009/10, trade is still the slowest and most expensive. Table 1 indicates that the cost of importing and exporting a container is estimated to amount to $2491.80 and $1961.50 respectively compared to $1744.50 and $1511.60 in South Asia. Other developing regions including East Asia & Pacific, Latin America & Caribbean and Middle East & North Africa even have relatively smaller costs of importing and exporting. Also, it requires 7.7 and 8.7 documents to export and import in sub-Saharan Africa, more than any other region with the exception of South East Asia. There is still more costs with regards to number of days to export and import as the region typically face delays 3 times as long, with the
Table 1. Border Trade costs across different regions.

time to export averaging 32 days and the time to import 38 days.
On average, overall delays at African customs remain longer than the rest of the world: 12 days in countries south of the Sahara, compared to 7 days in Latin America, 5.5 days in Central and East Asia, and slightly more than 4 days in Central and East Europe, adding a tremendous cost to importers each passing day at the custom’s warehouse (see ECA [15]). ECA [16] also indicates that, on average, customs transaction in Africa involve 20 to 30 different parties, 40 documents, 200 data elements (30 of which are repeated at least 30 times) and the rekeying of 60 to 70 per cent of all data at least once.
3. Literature Review
3.1. Definition of Trade Costs
Trade costs2 include all costs (other than the marginal cost of producing the good) incurred in getting a good from the producer to the final user. It includes transportation, time and local distribution costs, border costs, institutional costs (i.e. legal and regulatory costs, foreign exchange costs), and informational costs (i.e. contract enforcement costs, communication cost).
Within the international trade literature two main sources of trade costs have been identified, namely direct sources or evidence and indirect sources or evidence. While the direct sources of trade costs are obtained from data obtained on costs imposed by tariff and nontariff barriers and by the environment (transportation, time cost, wholesale and retail distribution costs and insurance), indirect evidence has been obtained mainly through inference from trade flows3.
For almost five decades, trade economists have inferred unobservable trade costs from trade flows through economic models, mainly in the form of gravity equations. Originally borrowed from the Newtonian law of universal gravitation4, the gravity framework was first applied in economics by Tinbergen in 1962 to explain bilateral trade flows between two countries. Without much theoretical foundation, Tinbergen [20] postulated that bilateral trade flows are positively related to the product of the two countries’ GDPs and inversely related to the distance between them.
Following from Tinbergen’s [20] benchmark gravity model for explaining bilateral trade flows, two main theoretical approaches emerged in the international trade literature namely the conditional and the unconditional general equilibrium frameworks.
According to Bergstrand and Egger [21], the main difference between these two approaches was the assumption made about the “seperability” of production and consumption decisions from decisions made about the choice of bilateral trade countries. While the conditional general equilibrium approach (and endowment based model) assumed production and consumption decisions as given and that each country specialized wholly in the production of its own good, which for each country is produced exogenously, the unconditional general equilibrium approach recognized the absence of seperability of production and consumption decisions from bilateral trade decisions.
Under the endowment-based conditional general equilibrium framework, trade economists have estimated two types of gravity equations namely, the “traditional” and “theory-based” gravity equations. The traditional gravity equation to infer unobservable trade costs following from Tinbergen [20] and Anderson [22] is of the form
 (1)
(1)
where xij is the log of exports from i to j, yi and yj are the log of GDP of the exporter and importer,  is a set of observables to which bilateral trade frictions/barriers are related and εij is the disturbance term.
Anderson and van Wincoop [23] following from the findings of McCallum [24]5 made a theoretical refinement of the “traditional” gravity to incorporate multilateral trade resistance variables. Anderson and van Wincoop [23] argued that the highly overstated impact of national borders on bilateral trade found by McCallum [24] was because the “traditional” gravity model failed to account for the impact of multilateral trade resistance (i.e. the average trade resistance between a country and its trading partners with the rest of the world) on bilateral trade costs.
Anderson and van Wincoop [23] were therefore motivated to provide a theoretical refinement of the traditional gravity model (henceforth, “theory based” gravity model) to include multilateral trade resistance variables. The various studies that have made use of the “theory based” gravity model (an enhanced conditional general equilibrium model) have estimated in different ways the gravity equation of the form
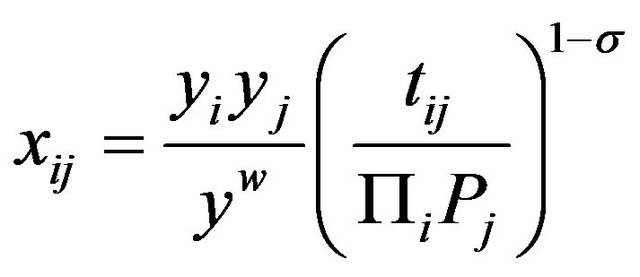 (2)
(2)
where  (3)
(3)
where xij is nominal exports from country i to j, yi and yj is the nominal income (GDP) of exporter i and importer j respectively, yw is nominal world income (total world GDP), tij is the bilateral trade costs, γ is the elasticity of substitution among goods, Пi and Pj are outward and inward multilateral resistance variables respectively. In addition  is a set of observables to which bilateral trade frictions/barriers are related.
According to Anderson and van Wincoop [23], the multilateral trade resistance variables in Equation (2) which capture countries average international trade barrier costs can be expressed as
 (4)
(4)
 (5)
(5)
where θi and θj is the share of world income of country i and j defined as 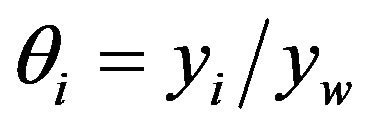 and
and  respectively. From Equations (4) and (5) bilateral trade costs tij are summed over and weighted by all destination countries j or origin countries i.
Both the “traditional” and “theory-based” gravity equations have continued to achieve empirical success in explaining bilateral flows6 and this explains why the gravity framework of trade is recognized as the workhorse in explaining bilateral trade flows. Most of the studies that have employed versions of either the “traditional” and “theory-based” gravity equations have sought to estimate various types of bilateral trade costs across countries and overtime.
3.2. Recent Developments in Measuring Trade Costs
The empirical validity of using gravity equations to measure trade costs and its impact on trade volumes has been criticised mainly as a result of the underlying theoretical assumptions. The criticisms that have come up relate to the omission of the non tradable sector in the trade cost function, symmetric assumption about outward and inward multilateral resistance, the inclusion of time invariant proxies and omission of important frictions to trade in the trade cost function. Attempts to address these criticisms have led to the emergence of a new strand of promising trade cost literature.
Engel [25] and Novy [26] argue that by ignoring the non-tradable sector the gravity equation underestimates border barrier costs because trade barriers do not only affect international trade but domestic trade as well. The intuition behind this argument is straightforward. A change in trade barriers will lead to a shift in resources between the tradable sector and non-tradable sector (import competing) and this will result in changes in trade flows (either bilaterally or multilaterally). This is especially the case for multilateral resistance of the trading countries because it does depend on domestic trade. This implies that there is the need to include domestic trade in the gravity equation to account for the home bias.
The symmetric assumption underlying trade costs within the gravity model has also come under criticism because as indicated by Novy [26] it might not hold in all cases. It is empirically possible for bilateral trade costs to be asymmetric because one country imposes a higher tariff than the other or because the quality standards and technical requirements in one country is more stringent than the other, a situation likely for African countries.
As indicated by Coe et al. [27] and other studies, the estimates of distance elasticity of trade costs obtained from the gravity equation has remained a “missing globalization puzzle” because over time it has remained unchanged in spite of declining transport costs. This might possibly be as a result of the inclusion of time-invariant trade cost proxies such as distance in the gravity equation. Distance cannot be a useful measure of transport costs because it does not capture changes in transport costs over time.
Standard gravity equations (i.e. the traditional and theory-based) have also failed to capture all trade costs components because of lack of information and hidden transactions costs that have in most situations not been accounted for in capturing trade costs. This might explain why there is a missing trade flow component when predicted trade flows are compared with actual trade flows.
3.3. Micro-Founded Measure of Trade Cost
By building on Head and Ries [28] and Anderson and van Wincoop’s [23] micro-founded (i.e. theory based) gravity equation with trade costs, Novy [26] allows for trade costs to be inferred from easily observable time-varying data without imposing trade cost function (with “questionable” assumptions).
The motivation for Novy’s approach was to overcome the drawbacks that were associated with the microfounded (theory-based) gravity framework by Anderson and van Wincoop [23]. Novy [26] identified three drawbacks with the assumptions made by Anderson and van Wincoop [23] with respect to the bilateral trade cost formulation. These included the possibility of a functional form misspecification of the trade cost function and also most likely an omitted variable(s) problems; the inclusion of time invariant proxies such as geographic distance and borders in capturing empirically time-varying trade costs and the possibility that bilateral trade costs might be asymmetric because countries impose different tariffs in their trade relations so one country can impose a higher tariff than the other (i.e. tij ≠ tji). Even if trade tariffs between the two countries are assumed to be the same, it is impracticable to assume that other trade frictions will also be the same. Thus it follows that outward and inward multilateral trade resistance between countries i and j are not the same (i.e. Пi ≠ Pj) as assumed by Anderson and van Wincoop [23].
In the light of these drawbacks, Novy [26] following closely Head and Ries [28] derived an explicit analytical solution for the multilateral trade resistance variables and with that solved the trade costs function. This approach (henceforth “micro-founded measure” of trade costs) relies on the argument that changes in trade barriers do not only affect international trade but domestic trade as well. In practice when a country phases out or reduces trade tariffs, some goods that are produced for domestic consumption are shipped to foreign countries, implying that trade barriers impact on domestic trade as well.
By specifying the theory-based gravity equation in domestic trade terms and explicitly solving for the multilateral resistance variables and bilateral trade costs from the general equilibrium model, Novy [26] obtained the tariff equivalent total trade costs (τij) by taking a geometric mean of trade costs in both directions minus one as
 (6)
(6)
where τij is the total trade cost (i.e. measures bilateral trade costs relative to domestic trade costs), tijtji is the bilateral trade costs of countries i and j and tiitjj is the domestic trade costs of countries i and j. The measure of the international component of trade costs net of distribution costs in the destination country is given as
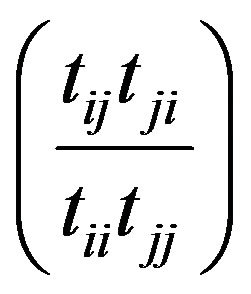 .
.
This captures what makes international trade costly over and above domestic trade.
Intuitively, Equation (6) indicates that when bilateral trade costs decrease relative to domestic trade costs, total trade costs (τij) will decrease, making it easier for countries i and j to trade relative to domestic trade. This will therefore imply that bilateral trade flows will increase relative to domestic trade flows. Similarly, if bilateral trade flows increase relative to domestic trade flows, one can infer that it has become easier for the two countries to trade (possibly because bilateral trade costs have declined relative to domestic trade cost), and this will be reflected in a decline in total trade costs.
Novy [26] showed how the micro-founded trade cost function (i.e. Equation (6)) is not specific to the endowment (conditional general equilibrium ) model but that it can be derived from unconditional general equilibrium trade models—the Ricardian model of Eaton and Kortum [29] and the heterogeneous firms’ models by Chaney [30] and Melitz and Ottaviano [31].
Using a similar approach Novy [26] derived the tariff equivalent total trade costs function from the unconditional general equilibrium trade models of Eaton and Kortum [29] Chaney [30] and Melitz and Ottaviano [31] as given in Equations (7)-(9) respectively.
 (7)
(7)
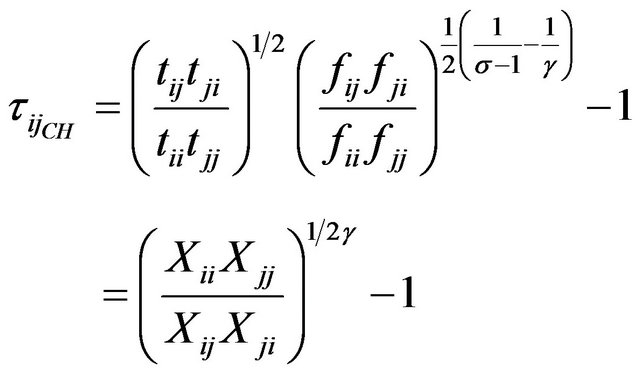 (8)
(8)
 (9)
(9)
The trade cost measures in Equations (8) and (9) are the same although (8) incorporates fixed costs of exporting (as discussed by Chaney [30] whilst in (9) there is no fixed cost of exporting (Melitz and Ottaviano [31]). This is so because while Chaney [30] considered fixed and variable cost of exporting, Melitz and Ottaviano [31] argued that exporting firms only face variable costs of exporting because all fixed costs are incurred before entry into the export market. The derived measure of trade cost by Novy [26] is therefore consistent with the Ricardian and heterogeneous firms’ models of trade.
4. Methodology and Data
4.1. Model Specification
The empirical approach adopted in this study is to estimate a trade cost equation to obtain the tariff equivalent trade cost measure for ECOWAS countries that expresses the trade cost parameters as a function of observable trade data, derived in (6) as
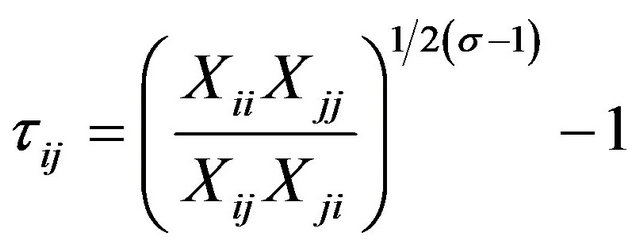 (10)
(10)
where τij is the tariff equivalent trade cost (i.e. measures domestic trade relative to bilateral trade), Xii and Xjj is the domestic trade of countries i and j respectively, Xij and Xji is the bilateral trade of countries i and j respectively, and σ is the elasticity of substitution.
4.2. Sources of Data
Data for our analysis is obtained from two sources. Data for estimating the tariff equivalent trade cost measure will be constructed from the Trade and Production Database published by CEPII. Data for the second stage of analysis will be constructed from the COMTRADE database of the UN and it involves bilateral trade and tariff data for the period 1990-2009. The Trade and Production Database published by CEPII provide an updated version of the worldwide data used in Mayer and Zignago [32]. The database contains two main groups of information. The first group which is in two parts covers 28 industrial sectors in the ISIC (International Standard Industrial Classification) Revision 2. The first part is bilateral trade for 1980-2003 based on BACI, one of the most exhaustive worldwide datasets publicly available. The second part is an extension of industrial production figures from the Trade, Production and Protection database by Alessandro Nicita and Marcelo Olarreaga (World Bank). Information at the country level consists of geographic data used for the estimation of gravity equations published by CEPII, and data on GDP from the World Development Indicators database published by the World Bank.
To meet the study objectives, the sector (ISIC rev 2) level bilateral trade and production data is aggregated to the country level. The database used for the study contains information on 13,174 bilateral country-years, covering about 128,000 observations for 24 years over 1980-2003. The analysis focuses on the production and trade in manufactures only.
In order to focus our analyses on Africa, we concentrate mainly on bilateral trade relations involving African countries. This leaves us with a final panel of about 3346 bilateral country-years covering 13,184 annual observations. With the final dataset, bilateral countries appear in only 7 years on average, making the dataset unbalanced. The use of unbalanced data partially allows bilateral countries to enter and exit the panel. The dataset also contains geographic information that allows us to divide the bilateral country-years into different economic blocs/regions. By this information, we will be able to carry out regional analyses, making it easier for us to identify the differences that exist between bilateral trading partners from different economic blocs/regions. Bilateral exports (Xij and Xji) (Gross Exports valued at F.O.B and denominated in thousands of US dollars) data used in this study are sourced from the CEPII database and UN COMTRADE. Domestic trade or internal flows for the exporting (i.e. Xii) and importing (i.e. Xjj) country is defined as total production minus total exports of manufactures. This is also denominated in thousands of US dollars and is sourced from the CEPII database.
The choice of a value for the elasticity of substitution (σ) is very important in the estimation of the trade cost measure. Since the trade cost measure derived in (10) is synonymous to the trade costs measure derived from other models (see Equations (7)-(9)), the choice of a value for σ will depend on values of different parameters used in the other models, namely the Fréchet parameter ϑ and the Pareto parameter γ.
Survey estimates of σ in Anderson and van Wincoop [2] indicates that σ typically falls in the range of 5 to 10. Eaton and Kortum [29] report their baseline estimate for ϑ as approximately equal to 8, while Helpman, Melitz and Yeaple [33] estimate 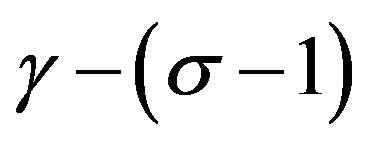 to be around unity, which implies γ ≈
 . Novy (2010) followed closely Anderson and van Wincoop [2] in setting σ = 8, indicating that it corresponds to ϑ, γ = 7. According to Novy [26] the choice of
  = 8 can be seen as an approximate parameter value suitable for aggregate trade flows. This study will set
  = 8 in line with previous studies.
5. Estimation and Analysis of Results
The results obtained in this section relate to our estimate of the tariff equivalent trade cost measure which is obtained from estimating Equation (10) with an elasticity of substitution set equal to 8 (i.e. σ = 8). A decline (an increase) in our estimate of the tariff equivalent trade cost implies that bilateral trade flows have increased (decreased) relative to domestic trade flows, and this would be as a result of a decrease (an increase) in bilateral trade costs relative to domestic trade cost.
5.1. Overall Average Bilateral Trade Costs7
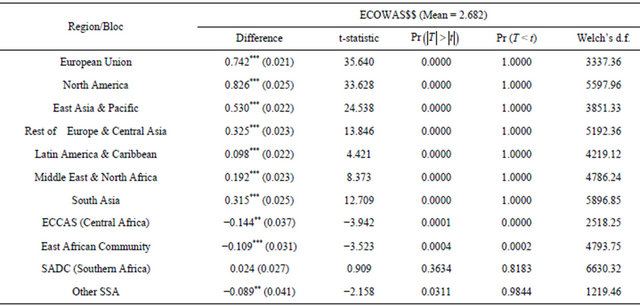
The results in Table 2 show the estimated tariff equivalent trade cost of the different regional or economic blocs involved in the global trading system. Over the period 1980-2003, the cost of trading within SSA was the highest at an average tariff equivalent of 271.5 percent. This finding confirms data from the World Bank’s Doing Business database which indicates that the trading costs in SSA, in general, is the highest within the global trad-
Table 2. Test for difference in overall bilateral average trade costs by region/bloc (1980-2003).
$$ SSA Average = 2.715; *p < 0.10, **p < 0.05, ***p < 0.01; Standard errors are shown in parenthesis.
ing system and is about twice as high as those in highincome OECD countries. As shown in Table 2, SSA countries from the various regional blocs had the highest bilateral trade costs with all trading partners. On average ECOWAS countries traded with their trading partners at a tariff equivalent trade cost of 268.2 percent, higher than countries from other regional blocs within and out of SSA. The trade costs in North America was the lowest at 185.68 percent, while that of the EU, East Asia & Pacific and South Asia was estimated at an average of 193.9 percent, 215.2 percent and 236.6 percent over the same period respectively.
To find out if the average trade costs across blocs differ significantly from the average trade costs of ECOWAS countries, the study conducted t-tests to test the null hypothesis that there is no statistically significant difference between the average trade cost of the various blocs and ECOWAS. The t-test results as shown in Table 2 indicates that the tariff equivalent trade cost for ECOWAS countries was significantly higher than countries from all the other regions out of SSA at 1% level of significance. Within SSA, overall bilateral trade costs of ECOWAS countries with trading partners was significantly lower than countries from the Economic Community of Central African States (ECCAS), East African Community and other SSA (shown in Table 2). The results however indicate that statistically there is no difference between the trade cost of ECOWAS and SADC.
5.2. Average Bilateral Trade Costs Involving ECOWAS Countries9
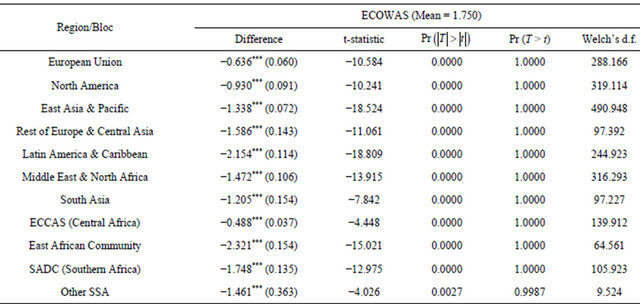
With regards to trade flow involving ECOWAS countries, estimates of tariff equivalent trade costs obtained from estimating Equation (10) indicates that on average ECOWAS countries traded among each other at a lower cost than with other trading partners from economic blocs out of ECOWAS. This could be attributed to the positive impact of regional trade integration efforts. Over the years especially since 2000, ECOWAS seemed to have promoted intra-ECOWAS trade especially with regards to export of manufactures. For instance between 2000 and 2006, annual average intra-ECOWAS exports was valued at US $4.4 billion compared to the US $3.4 billion exports from ECOWAS to all trading partners between 1980 and 2003. The export diversification index (EDI)10 for ECOWAS has declined from 0.83 in 2000 to 0.77 in 2008 (see UNCTAD [34]).
A test for the difference in means shown in Table 3 indicates that significantly intra-ECOWAS trade costs was significantly lower that ECOWAS trade costs with other blocs within SSA. Relatively ECOWAS countries on average traded at a significantly lower cost with the EU than with other sub-regional blocs in SSA. This could be attributable to the EU-ACP preferential trade agreement between the EU and almost all countries within the SSA sub-region.
5.3. Average Bilateral Trade Costs among ECOWAS Countries11
With regards to countries within ECOWAS, intraECOWAS trade costs with Cote d’Ivoire was the lowest at an average tariff equivalent trade cost of 138.5 percent and this was significantly lower than Ghana, Nigeria and Benin (as shown in Table 4). Ghana and Senegal’s intra-ECOWAS trade cost over the entire period increased during the early 1980s peaking just before 1990. This could be attributable to supply bottle necks experienced during the early 1980s in the manufacturing sector in Ghana and Senegal.
5.4. Country-Specific Bilateral Trade Costs-ECOWAS12
Estimates of ECOWAS country-specific bilateral trade cost shown in Table 5 shows a similar pattern for all the countries. Relatively each of the ECOWAS countries traded at a lower intra-ECOWAS trade cost than with other blocs within and out of SSA.
6. Conclusions
Trade costs are enormous globally and West Africa in particular, empirical evidence on the extent of trade costs and its actual effect on trades in ECOWAS region have been difficult to measure. High and rising trade cost is having an adverse impact on trade within the sub-region. Given the importance of trade costs in affecting trade flow among nations, and low level of both intra-regional and inter-regional trade of ECOWAS member countries, a clear understanding of the trade costs and its level is very important in order to promote deeper integration of the economies across the region.
Table 3. Test for difference in bilateral average trade costs with ECOWAS by region/bloc.
*p < 0.10, **p < 0.05, ***p < 0.01; Standard errors are shown in parenthesis.
Table 4. Test for difference in bilateral average trade costs among ECOWAS countries.

$$Ghana’s Mean = 1.997; *p < 0.10, **p < 0.05, ***p < 0.01; Standard errors are shown in parenthesis.
Table 5. Test for difference in bilateral average trade costs by region ECOWAS countries.
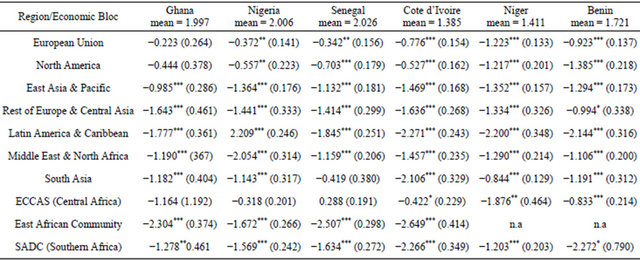
*p < 0.10, **p < 0.05, ***p < 0.01; Standard errors are shown in parenthesis.
This paper seeks to empirically measure tariff equivalent of trade costs and its effect on trade in some ECOWAS countries. Our results indicate that over the period 1980-2003, the cost of trading within SSA was the highest at an average tariff equivalent of 271.5 percent. This finding confirms data from the World Bank’s Doing Business database which indicates that the trading costs in SSA, in general, is the highest within the global trading system and is about twice as high as those in high-income OECD countries. We also find that on average ECOWAS countries traded with their trading partners at a tariff equivalent trade cost of 268.2 per cent, higher than countries from other regional blocs within and out of SSA.
With regards to trade flow involving ECOWAS countries, estimates of tariff equivalent trade costs indicates that on average ECOWAS countries traded among each other at a lower cost than with other trading partners from economic blocs out of ECOWAS probably due to the positive impact of regional trade integration efforts and promotion of intra-ECOWAS trade especially with regards to export of manufactures since 2000. With regards to countries within ECOWAS, intra-ECOWAS trade costs with Cote d’Ivoire were the lowest at an average tariff equivalent trade cost of 138.5 per cent and this was significantly lower than Ghana, Nigeria and Benin. Relatively each of the ECOWAS countries traded at a lower intra-ECOWAS trade cost than with other blocs within and out of SSA.
REFERENCES
- De Prabir, “Impact of Trade Costs on Trade: Empirical Evidence from Asian Countries,” Asia-Pacific Research and Training Network on Trade Working Paper, 2007. http://www.unescap.org/tid/artnet/pub/tipub2466.pdf.
- J. E. Anderson and E. van Wincoop, “Trade Costs,” Journal of Economic Literature, Vol. 42, No. 3, 2004, pp. 691- 751. doi:10.1257/0022051042177649
- H. A. Khan and J. Weiss, “Infrastructure for Regional Cooperation,” The Joint Workshop of ADBI and IDB in Seoul, 15-17 November 2006.
- M. Obstfeld and K. S. Rogoff, “The Six Major Puzzles in International Macroeconomics: Is There a Common Cause?” In: B. S. Bernanke and K. S. Rogoff, Eds., NBER Macroeconomics Annual 2000, MIT Press, Cambridge, 2000, pp. 339-389.
- “The Costs and Benefits of Trade Facilitation,” Organisation for Economic Cooperation and Development (OECD), Paris, 2005.
- J. Francios and M. Manchin, “Institutional Quality, Infrastructure and Propensity to Export,” Policy Research Working Paper, The World Bank, 2006.
- A. Irarrazabaly, M. Andreas and D. O. Luca, “The Tip of the Iceberg: Modeling Trade Costs and Implications for Intra-Industry Reallocation,” CEPR Discussion Papers, 2010.
- O. B. Alaba, “EU-ECOWAS EPA: Regional Integration, Trade Facilitation and Development in West Africa,” Draft Paper for Presentation at the GTAP Conference, United Nations Economic Commission for Africa (UNECA), Addis Ababa, 2006.
- A. Portugal-Perez and J. S. Wilson, “Trade Costs in Africa: Barriers and Opportunities for Reform” World Bank Policy Research Working Paper, The World Bank, 2008.
- The World Bank, “Doing Business Database,” The World Bank, Washington, 2008. http://www.doingbusiness.org/
- “Unlocking Africa’s Trade Potential. Addis Ababa,” United Nations Economic Commission for Africa, 2004.
- C. Carrere, “African Regional Agreements: Impact on Trade with or without Currency Unions,” Journal of African Economies, Vol. 13, No. 2, 2003, pp. 199-239.
- S. N. Karingi and V. Leyaro, “Monitoring Aid for Trade in Africa: An Assessment of the Effectiveness of the Aid for Trade,” African Trade Policy Centre Work in Progress, 2009.
- Doing Business, “Making a Difference for Entrepreneurs,” The World Bank and the International Finance Corporation, 2011.
- United Nations Economic Commission for Africa (UNECA), “Assessing Regional Integration in Africa IV: Enhancing Intra-African Trade,” 2010.
- Economic Commission for Africa, “Trade Facilitation to Promote Intra-African Trade, Report of Committee on Regional Cooperation and Integration,” 2005.
- N. Banik and G. John, “Regional Integration and Trade Costs in South Asia,” ADB Institute Working Paper, 2008.
- C. Engel and J. H. Rogers, “How Wide Is the Border?” American Economic Review, Vol. 86, No. 5, 1996, pp. 1112- 1125.
- M. Obstfeld and A. M. Taylor, “Nonlinear Aspects of Goods-Market Arbitrage and Adjustment: Heckscher’s Commodity Points Revisited,” Journal of the Japanese and International Economies, Vol. 11, No. 4, 1997, pp. 441-479. doi:10.1006/jjie.1997.0385
- J. Tinbergen, “Shaping the World Economy: Suggestions for an International Economic Policy,” Twentieth Century Fund, New York, 1962.
- J. H. Bergrstrand and E. Peter, “Gravity Equations and Economic Frictions in the World Economy,” In: D. Bernhofen, R. Falvey, D. Greenaway and U. Krieckemeier, Eds., Palgrave Handbook of International Trade, Palgrave-Macmillan Publishing, 2011.
- J. E. Anderson, “A Theoretical Foundation for the Gravity Equation,” American Economic Review, Vol. 69, No. 1, 1979, pp. 106-116.
- J. E. Anderson and E. van Wincoop, “Gravity with Gravitas: A Solution to the Border Puzzle,” American Economic Review, Vol. 93, No. 1, 2003, pp. 170-192. doi:10.1257/000282803321455214
- J. McCallum, “National Borders Matter: Canada-US Regional Trade Patterns,” American Economic Review, Vol. 85, No.3, 1995, pp. 615-623.
- C. Engel, “Comment on Anderson and van Wincoop,” In: S. Collins and D. Rodrik, Eds., Brookings Trade Forum 2001, Brookings Institute, Washington, 2002.
- D. Novy, “Gravity Redux: Measuring International Trade Costs with Panel Data,” 2010. http://www2.warwick.ac.uk/fac/soc/economics/staff/faculty/novy/fast.pdf
- D. T. Coe, A. Subramanian and N. T. Tamirisa, “The Missing Globalisation Puzzle,” IMF Working Paper, 2002.
- K. Head and J. Ries, “Increasing Returns vs National Product Differentiation as an Explanation for the Pattern of US-Canada Trade,” American Economic Review, Vol. 91, No. 4, 2001, pp. 858-876.
- J. Eaton and S. Kortum, “Technology, Geography and Trade,” Econometrica, Vol. 70, No. 5, 2002, pp. 1741- 1779. doi:10.1111/1468-0262.00352
- T. Chaney, “Distorted Gravity: The Intensive and Extensive Margins of International Trade,” American Economic Review, Vol. 98, No. 4, 2008, pp. 1707-1721. doi:10.1257/aer.98.4.1707
- M. J. Melitz and G. I. P. Ottaviano, “Market Size, Trade, and Productivity,” The Review of Economic Studies, Vol. 75, No. 1, 2008, pp. 295-316. doi:10.1111/j.1467-937X.2007.00463.x
- T. Mayer and S. Zignago, “Market Access in Global and Regional Trade,” CEPII Working Paper, 2005.
- E. Helpman, J. M. Marc and R. Y. Stephen, “Exports versus FDI with Heterogeneous Firms,” American Economic Review, Vol. 94, No. 1, 2004, pp. 300-316. doi:10.1257/000282804322970814
- “Trade and Development Report,” UNCTAD/TDR/2008, United Nations Publication.
NOTES

1See Karingi and Leyaro [13] also explain that transport costs may harm economic performance in Africa via its negative effect on efficient production that discourages foreign direct investment.
2Trade costs could be categorised into tariff barriers which are policy induced and non-tariff barriers which may or not be policy induced. The non-policy induced non-tariff barriers in particular have been recognized to constitute the most significant hindrances to integration, trade and more importantly export supply response capacity of West Africa. For Anderson and van Wincoop [2], direct policy instruments such as tariffs and quotas are less important in impacting on trade flows compared to barriers such as lack of infrastructure, informational institutions, law enforcement and local distribution costs. For Banik and Gilbert [17], these factors have been recognized to be more important than price factors, like tariffs and exchange rates, in affecting trade flows.
3Some studies have inferred trade costs from prices. Engel and Rogers [18], Obstfeld and Taylor [19] inferred trade barrier costs from relative prices based on the concept of arbitrage by employing the changes in relative prices over time to extract information about trade costs.
4The Law states that two bodies are attracted to each other with a force that is directly proportional to their masses and inversely proportional to the square of the distance between.
5McCallum [24] estimated a version of the traditional equation for US states and provinces of Canada and found trade between provinces to be twenty-two times more than trade between states and provinces, suggesting that there were substantial trade costs incurred in trade across the United States-Canada border.
6In fact, Gravity models have also been used to explain various types of inter-regional and international flows (including labor migration, commuting, customers, hospital patients, and international trade) and served as a baseline model for estimating the impact of a variety of policy issues, including regional trading groups, currency unions, political blocs, patent rights, and various trade distortions.
7This is the ad-valorem tariff equivalent bilateral trade costs over the entire period 1980-2003 with regards to trade flows between countries in each bloc with all trading partners.
8This is obtained by subtracting the difference in means between ECOWAS and North America (=0.826) from the mean of ECOWAS (=2.682).
9This is the ad-valorem tariff equivalent bilateral trade costs over the entire period 1980-2003 with regards to trade flows involving the ECOWAS countries within the sample.
10The EDI published by UNCTAD measures the difference in the structure of trade by a country and the global average. The closer the EDI is to 1, the bigger the difference.

11This is the ad-valorem tariff equivalent bilateral trade costs over the entire period 1980-2003 with regards to trade flows among ECOWAS countries
12Country-level ad-valorem tariff equivalent bilateral trade costs for Six ECOWAS countries.

