Journal of Environmental Protection
Vol.07 No.01(2016), Article ID:62652,10 pages
10.4236/jep.2016.71007
Contamination of Industrial Waste Water in Central India
Ankit Yadav1, Keshaw Prakash Rajhans1, Shobhana Ramteke1, Bharat Lal Sahu1, Khageshwar Singh Patel1*, Borislav Blazhev2
1School of Studies in Chemistry/Environmental Science, Pt. Ravishankar Shukla University, Raipur, India
2Central Laboratory for Chemical Testing and Control, Sofia, Bulgaria

Copyright © 2016 by authors and Scientific Research Publishing Inc.
This work is licensed under the Creative Commons Attribution International License (CC BY).
http://creativecommons.org/licenses/by/4.0/


Received 7 December 2015; accepted 8 January 2016; published 11 January 2016
ABSTRACT
The most of iron, cement, paper and plastic related industries are running in Raipur area of the country. They use a large amount of water by discharging effluents into the streams and rivers by polluting nearby water resources. In this work, the physico-chemical characteristics of discharged waste water of 34 industries (i.e. iron, steel, power, paper and polymer) are described. The waste water is found to be acidic in nature with high contents of F− and other ions.
Keywords:
Waste Water Quality, Acidity, Fluoride, Metals

1. Introduction
Industrial wastewater is one of the important contaminating sources in pollution of the water environment. Industries that use large amounts of water for the processings have the potential to pollute waterways through the discharge of their wastes into streams, rivers and nearby water sources. They include organic materials, pathogens, metals, salts, ammonia, pesticides, pharmaceuticals, endocrine disruptors, etc., and cause adverse impacts in the surrounding water resources [1] - [15] .
The most of iron and cement industries of the country is running in the Raipur area, central India due to huge availability of the raw materials. At least 600 sponge iron and 20 cement industries are running by roasting minerals and coal by adding effluents into the environments. In addition, other industries such as paper and polymer industries also emit effluents into the environments. In this work, the quality of waste water released by iron, cement, paper and plastic industries of Raipur city, central India is described.
2. Materials and Methods
2.1. Study Area
Raipur is mainly an industrial city, being the largest steel market of India. It is a capital of Chhattisgarh state with population of 2.0 million. The city has steel, coal, power, cement and rice milling industries. At least 500 medium and large sizes industries in two industrial sectors: Siltara and Urla of Raipur city are in operation. The remaining industries are running in the Bhilai, Jamul and Durg areas. The one of the Asia biggest steel plant, Bhilai Steel Plant (BSP) with capacity of 4.8 MT iron/Yr is running with subsequent dumping of the industrial effluents over area »12 km2. The BSP includes 67 coke ovens, 3 sintering plants, 7 blast furnaces, 2 steel melting shops, rolling mills, rail and structural mills, merchant mills, wire rods mills and plate mills. In this work, the quality of waste water released by 34 industries are described.
2.2. Sample Collection
The industrial waste water samples were collected from different 34 industries during February 2012 by using established methodology, as shown in Figure 1 [16] . For the BSP, the water is supplied from Tandula reservoir through »60 km long canal into the water supply pond (WSP). There is an ore washing pond (OWP) nearby the WSP. The wastes have been dumping in the surrounding area, dumping pond (DP). The area of DP, OWP and WSP are being »12, 7 and 5 km2, respectively. Six composite samples (S1-6) were collected from various sketches of the DP of the BSP. Sample no. S7 and S8 were collected from the OWP and WSP, respectively. Sample no. S9 was collected from source point (SP) of the BSP sludge waste.
The cleaned polyethylene bottle (1 L) was used for the sample collection. It was ringed thrice with the same water prior to the sampling, and filled up to the mouth. The physical parameters i.e. temperature (T), pH, electrical conductivity (EC), dissolved oxygen (DO) and reduction potential (RP) were measured at the spot. The collected water samples were dispatched to the laboratory by cooling them into the freezer at −4˚C.
2.3. Analysis
The water samples were filtered with glass micro filter of pore size, 2 µm. The total dissolved solid (TDS) value of the sample was determined by evaporation method [16] . The total hardness (TH) value was analyzed by the titration methods [17] . The fluoride content of the water was analyzed by the ion selective method using Metrohm-781 ion meter using the total ionic strength adjustment buffer (TISAB). The contents of other ions were quantified by the Dionex ion chromatography-1100. The metal contents were analyzed by Varian Liberty AX Sequential ICP-AES and Varian AA280FS Atomic Absorption spectrophotometer. Other elements i.e. Cd, Pb, As, Hg and Se were analyzed by using the Varian SpectrAA 220Z and equipped with the VGA-77.
The weighed arithmetic method was used for evaluation of the water quality index (WQI) of the water by using five parameters i.e. pH, DO, EC, TDS and  values with the help of following expression [18] [19] .
where:
qn = Quality rating of the nth water quality parameter
Vn = Estimated value of the nth parameter of a given water
Sn = Standard permissible value of the nth parameter
Vio = Ideal value of the nth parameter of pure water (i.e. 0 for all other parameters) except pH and dissolved oxygen (7.0 and 14.6 mg/L, respectively)
Wn = Unit weight for the nth parameter
3. Results and Discussion
3.1. Physical Characteristics
The physical characteristics of the waste water are summarized in Table 1. The pH value of all waste waters (n = 34) was ranged from 1.2 - 6.9 with mean value of 5.9 ± 0.6. All waters were found to be acidic in nature due to

Table 1. Physical characteristics of industrial waste water.

Figure 1. Representation of sampling locations of industrial waste water the study area, CG, India.
presence of acids i.e. HNO3 at excessive levels. The value of T, EC, RP, DO, TDS and TH was ranged from 20˚C - 30˚C, 1050 - 16,860 µS/cm, 28 - 647 mV, 4.9 - 7.5 mg/L, 2894 - 22,913 mg/L and 140 - 1170 mg/L with mean value of 25˚C ± 1˚C, 3864 ± 1327 µS/cm, 178 ± 46 mV, 6.4 ± 0.2 mg/L, 5700 ± 1159 mg/L and 505 ± 82 mg/L, respectively. The value of EC, TDS and TH was found to be far above the recommended value 300 µS/cm, 500 mg/L and 300 mg/L, respectively [18] [19] . The reducing capacity of some waste waters was found too low, may be due high dissolved organic carbon (DOC) and HNO3.
3.2. Chemical Characteristics
The chemical characteristics of the waste water is shown in Table 2. The concentration of F−, Cl−,  ,
,  ,
,
Na+, K+, Mg2+ and Ca2+ was ranged from 1.7 - 9.9, 11 - 169, 290 - 1310, 28 - 647, 30 − 10,250, 11 − 10,638, 24 - 850 and 22 - 230 mg/L with mean value of 3.6 ± 0.7, 89 ± 13, 825 ± 99, 162 ± 33, 827 ± 690, 827 ± 785, 103 ± 64 and 126 ± 19 mg/L, respectively. Two ions i.e. Na+ and K+ were found at excessive levels due to mineralization in water from the ores and coal. The concentration of F−, NO3−, Mg2+ and Ca2+ was found to be higher than
Table 2. Chemical characteristics of industrial waste water, mg/L.
recommended value of 1.5, 45, 30 and 75 mg/L, respectively [18] [19] . They were occurred in following increasing order: F− << Cl− < Mg2+ < Ca2+ <  <
<  » Na+ » K+.
3.3. Concentration of Metals in Sludge Water
The contamination of heavy metals was determined in the SP, DP, OWP and WSP of the BSP, Table 3. The concentration of As, Se, Fe, Cr, Mn, Ni, Cu, Zn, Cd, Pb and Hg was ranged from 0.6 - 7.8, 0.06 - 0.21, 0.7 - 5.0, 0.31 - 0.62, 0.4 - 1.0, 0.03 - 0.12, 0.7 - 1.5, 0.1 − 2.70, 0.06 - 0.25, 0.3 - 1.2 and 0.03 - 0.12 mg/L with mean value of 2.9 ± 1.4, 0.13 ± 0.03, 3.2 ± 1.1, 0.47 ± 0.07, 0.64 ± 0.15, 0.08 ± 0.02, 1.1 ± 0.2, 0.63 ± 0.56, 0.20 ± 0.04, 0.71 ± 0.21 and 0.07 ± 0.02 mg/L, respectively. Among heavy metals, the highest concentration of as was observed in the sludge water, Figure 2.

Figure 2. Distribution of heavy metals in the BSP waste water.
Table 3. Concentration of chemical species in sludge waste water of Bhilai steel plant, mg/L.
3.4. Spatial Variations
The lowest pH value of the paper waste was found, may be due to acid treatment of the pulp, Figure 3. The lower RP values were marked in the case of iron, cement and polymer wastes, may be due to excessive loading of the oxidizing wastes. However, the comparable values of DO and TH were seen in the all wastes, Figure 3. Remarkably higher concentration of Na+, K+, Mg2+ and  was detected in the paper effluents, Figure 4. Fluoride was released in the roasting of iron, cement, paper and polymer materials, and its elevated concentration was observed in the iron effluents, may be due to contamination of the minerals and coal with fluorites, Figure 4.
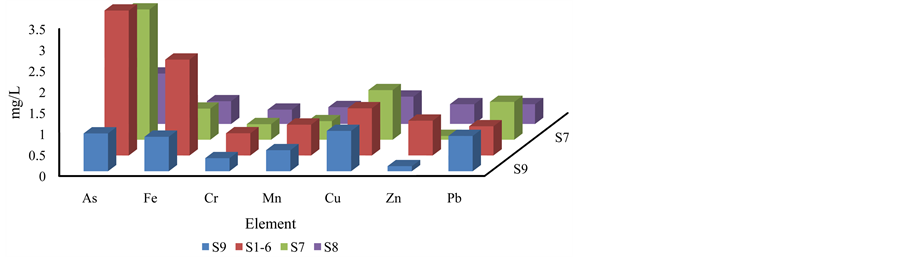
The spatial variation of heavy metals at point source of waste effluent (S7), dumping lake (S1-6), washing tank (S8) and water supply Tank (S9) is presented in Figure 5. The higher concentration of the most of the metals was observed in the waste waters (S7 and S1-6).
3.5. Water Quality Assessment
The water was found to be acidic and hard in nature. The WQI value was ranged from 168 - 2153 with a mean value of 574 ± 177. The concentration of As, Se, Cr, Mn, Fe, Ni, Cd, Pb and Hg was found to be higher than recommended value of 0.01, 0.01, 0.05, 0.5, 0.3, 0.02, 0.003, 0.01 and 0.001 mg/L, respectively [18] [19] . The industrial waste water was seemed to be unsuitable for drinking purposes for animals, aquatics and birds.

Figure 3. Variation of physical parameters in various industrial waste.
 (a)
(a) (b)
(b) (c)
(c)
Figure 4. Variation of chemical parameters in various industrial waste.
 (a)
(a) (b)
(b)
Figure 5. Variation of heavy metals in BSP waste water (S1-6 and S7), washing water (S8) and lake water (S9).
4. Conclusion
All types of industrial wastes i.e. iron, cement, paper and polymer were observed to be acidic in nature with remarkable high EC and TDS values. Some wastes showed too low RP values, and might be due to excessive loading of the oxidizing agents. They were found to be highly enriched with elements i.e. F−, Na+ and K+. The iron sludge wastes were contaminated with toxic heavy metals beyond permissible limits.
Acknowledgements
We are thankful to our University for providing special equipment grant to the SOS in Environmental Science.
Cite this paper
AnkitYadav,Keshaw PrakashRajhans,ShobhanaRamteke,Bharat LalSahu,Khageshwar SinghPatel,BorislavBlazhev, (2016) Contamination of Industrial Waste Water in Central India. Journal of Environmental Protection,07,72-81. doi: 10.4236/jep.2016.71007
References
- 1. Chinhanga, J.R. (2010) Impact of Industrial Effluent from an Iron and Steel Company on the Physico-Chemical Quality of Kwekwe River Water in Zimbabwe. International Journal of Engineering Science and Technology, 2, 129-140.
http://www.ijest-ng.com/vol2_no7/ijest-ng-vol2-no7-pp129-140.pdf - 2. Tariq, M., Ali, M. and Shah, Z. (2006) Characteristics of Industrial Effluents and their Possible Impacts on Quality of Underground Water. Soil and Environment, 25, 64-69.
http://waterinfo.net.pk/sites/default/files/knowledge/Characteristics%20of%20Industrial%20Effluents%20and%20their%20Possible%20Impacts.pdf - 3. Sial, R.A., Chaudhary, M.F., Abbas, S.T., Latif, M.I. and Khan, A.G. (2006) Quality of Effluents from Hattar Industrial Estate. Journal of Zhejiang University Science B, 7, 974-980.
http://dx.doi.org/10.1631/jzus.2006.B0974 - 4. Manzoor, S., Shah, M.H., Shaheen, N., Khalique, A. and Jaffar, M. (2006) Multivariate Analysis of Trace Metals in Textile Effluents in Relation to Soil and Groundwater. Journal of Hazardous Materials, 137, 31-37.
http://dx.doi.org/10.1016/j.jhazmat.2006.01.077 - 5. Ranganathan, K., Jeyapaul, S. and Sharma, D.C. (2007) Assessment of Water Pollution in different Bleaching Based Paper Manufacturing and Textile Dyeing Industries in India. Environmental Monitoring and Assessment, 134, 363-372.
http://dx.doi.org/10.1007/s10661-007-9628-z - 6. Torres-Guzman, F., Avelar-Gonzalez, F.J. and Rico-Martinez, R. (2010) An Assessment of Chemical and Physical Parameters, Several Contaminants including Metals, and Toxicity in the Seven major Wastewater Treatment Plants in the State of Aguascalientes, Mexico. Journal of Environmental Science and Health Part A, Toxic/ Hazardous Substances and Environmental Engineering, 45, 2-13.
http://dx.doi.org/10.1080/10934520903388517 - 7. Singh, V. and Singh Chandel, C.P. (2006) Analytical Study of Heavy Metals of Industrial Effluents at Jaipur, Rajasthan (India). Journal of Environmental Science and Engineering, 48, 103-108.
- 8. Bakopoulou, S., Emmanouil, C. and Kungolos, A. (2011) Assessment of Wastewater Effluent Quality in Thessaly Region, Greece, for Determining Its Irrigation Reuse Potential. Ecotoxicology and Environmental Safety, 74, 188-194.
http://dx.doi.org/10.1016/j.ecoenv.2010.06.022 - 9. Ahmad, M., Bajahlan, A.S. and Hammad, W.S. (2008) Industrial Effluent Quality, Pollution Monitoring and Environmental Management. Environmental Monitoring and Assessment, 147, 297-306.
http://dx.doi.org/10.1007/s10661-007-0121-5 - 10. Alam, R. and Hossain, M.D. (2009) Wastewater Quality of Natural Gas Fertilizer Factory, Fenchuganj and Water Quality of Kushiara River at the Down Stream. Environmental Monitoring and Assessment, 154, 127-133.
http://dx.doi.org/10.1007/s10661-008-0383-6 - 11. Reis, A.T., Rodrigues, S.M., Araújo, C., Coelho, J.P., Pereira, E. and Duarte, A.C. (2009) Mercury Contamination in the Vicinity of a Chlor-Alkali Plant and Potential Risks to Local Population. Science of the Total Environment, 407, 2689-2700.
http://dx.doi.org/10.1016/j.scitotenv.2008.10.065 - 12. Walakira, P. and Okot-Okumu, J. (2011) Impact of Industrial Effluents on Water Quality of Streams in Nakawa-Ntinda, Uganda. Journal Applied Science and Environmental Management, 15, 289-296.
http://www.bioline.org.br/pdf?ja11050
http://dx.doi.org/10.4314/jasem.v15i2.68512 - 13. Hussain, M. and Prasad Rao, T.V.D. (2013) Effect of Industrial Effluents on Surface Water Quality—A Case Study of Patancheru, Andhra Pradesh, India. Current World Environment, 8, 445-454.
- 14. Al-Musharafi, S.K., Mahmoud, I.Y. and Al-Bahry, S.N. (2014) Environmental Contamination by Industrial Effluents and Sludge Relative to Heavy Metals. Journal of Geoscience and Environment Protection, 2, 14-18.
http://dx.doi.org/10.4236/gep.2014.22003 - 15. Chinhanga, J.R. (2010) Impact of Industrial Effluent from an Iron and Steel Company on the Physico-Chemical Quality of Kwekwe River Water in Zimbabwe. International Journal of Engineering Science and Technology, 2, 129-140.
http://www.ijest-ng.com/vol2_no7/ijest-ng-vol2-no7-pp129-140.pdf - 16. APHA (2005) Standard Methods for the Examination of Water and Wastewater. 21st Edition, APHA, AWWA and WEF, Washington DC.
http://www.worldcat.org/oclc/156744115/editions?editionsView=true&referer=di - 17. Nollet Leo, M.L. and De Gelder Leen, S.P. (2007) Handbook of Water Analysis. 2nd Edition, CRC Press, Boca Raton, p. 784. https://www.crcpress.com/Handbook-of-Water-Analysis-Second-Edition/Nollet-De-Gelder/9780849370335
- 18. BIS (2003) Indian Standard Drinking Water Specifications (IS 10500:1991). Ed. 2.2 (2003-2009), Bureau of Indian Standard, New Delhi.
- 19. WHO (2011) Guidelines for Drinking Water Quality. 4th Edition, World Health Organization, Geneva, Switzer Land.
http://apps.who.int/iris/bitstream/10665/44584/1/9789241548151_eng.pdf