Journal of Environmental Protection
Vol.4 No.12(2013), Article ID:40686,17 pages DOI:10.4236/jep.2013.412160
An Environmental Risk Evaluation Method Employing Atmospheric Dispersion Models and GIS
![]()
Graduate School of Information Systems, University of Electro-Communications, Tokyo, Japan.
Email: *k-yamamoto@is.uec.ac.jp
Copyright © 2013 Masakazu Ishii, Kayoko Yamamoto. This is an open access article distributed under the Creative Commons Attribution License, which permits unrestricted use, distribution, and reproduction in any medium, provided the original work is properly cited. In accordance of the Creative Commons Attribution License all Copyrights © 2013 are reserved for SCIRP and the owner of the intellectual property Masakazu Ishii, Kayoko Yamamoto. All Copyright © 2013 are guarded by law and by SCIRP as a guardian.
Received September 13th, 2013; revised October 14th, 2013; accepted November 12th, 2013
Keywords: Environmental Risk; Atmospheric Dispersion Models; GIS; Dioxins; Incinerator
ABSTRACT
This study aims to develop a method for evaluating the environmental risk of harmful chemical substances released from specific sources, using two atmospheric dispersion models and GIS (Geographic Information Systems). In the first stage of evaluation, ADMER was used to conduct a wide-area evaluation which covered the entire area of the evaluation target region. In the second stage, METI-LIS was used to conduct a detailed limited-area evaluation which targeted the vicinity of sources. In this study, incinerators were selected as sources and dioxins were selected as harmful chemical substances. The area selected for evaluation was the Tokyo Metropolis in Japan, and the evaluation method proposed in this study was used to evaluate environmental risk. Through the use of atmospheric dispersion models and GIS, the behavior of dioxins emitted into the atmosphere from incinerators was estimated. By superimposing atmospheric levels and population data, the amounts of dioxins that humans exposed to were found. Additionally, by superimposing deposition amounts and land use data, the amounts of dioxins accumulated in each land environment were found. Conducting these steps enabled the impact of dioxins on humans and the environment to be grasped quantitatively and visually, and the risk that dioxins emitted from incinerators pose to the environment to be evaluated.
1. Introduction
Due to advances in the world’s chemical technology, chemical substances which are beneficial to humans have been researched, developed, and manufactured. However, there are also many chemical substances that are harmful, and chemical substances which are produced artificially in the process of manufacturing things and chemical substances generated unintentionally when things incinerated are having a harmful impact on humans and the ecosystem. Presently, harmful chemical substances released from specific sources—in particular, chemical substances which are harmful to humans, such as carcinogenic substances—exist in the environment in places such as the atmosphere, soil and rivers. Harmful chemical substances such as these which exist in the environment are taken into the human body through routes such as breathing, eating and drinking, and skin contact, and there is a risk that they may affect health. Further, harmful chemical substances accumulate in the ecosystems of plants, animals, fish and so on, through environmental mediums such as the atmosphere and soil [1]. In the environmental risk field, importance is being placed on effectively and economically preventing or reducing the burden on the environment caused by such harmful chemical substances [2,3].
Based on the above background, this study aims to develop a method for evaluating the environmental risk of harmful chemical substances released from specific sources. Further, dioxins, which are representative examples of harmful chemical substances that became an issue of public concern in Japan at the end of the twentieth century, are taken up as an environmental risk for discussion; and focusing on incinerators, which are a major source of dioxins in the atmosphere of the Tokyo Metropolis, Japan [4,5], the environmental risk is evaluated using this evaluation method. Japan’s measures against dioxins are promoted based on the basic guidelines for promotion of measures against dioxins and the law concerning special measures against dioxins, which were formulated in 1999 [6].
2. Related Works
In research related to dioxins [7-12] used atmospheric dispersion models to conduct simulations of the behavior of dioxins with incinerators as a source, similarly to this study. [1,13-15] conducted simulations of the behavior of dioxins using atmospheric dispersion models. [16-20] modeled the behavior of dioxins in the atmosphere. Further, [21,22] used dispersion models to conduct simulations of the behavior of dioxins in bodies of water such as sea waters and canals, and [23] modeled the behavior of dioxins in bodies of water.
[7,8] in the above-mentioned related research conducted a comparison of estimated dioxin levels, which were the results of simulation of behavior of dioxins conducted using ADMER, an atmospheric dispersion model, and actual measured levels of dioxins in the environment. They demonstrated the satisfactory reproducibility of the former, and thereby confirmed the usefulness of this atmospheric dispersion model. Therefore, this study also employs ADMER, when evaluating the environmental risk over a wide area in the first stage of evaluation. Further, [13,18] demonstrated the value of using an atmospheric dispersion model and GIS (Geographic Information Systems) in combination in order to estimate the behavior of dioxins in the atmosphere.
Compared to the preceding studies mentioned above, this study demonstrates its uniqueness in that it develops a method that can quantitatively evaluate impact on humans and the environment based on the behavior of dioxins in the environment. Further, the method can analyze dioxin level distribution using two spatial scales— wide area, and narrow area with high dioxin levels—and evaluate the environmental risk in detail. Further, taking into account the results of preceding studies, in the evaluation method, GIS is used in addition to an atmospheric dispersion model, and through this, dioxin behavior can be spatially analyzed. Therefore, the impact on people and the environment of dioxins released from sources can be quantitatively evaluated. Specifically, the environmental risk is evaluated by using atmospheric dispersion models to calculate atmospheric levels and deposition amounts of dioxins emitted from specific incinerators; using GIS to conduct overlay with population and land environment spatial distribution; and estimating amounts people are exposed to and amounts accumulated in the environment.
3. Evaluation Method
3.1. Evaluation Outline and Method
The evaluation outline and method of this study are as shown in Figure 1. Below, each stage is described in detail.
1) Incinerators were selected as the source to be evaluated, dioxins were selected as the harmful chemical substance which was the index of evaluation, and the environmental risk was evaluated. In Japan, according to the Law Concerning Special Measures against Dioxins, from the year 2000 onward it has been compulsory for places of business to carry out independent measurements of dioxins once a year or more; therefore, this data, which each prefecture releases, was processed into data necessary in calculations for the atmospheric dispersion model, and the source data was created.
2) Based on the created source data, data necessary to the dispersion calculations of the atmospheric dispersion models was entered, and the atmospheric levels and deposition amounts of dioxins released from the sources were calculated. In the evaluation method of this study, two atmospheric dispersion models, ADMER and METILIS, which will be described in detail in the next section, were used. In the evaluation of the entire area of the region for evaluation, in which ADMER was used, the entire area of the Tokyo Metropolis was evaluated. In the evaluation of the vicinity of the sources, in which METILIS was used, regions where the contamination risk from dioxins was high based on evaluation results of the previous stage were selected, and the areas surrounding general waste incinerators were the main targets of evaluation.
3) Results of analysis obtained using the atmospheric dispersion models were displayed on digital maps using GIS, and spatial analysis was conducted. Superimposi-
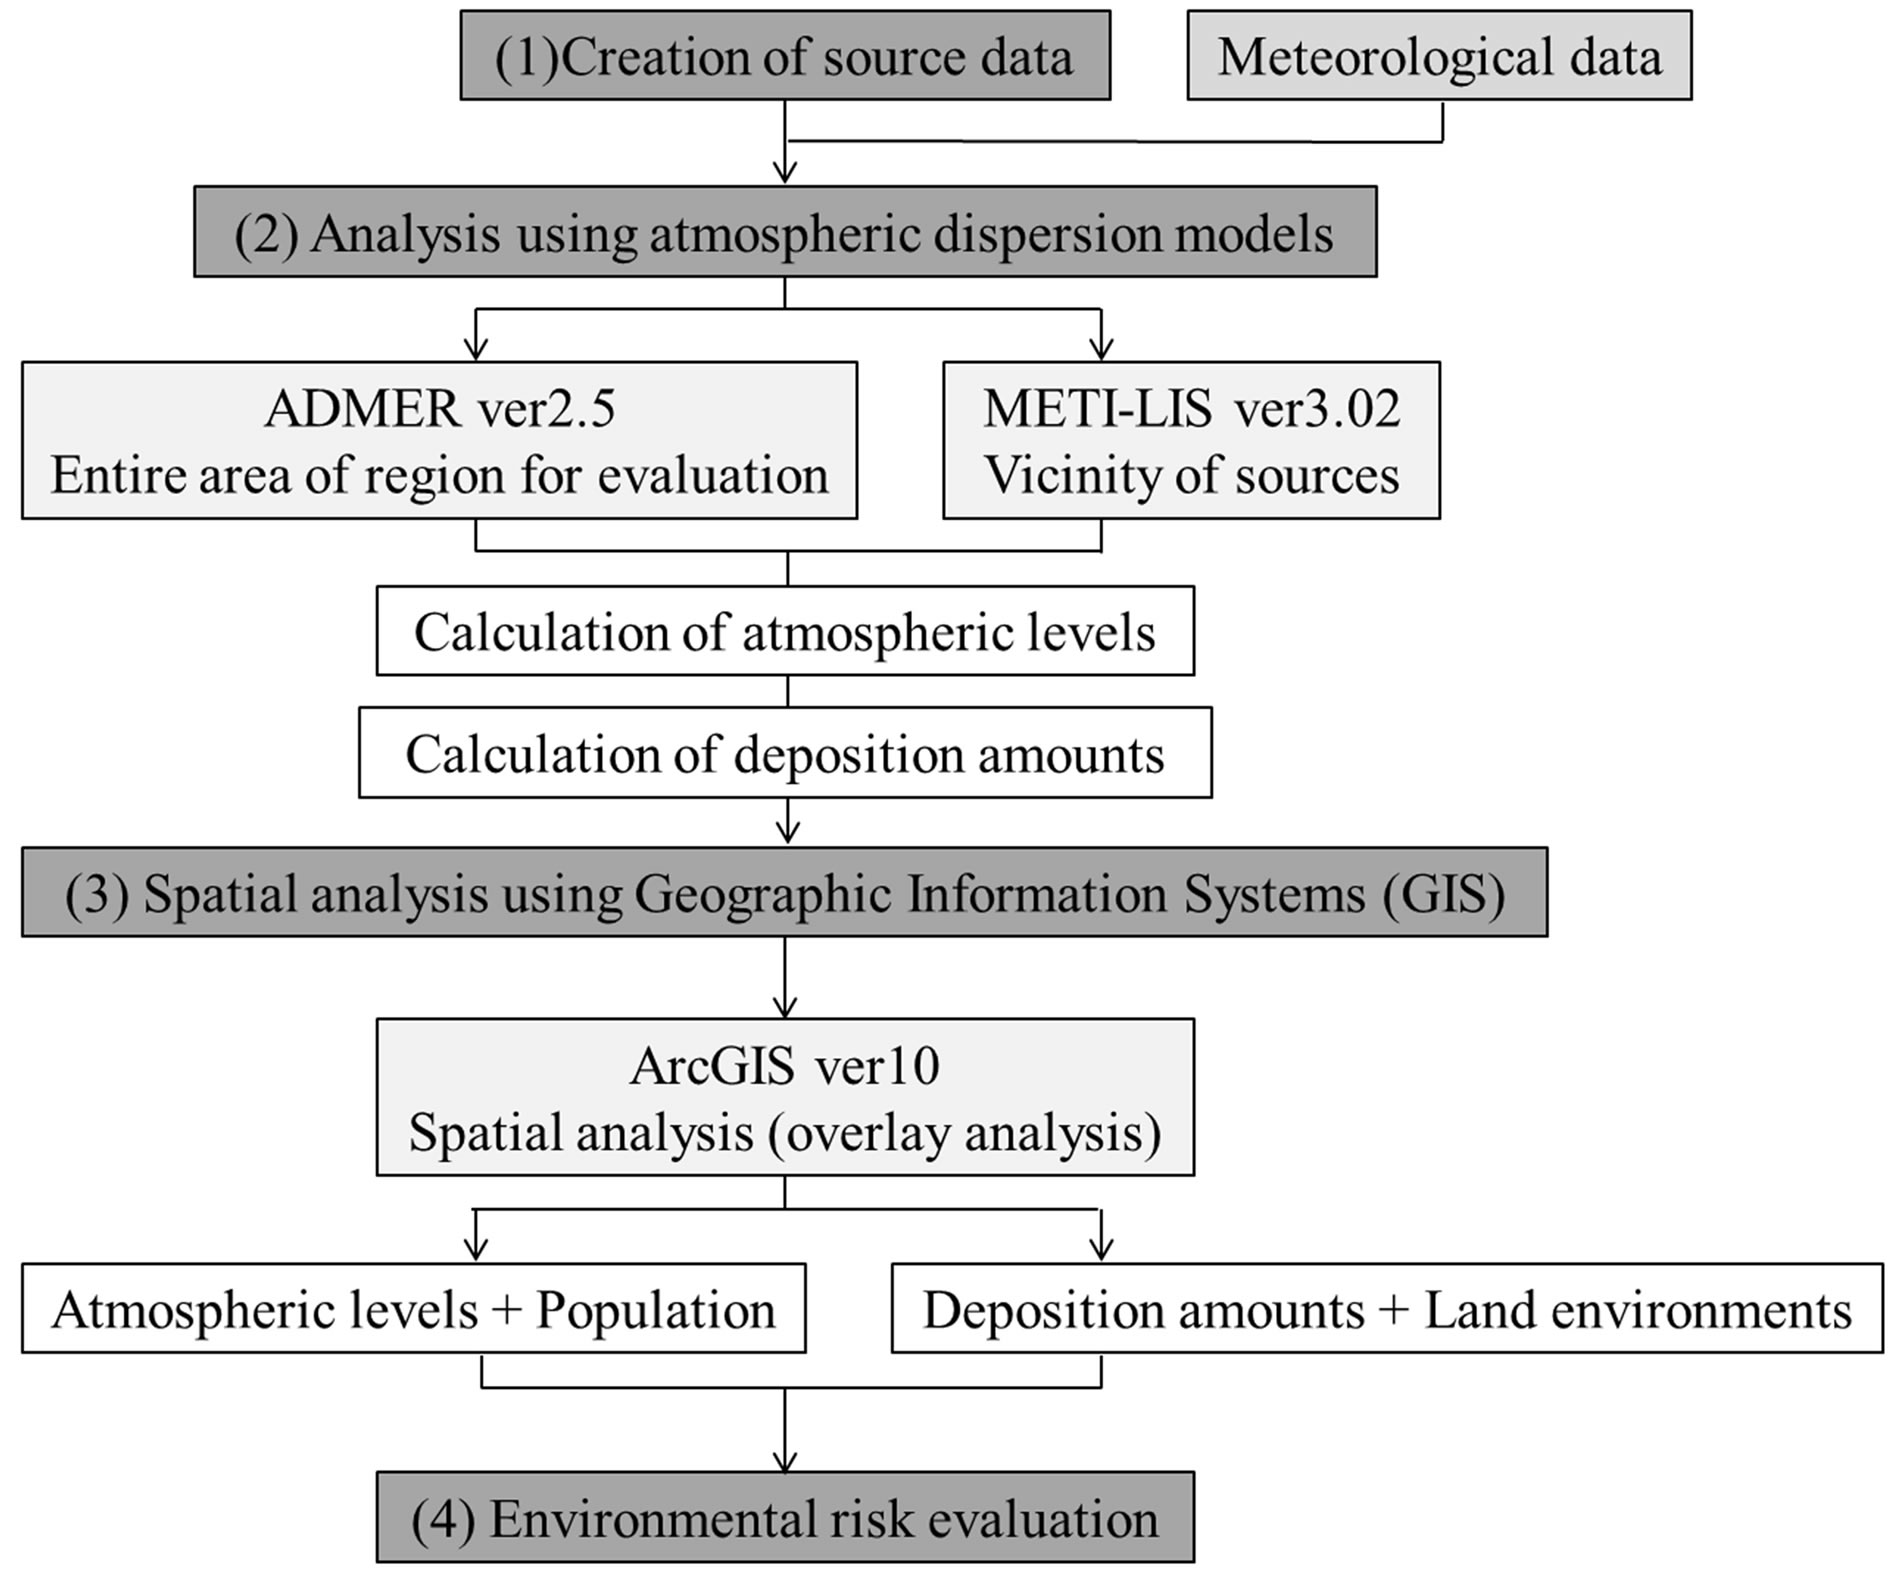
Figure 1. Evaluation method procedure.
tions of data of atmospheric levels and deposition amounts, estimated using the atmospheric dispersion models, and population and land use data were conducted. This enabled human dioxin exposure levels and land environment accumulated dioxin amounts to be estimated.
4) Based on the above-mentioned superimposed results, statistical processing was conducted, and the total population figure per unit of dioxin atmospheric level and the amount of dioxins accumulated in each land environment were aggregated. Comparing the atmospheric levels and the total population figures enabled the exposure level to humans from the atmospheric levels to be estimated and the total population in high dioxin level areas to be quantitatively calculated. Further, based on deposition amounts and land use, it was possible to calculate the amount of dioxins accumulated in each land environment, and to identify land environments with high levels of contamination. In addition, it was possible to fully understand whether contamination levels for rice fields, farming land, watercourses and the like, which are considered to be routes of ingestion to the human body, met environmental standards or not. Through conducting these steps, environmental risk was evaluated from the perspective of impact on people and the environment.
3.2. Outline of Atmospheric Dispersion Models and GIS
In this study, evaluation of the environmental risk was divided into two stages; therefore, two types of atmospheric dispersion model were used. In the first stage, which was a wide-area evaluation which targeted the entire area of the region for evaluation, the “National Institute of Advanced Industrial Science and Technology Atmospheric Dispersion Model for Exposure and Risk Assessment” [24-26] was used. This is an atmospheric dispersion model suited to estimating the atmospheric levels of a chemical substance based on the emissions of sources and meteorological conditions, and predicting long-term level distribution over a wide area. In the second stage, which was a detailed evaluation focusing on the vicinity of some sources, the “Ministry of Economy, Trade and Industry-Low rise Industrial Source Dispersion Model” [27-29] was used. This model predicts the level of chemical substances in the vicinity of sources, and can take into account the downwash which occurs when there is influence from turbulence of air current due to buildings in the vicinity of sources. That is, when this model is used, when data concerning the height of buildings in the area surrounding sources is input, the influence of buildings on dispersion can be taken into account, and detailed level distribution analysis can be performed for limited areas. Further, as the GIS, ESRI Inc.’s ArcGIS ver.10 was used. In assessing the environmental risk, ArcGIS ver.10 was used to conduct overlay analysis involving the analysis results obtained from the two types of atmospheric dispersion model, and the population and land use data, and to conduct statistical processing.
4. Data Collection and Processing
In this study, the data shown in Table 1 was used. Source data and meteorological data were used for the atmospheric dispersion models, and population data, digital
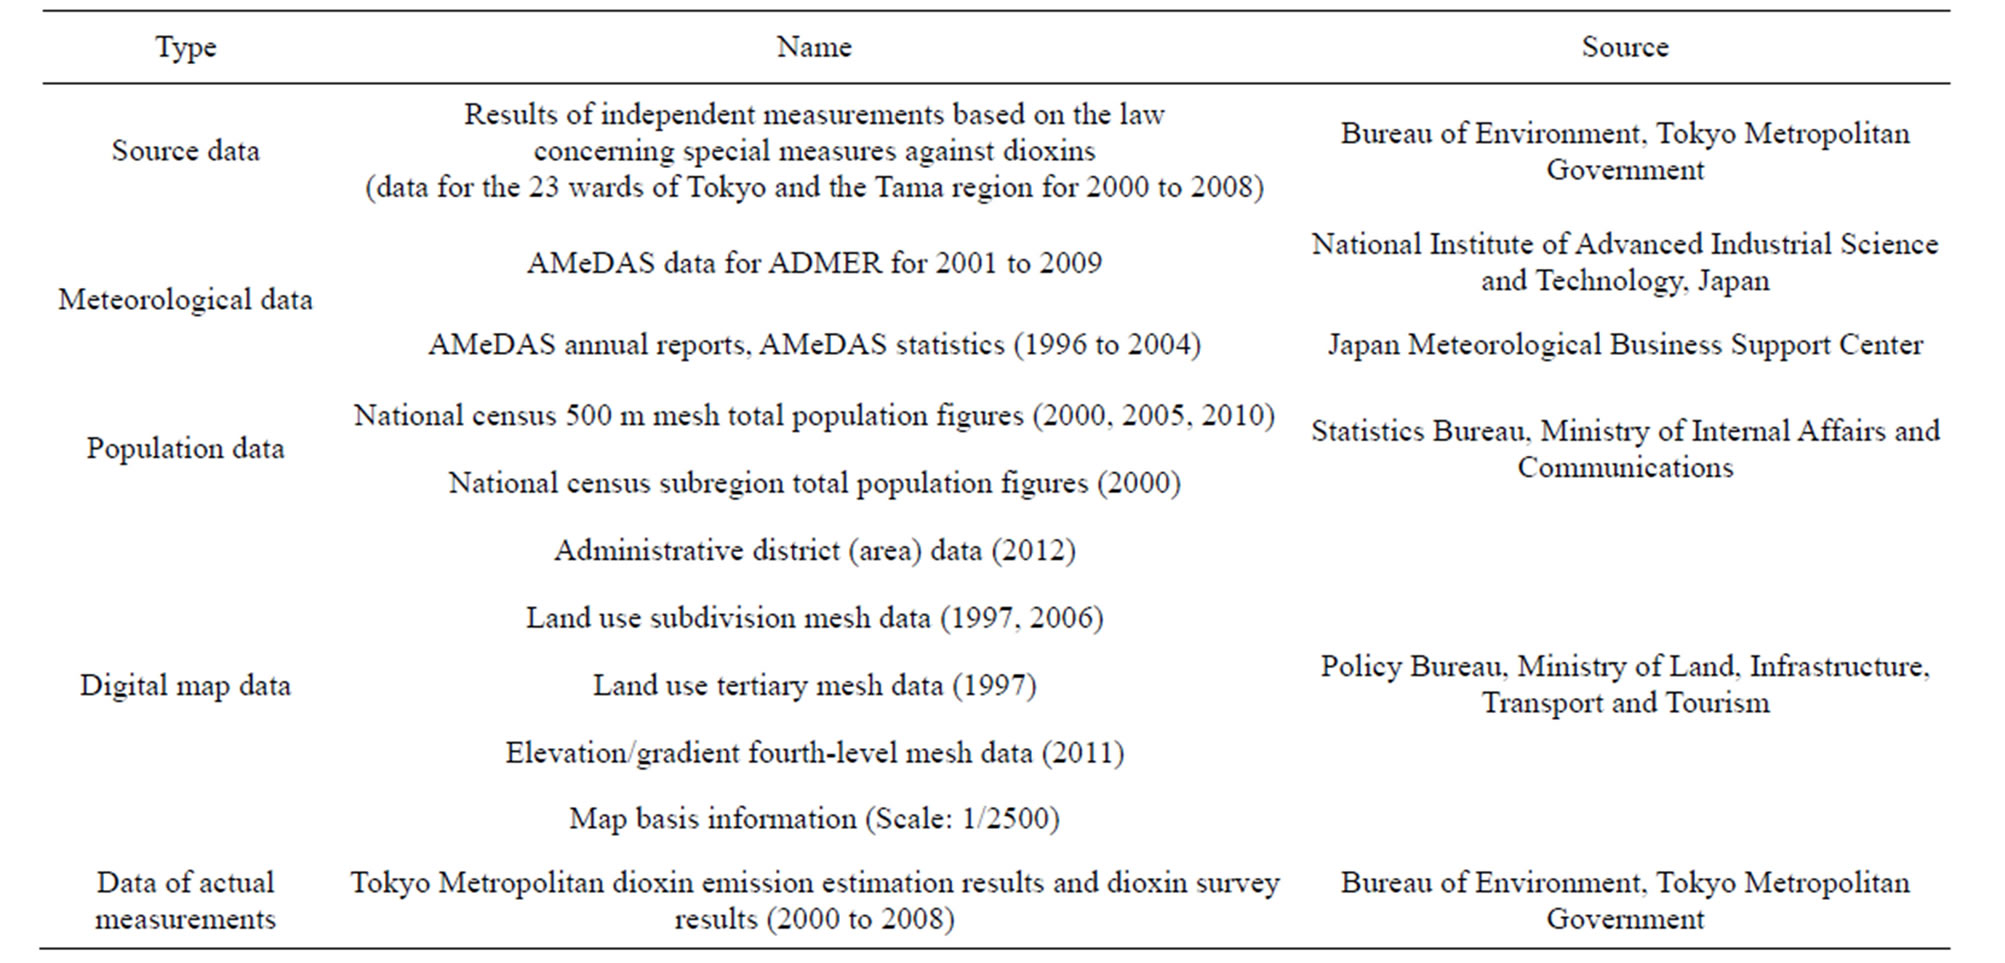
Table 1. Usage data.
map data and data of actual measurements were each processed into GIS data and used in the spatial analysis. Further, both the two types of atmospheric dispersion model used in this study require input of the amount of emissions per hour (mg/h); therefore, results of independent measurements in the Tokyo Metropolis based on the Law Concerning Special Measures against Dioxins were referred to, and a method of calculating the emissions from an incinerator based on the dioxins in gas emissions (ngTEQ/m3N) and incineration capacity (kg/h) is shown below. As the amount of gas emissions per unit of amount incinerated, which is the amount of gas emissions generated per ton of waste, 5000 (m3N/ton), set by the Committee to Investigate Measures for the Reduction of Dioxins Related to Waste Treatment (1997) [30] and the Ministry of the Environment (2001) [31], was used.
Level in gas emissions CD
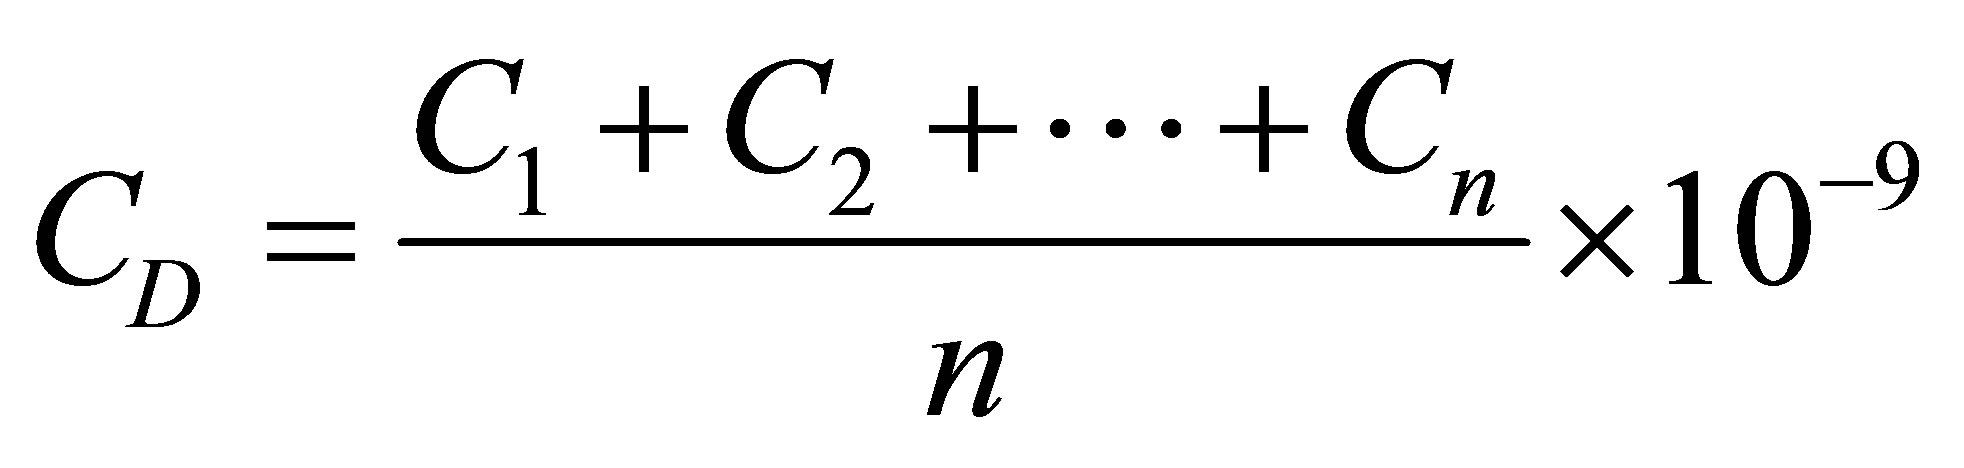 (1)
(1)
Amount incinerated Ia
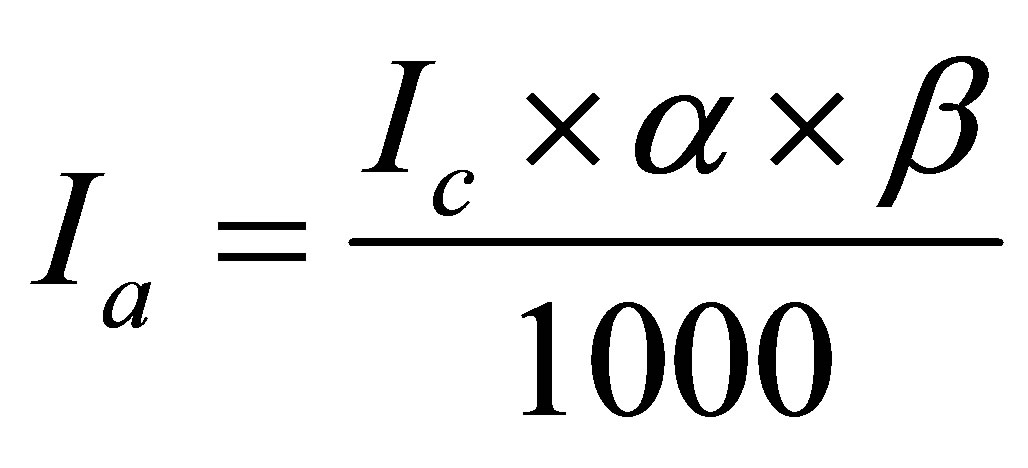 (2)
(2)
Amount emitted Ei
 (3)
(3)
CD: Level in gas emissions (gTEQ/m3N)
N: Number of times measured Cn: Level in gas emissions the nth time (ngTEQ/m3N)
Ia: Amount incinerated (g/year)
Ic: Incineration capacity per hour (kg/h)
α: Hours operated per day (hours/day)
β: Days operated per year (days/year)
Ei: Amount emitted (gTEQ/year)
Eg: Amount of gas emissions per unit of amount incinerated (m3N/ton)
Among the incinerators which were evaluated, many report dioxin levels as being unmeasured. General waste incinerators which were evaluated by ADMER are largescale incinerators managed by local governments; therefore, none of these were among those that had not carried out measurements. However, all the incinerators required by the Law Concerning Special Measures against Dioxins to carry out independent measurements of dioxins once a year or more were evaluation targets of METILIS; therefore, besides general waste incinerators, medium-sized and small incinerators were also evaluation targets of METI-LIS. In particular, many small incinerators do not carry out measurements of dioxins, so it was necessary to estimate the emissions from these incinerators. Accordingly, incinerators which measure dioxins each year were classified in detail according to incineration capacity (the scale of the facilities of the incinerator), and as shown in Table 2, the average annual amount of emissions was estimated for each one. Then, after taking into consideration the number of days of operation per year and the number of hours of operation per day, based on Table 2, the amount of emissions per hour for incinerators that had not measured dioxins was calculated.
5. Evaluation of Entire Area of Region for Evaluation
5.1. Evaluation Targets
The evaluation targets in this section were all 41 largescale general waste incinerators which were total-continuous-type incinerators and were set up by local governments. The first reason for evaluating general waste incinerators was that they are large-scale incinerators which continue operating 24 hours a day throughout the year, and they have a long burning time and a high incineration capacity; therefore there is a high probability that they will have a large impact on the environment. The second reason was the height of their stacks. ADMER is basically suited to analyzing level distribution over a wide area. In wide-area level distribution analysis, sources for which there is a possibility that chemical substances will be dispersed further by the behavior of the atmosphere must be selected; therefore, incinerators with high stacks were focused on. Small incinerators with low stacks are influenced by high buildings in their surroundings, and disturbance of the dispersion of dioxins in the atmosphere occurs. However, the stacks of general waste incinerators are 40 m high or more; therefore, it is not necessary to take into account the influence of disturbances of the air stream which occur due to the surrounding buildings. For the evaluation target range, GIS was used, and a range of calculation of 90 km east-west and 50 km north-south was set, such that the entire area of the Tokyo Metropolis except for the islands was included, and level distribution was output using 500 m mesh units. As the period evaluated, the nine years from 2000 to 2008, for which source data was available, was selected.

Table 2. Average annual emissions of incinerators, classified by scale of facilities (gTEQ/year).
5.2. Calculation Conditions
1) Source data and chemical substance parameters For ADMER, necessary source data is source location (longitude and latitude), annual emissions and emissions elevation; necessary chemical substance parameters are decomposition coefficient, washout ratio, background levels and dry deposition velocity. Annual emissions were calculated using the calculation method in the previous section. In the ADMER analysis, only incinerators which operated continuously throughout the year were evaluated for each year. Incinerators whose operation was suspended, incinerators which were under construction or newly built, and incinerators which ceased operation during a year were excluded from that year’s analysis. Further, the value of the background level, which was necessary as a chemical substance parameter, was set as zero. Usually, concerning the background level, the atmospheric level of a region which is considered to receive hardly any impact from emission sources is used. However, in this study, the environmental risk from dioxins emitted from incinerators was evaluated; therefore, this was done to exclude the influence of sources other than incinerators, such as car exhaust gas and crematoriums.
2) Details of source data In order to fully understand the dioxin emissions from each incinerator during the evaluation period, annual emissions for each year were aggregated. These results are shown in Figure 2. As Figure 2 shows, incinerators whose total dioxin emissions for the nine year period were considerably higher than those of other incinerators were Setagaya Waste Incineration Plant, at 7.31 gTEQ/ year; Hino City Clean Center, at 6.96 gTEQ/year; Ota Waste Incineration Plant, at 5.82 gTEQ/year; and Shinagawa Waste Incineration Plant (formerly Oi Waste Incineration Plant), at 3.93 gTEQ/year.
5.3. Results and Consideration
1) Results of analysis by the atmospheric dispersion model (ADMER) and consideration
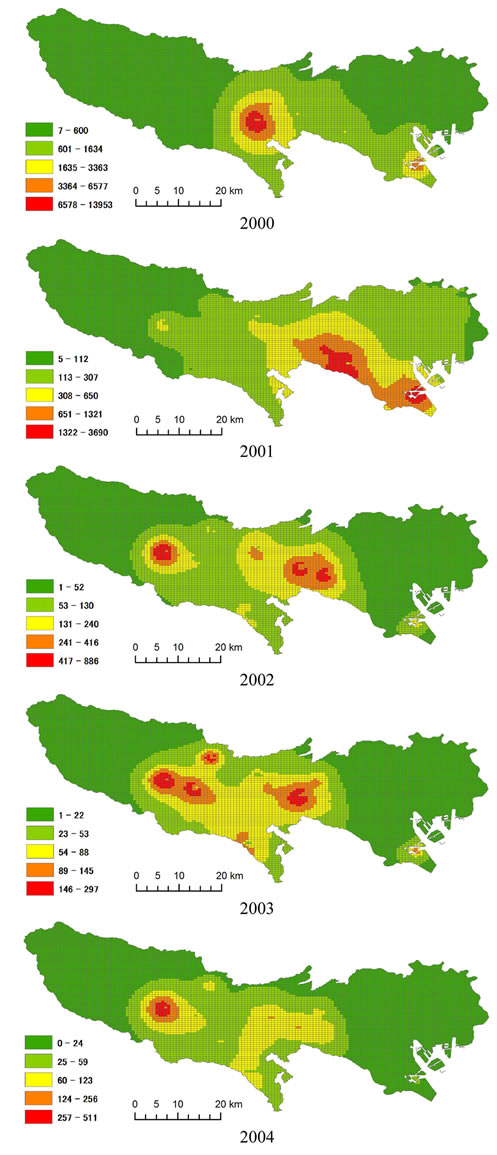
Figure 3 shows the results of analysis of atmospheric levels and deposition amounts during the evaluation period that were calculated using ADMER. It can be seen that atmospheric levels and deposition amounts were high particularly in the years 2000 and 2001, and decreased greatly from the year 2002 onwards. It can also be seen that different regions had high atmospheric levels and deposition amounts each year. It is necessary to understand the contamination levels in more detail in Hino City, Ota Ward and Setagaya Ward, which were highlevel regions in 2000 and 2001; however, the city and the wards were not identified as high-level regions in the year 2002 and beyond; therefore, it can be said that the amount of dioxin emissions from their general waste incinerators has been reduced. Meanwhile, from the year 2002 and onwards, Akiruno City is identified as a highlevel region more frequently than other regions, and there is variation in the dioxin emissions from its general waste incinerators each year; therefore, it can be said that compared to general waste incinerators in other regions, the emission levels of those in Akiruno City have not been improved. Comparing the 23 wards (the eastern part) with the Tama region (the western part) in the Tokyo Metropolis, from the year 2002 onwards, high-level regions were not identified in the wards of Tokyo; therefore, it can be said that the beneficial effects of the measures against dioxins implemented by the Clean Association of TOKYO23 were demonstrated.
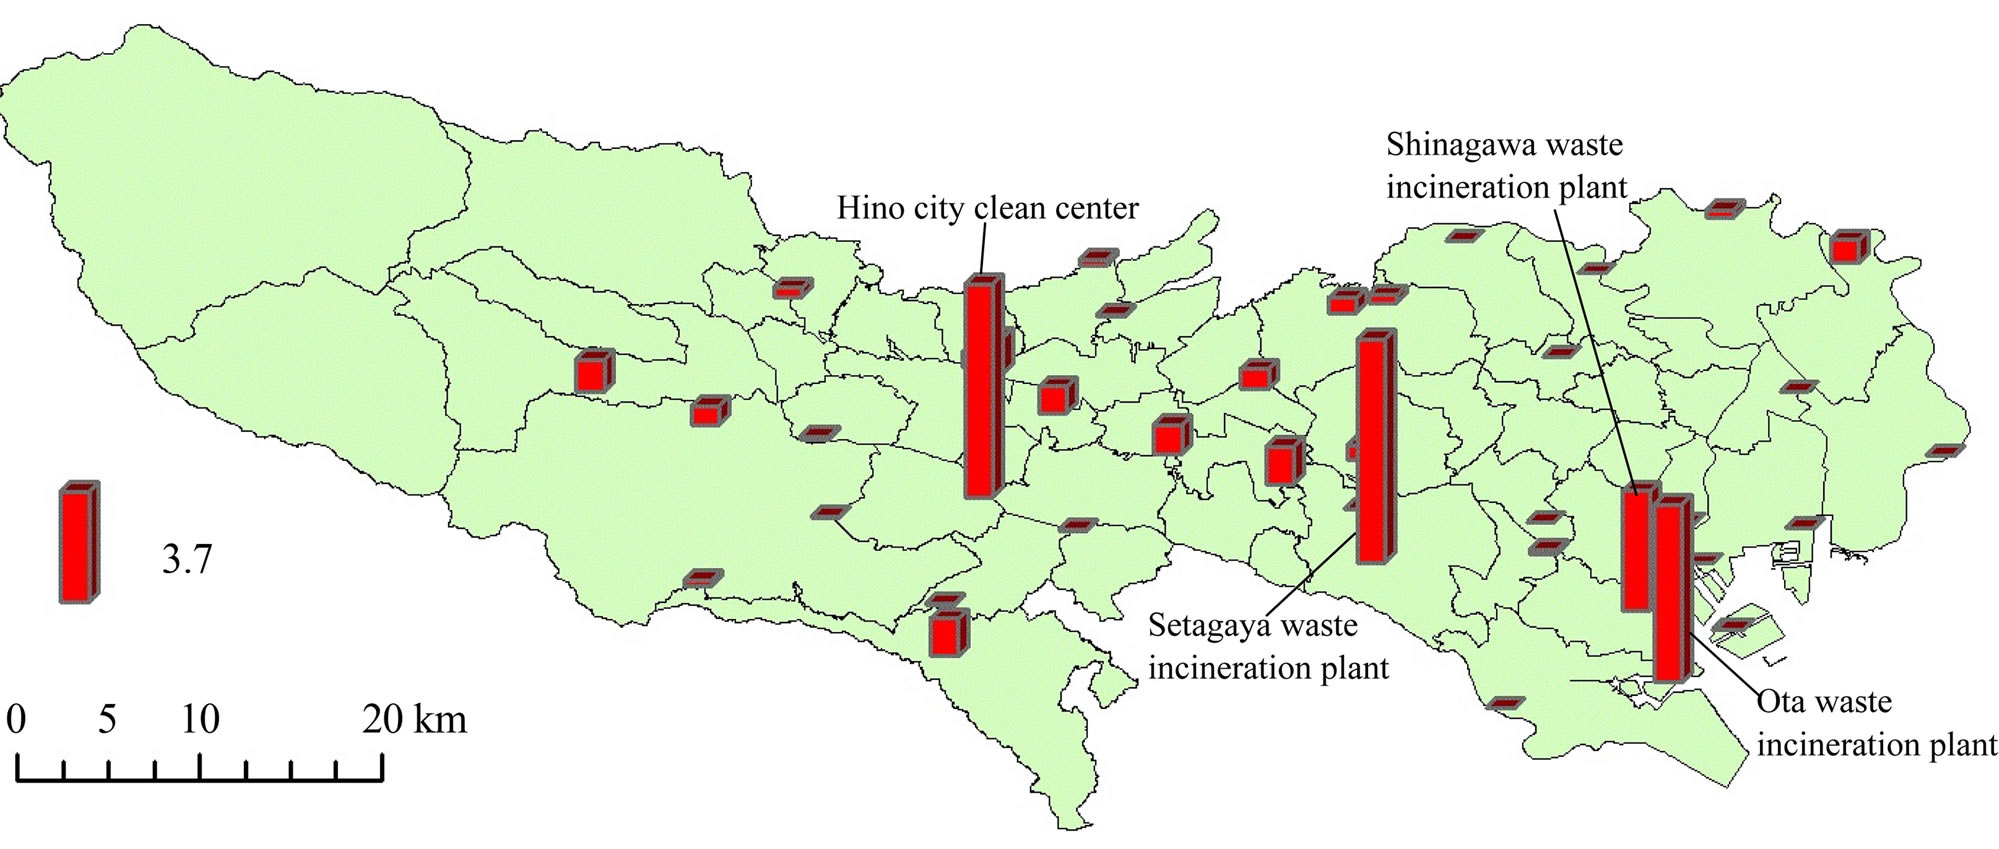
Figure 2. Total dioxin emissions from general waste incinerators for the period 2000 to 2008.
2) Environmental risk evaluation results and consideration a) The risk to humans The atmospheric levels estimated using ADMER and the population data were superimposed using the GIS, and thereby, levels of exposure to dioxins were graspedand the risk to humans was evaluated. In Japan, national censuses are carried out every five years, and data was available for the years 2000, 2005 and 2010. Therefore, for each year in the period evaluated, population data of the census year closest to that year was used. It was possible to confirm that from the year 2003 onwards, in the
 (a)
(a)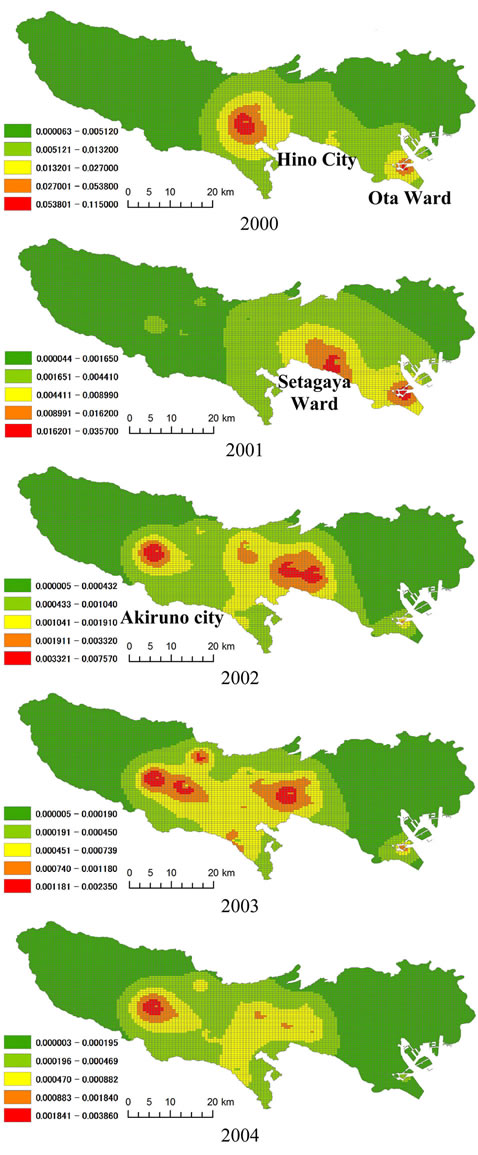 (b)
(b)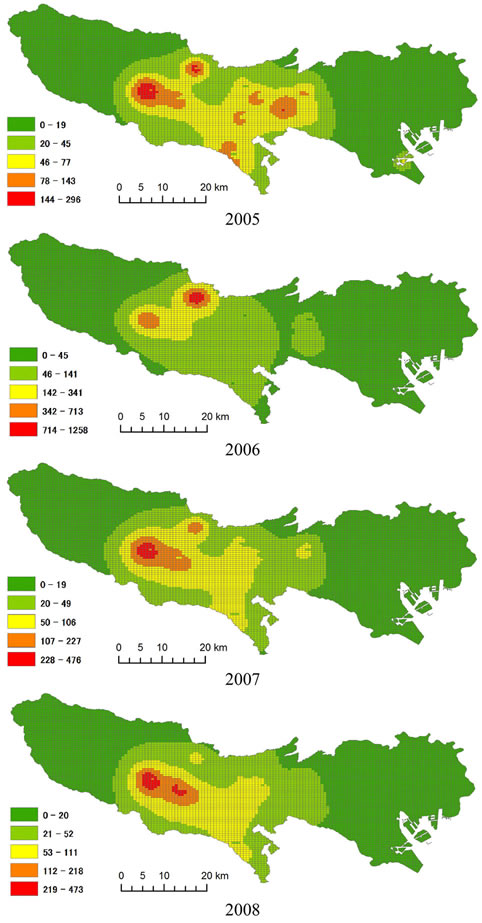 (c)
(c)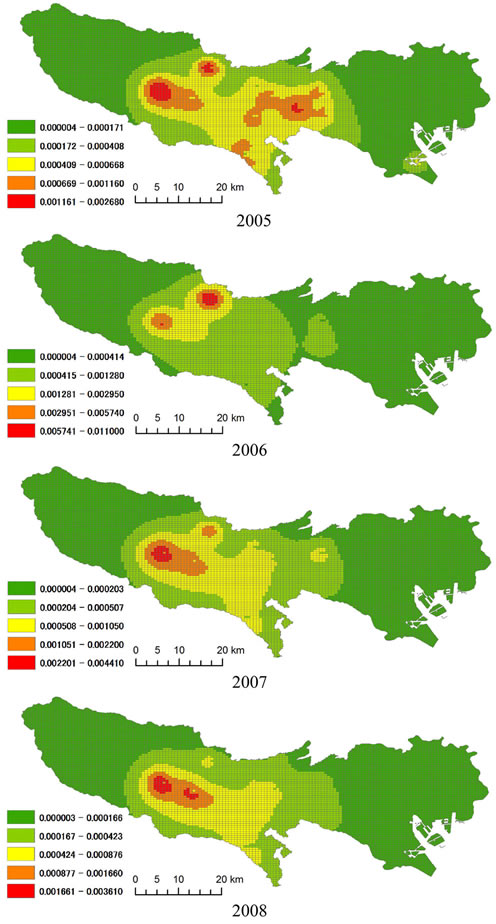 (d)
(d)
Figure 3. Dioxin atmospheric level distribution (pgTEQ/m3, left) and deposition amount distribution (pgTEQ/m2, right) for the period 2000 to 2008.
entire Tokyo Metropolis, a tendency continued for population to be concentrated in places with levels in the range of 0.001 pg TEQ/m3 or less. Therefore, Figure 4 shows total population figures aggregated for each atmospheric level for the period 2000 to 2002. Further, looking at Figure 4, it can be seen that the population was concentrated in places with levels in the range of 0.05 pgTEQ/m3 or less in the year 2000, 0.025 pg TEQ/m3 or less in the year 2001, and 0.005 pgTEQ/m3 or less in the year 2002. Therefore, because the atmospheric levels of dioxins in the entire Tokyo Metropolis during the nine year period were much less than the Japanese environmental standard of 0.6 pgTEQ/m3 (Central Environment Council, 1999) [32], it can be determined that risk to humans from the amount of exposure to dioxins released from general waste incinerators is not an issue. However, these evaluation results are based on analysis performed using a 500 m mesh unit spatial scale and on estimations of atmospheric diffusion of dioxins released from general waste incinerators only.
b) Risk to the environment The deposition amounts estimated using ADMER and the land-use data were superimposed using the GIS, and thereby, accumulation levels in each land environment were grasped, and the risk to the environment was evaluated. The deposition amounts used in the superimpose-
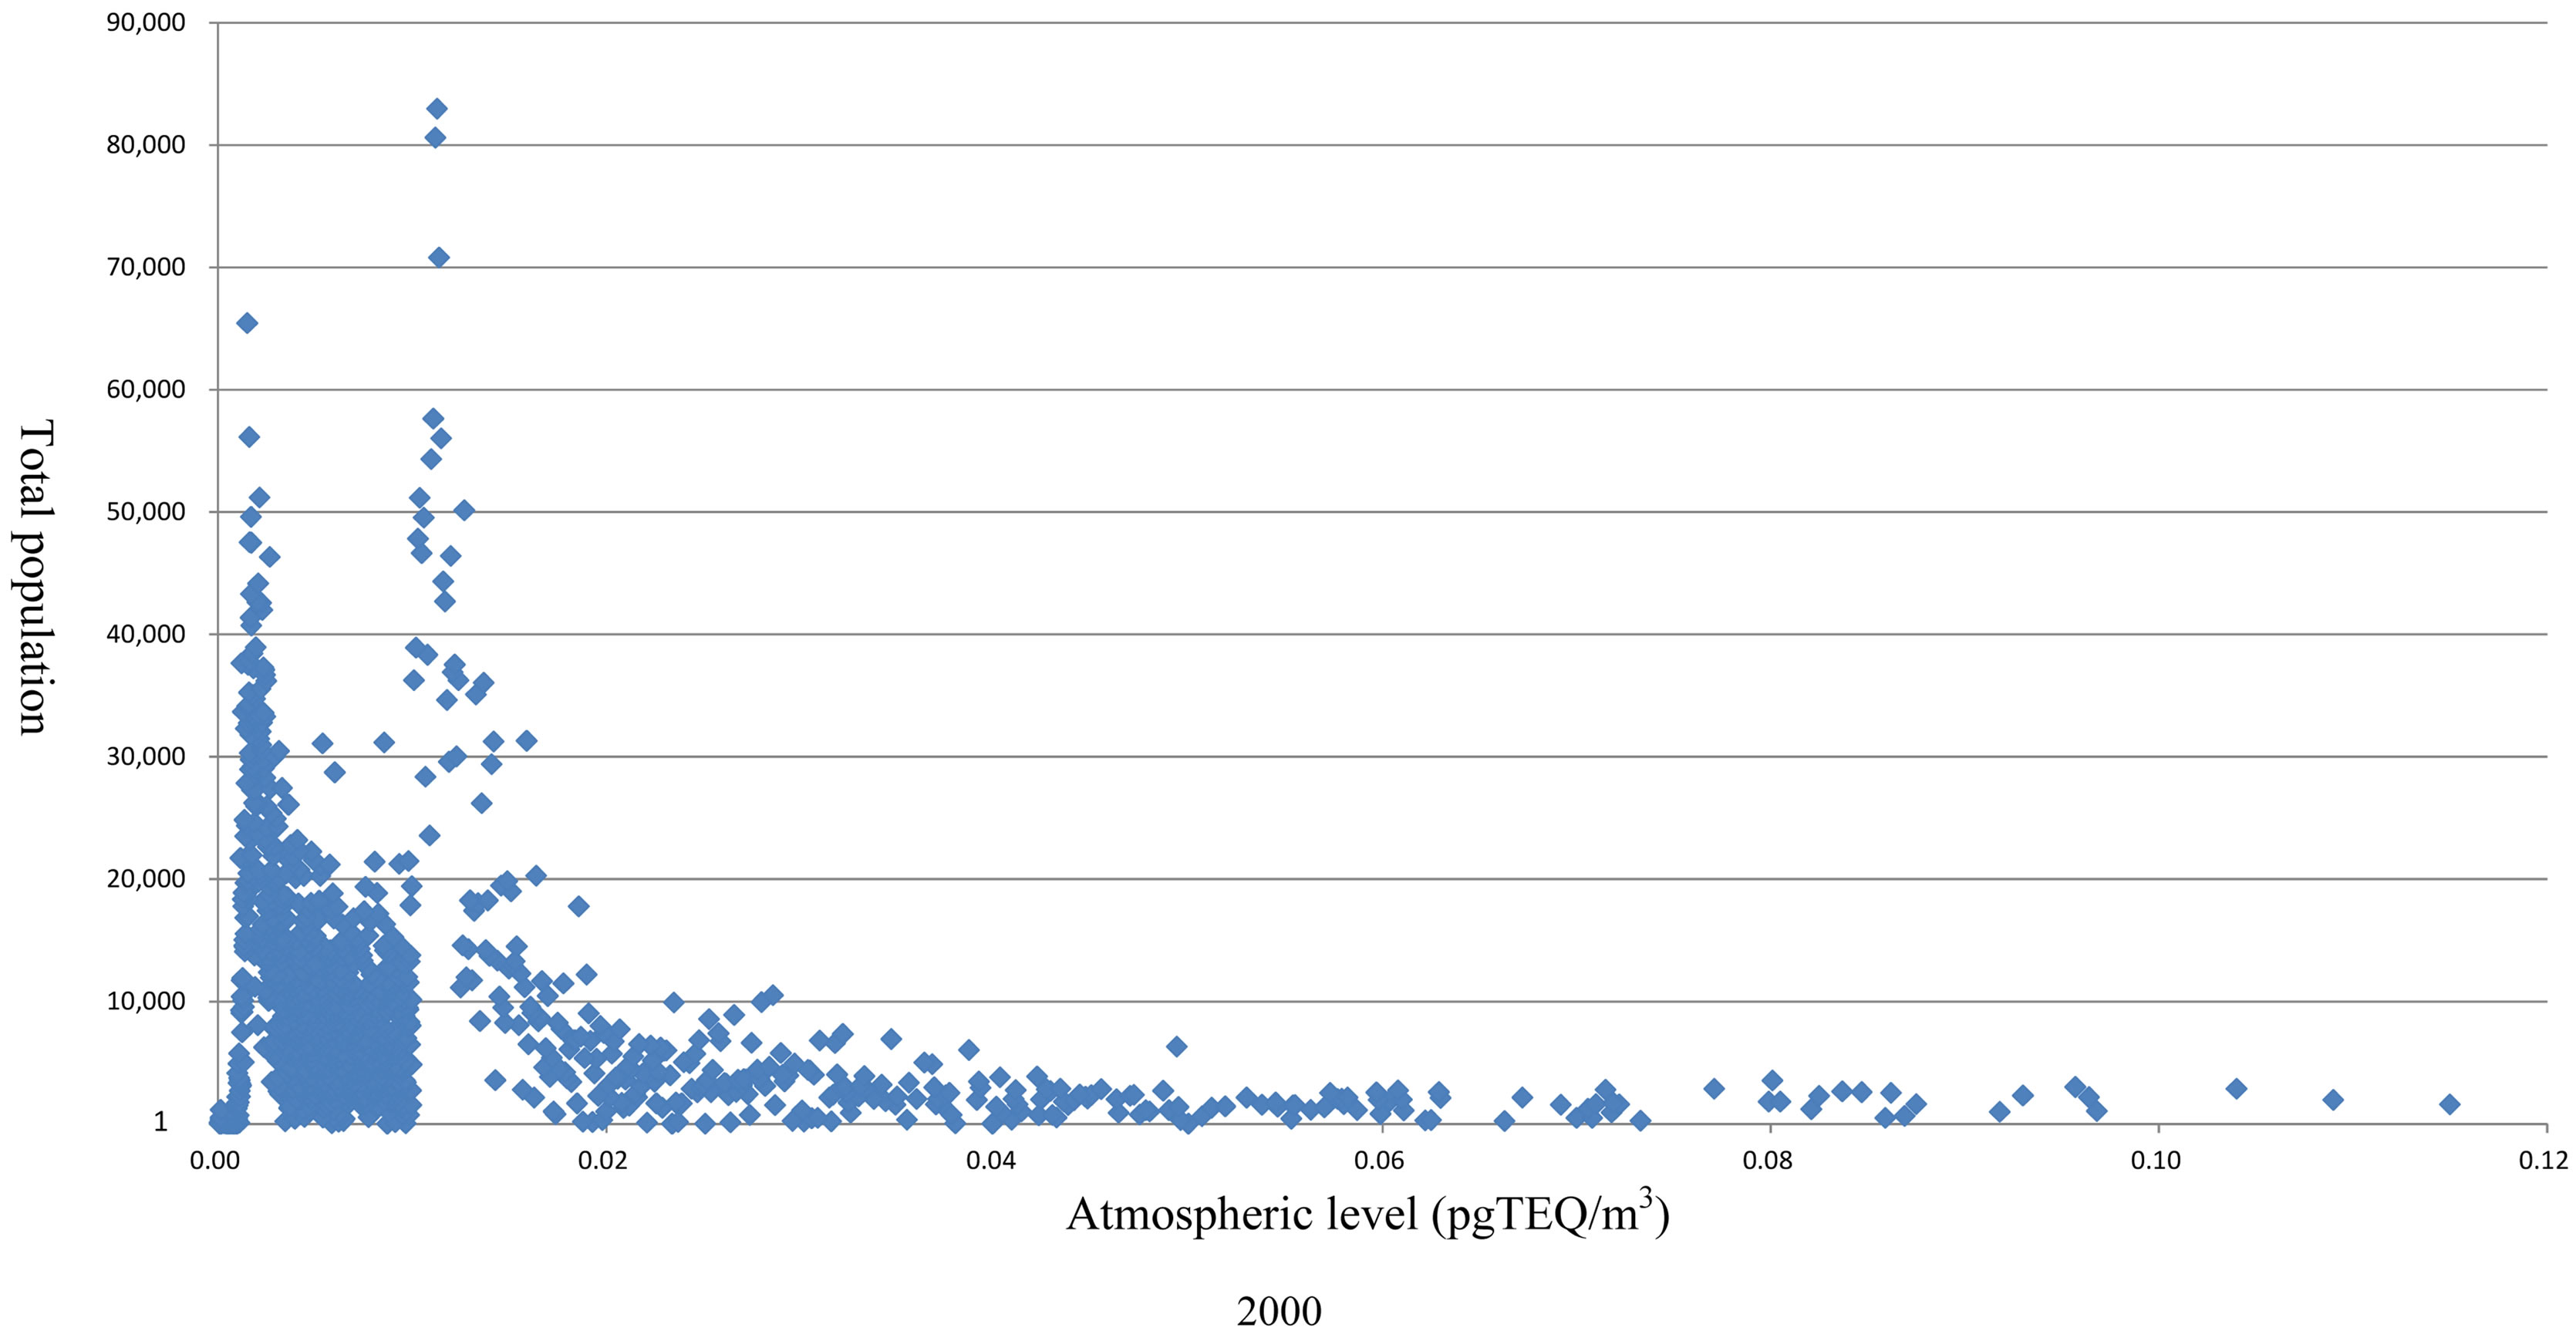
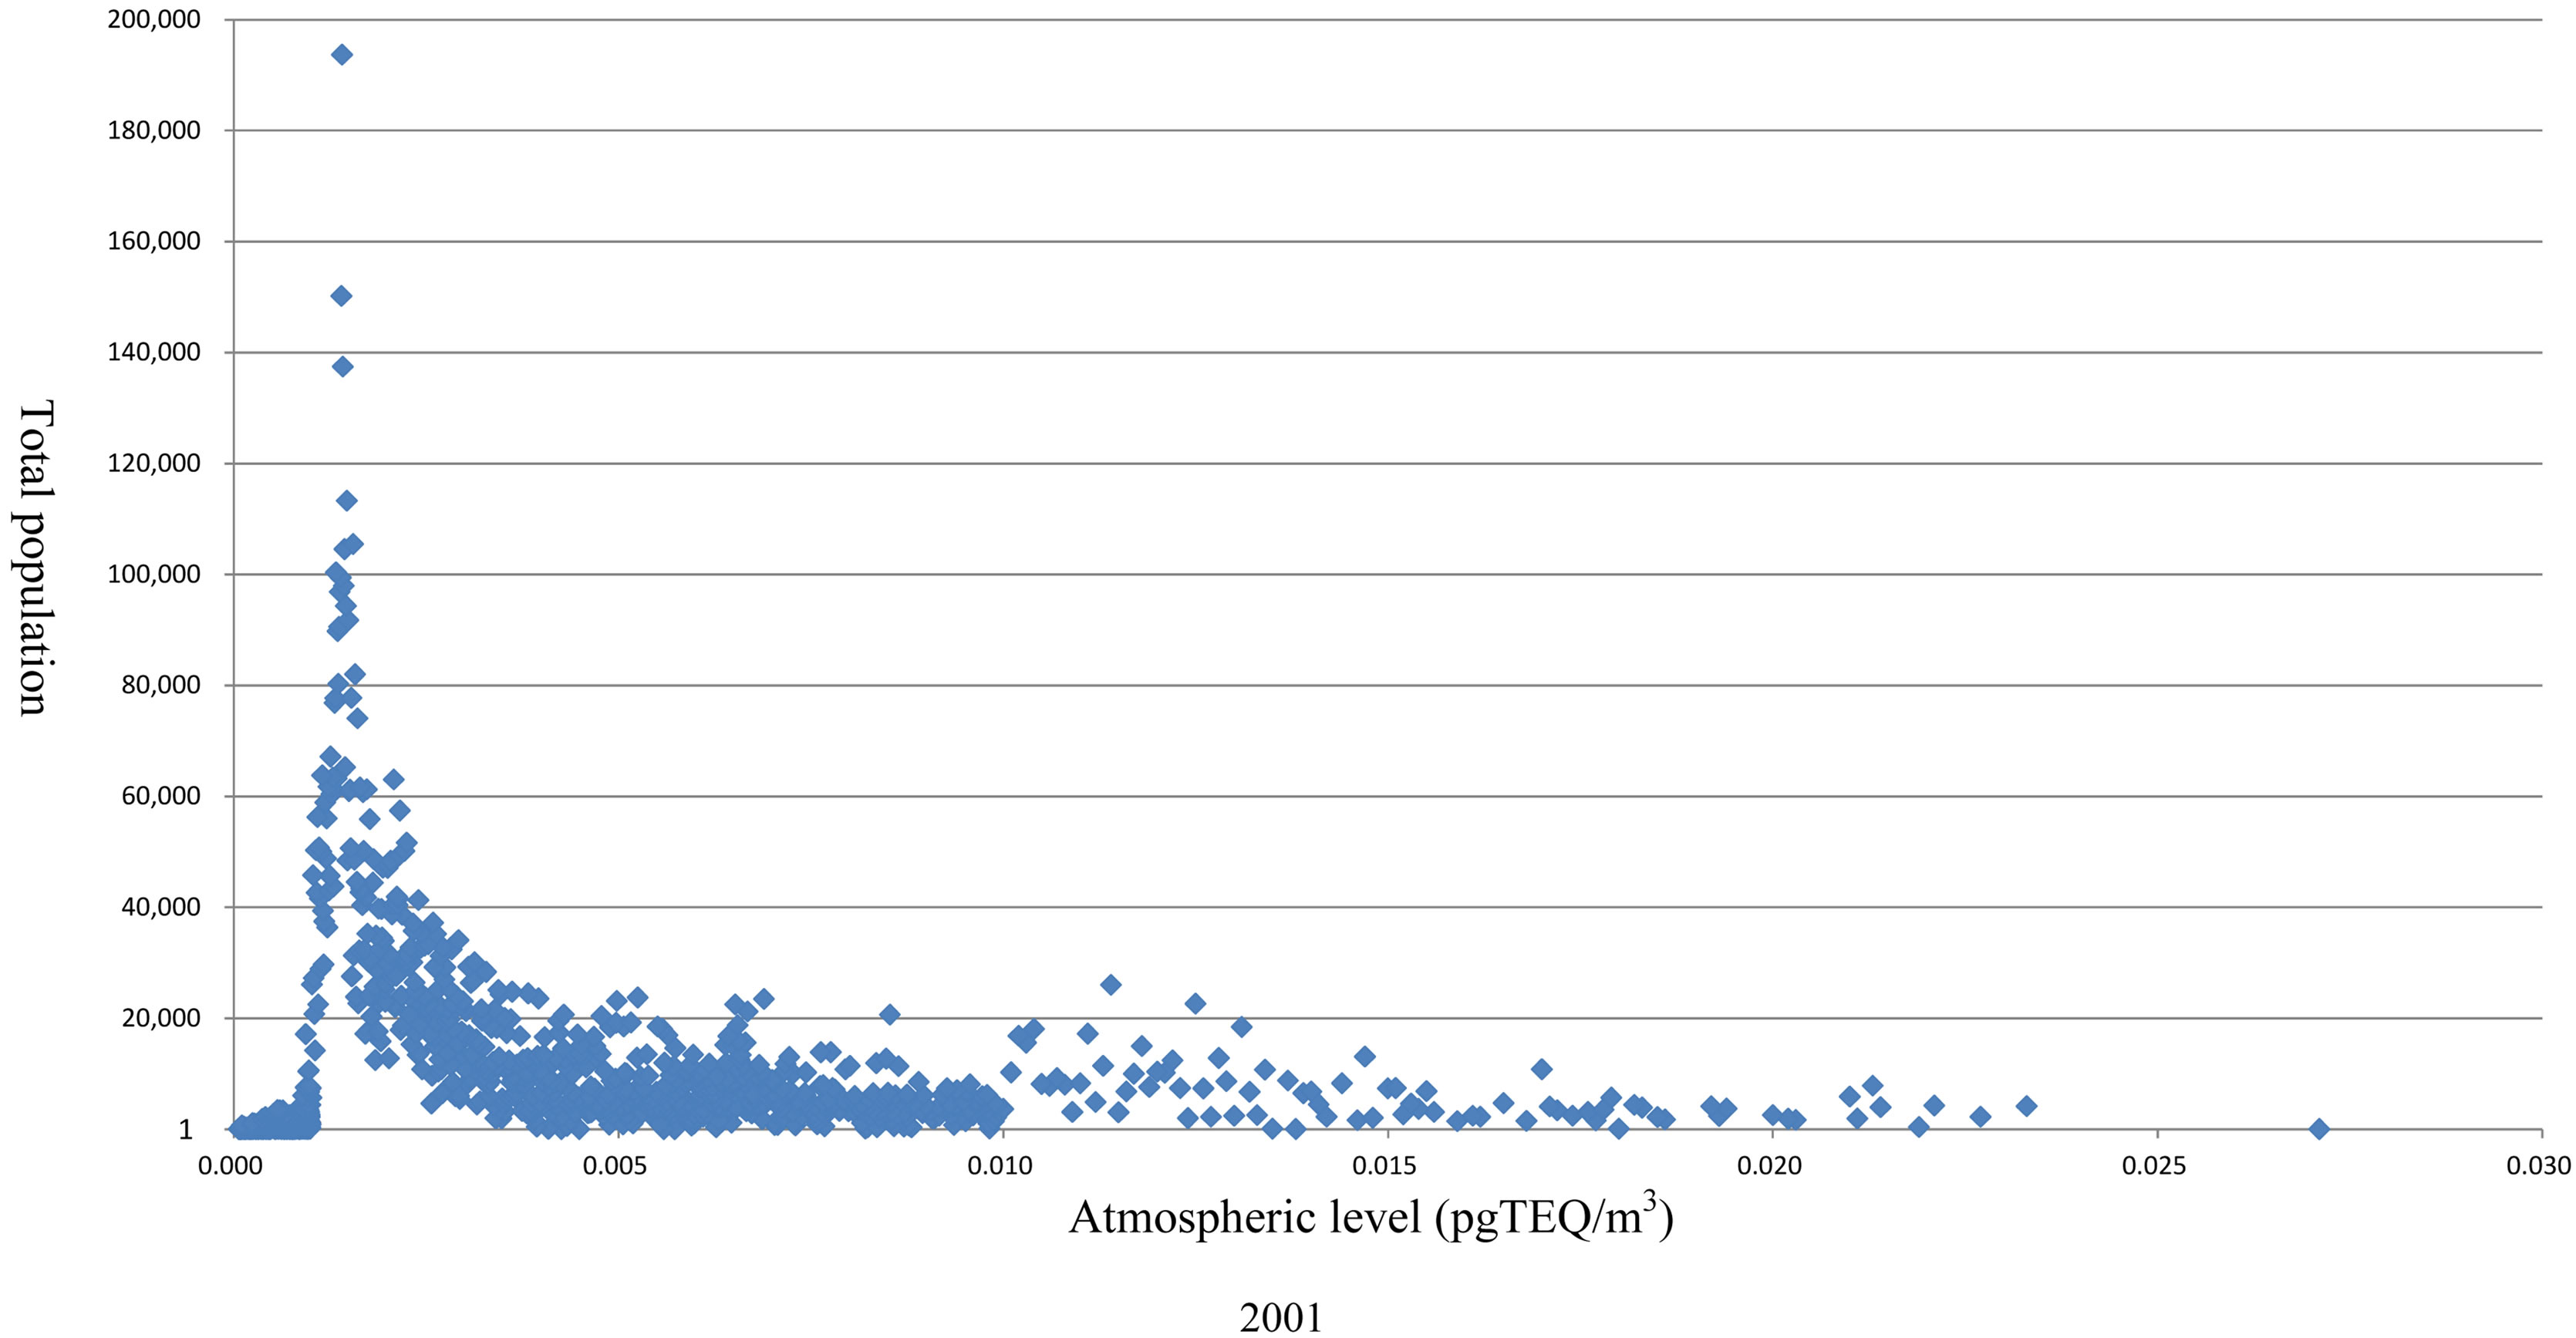
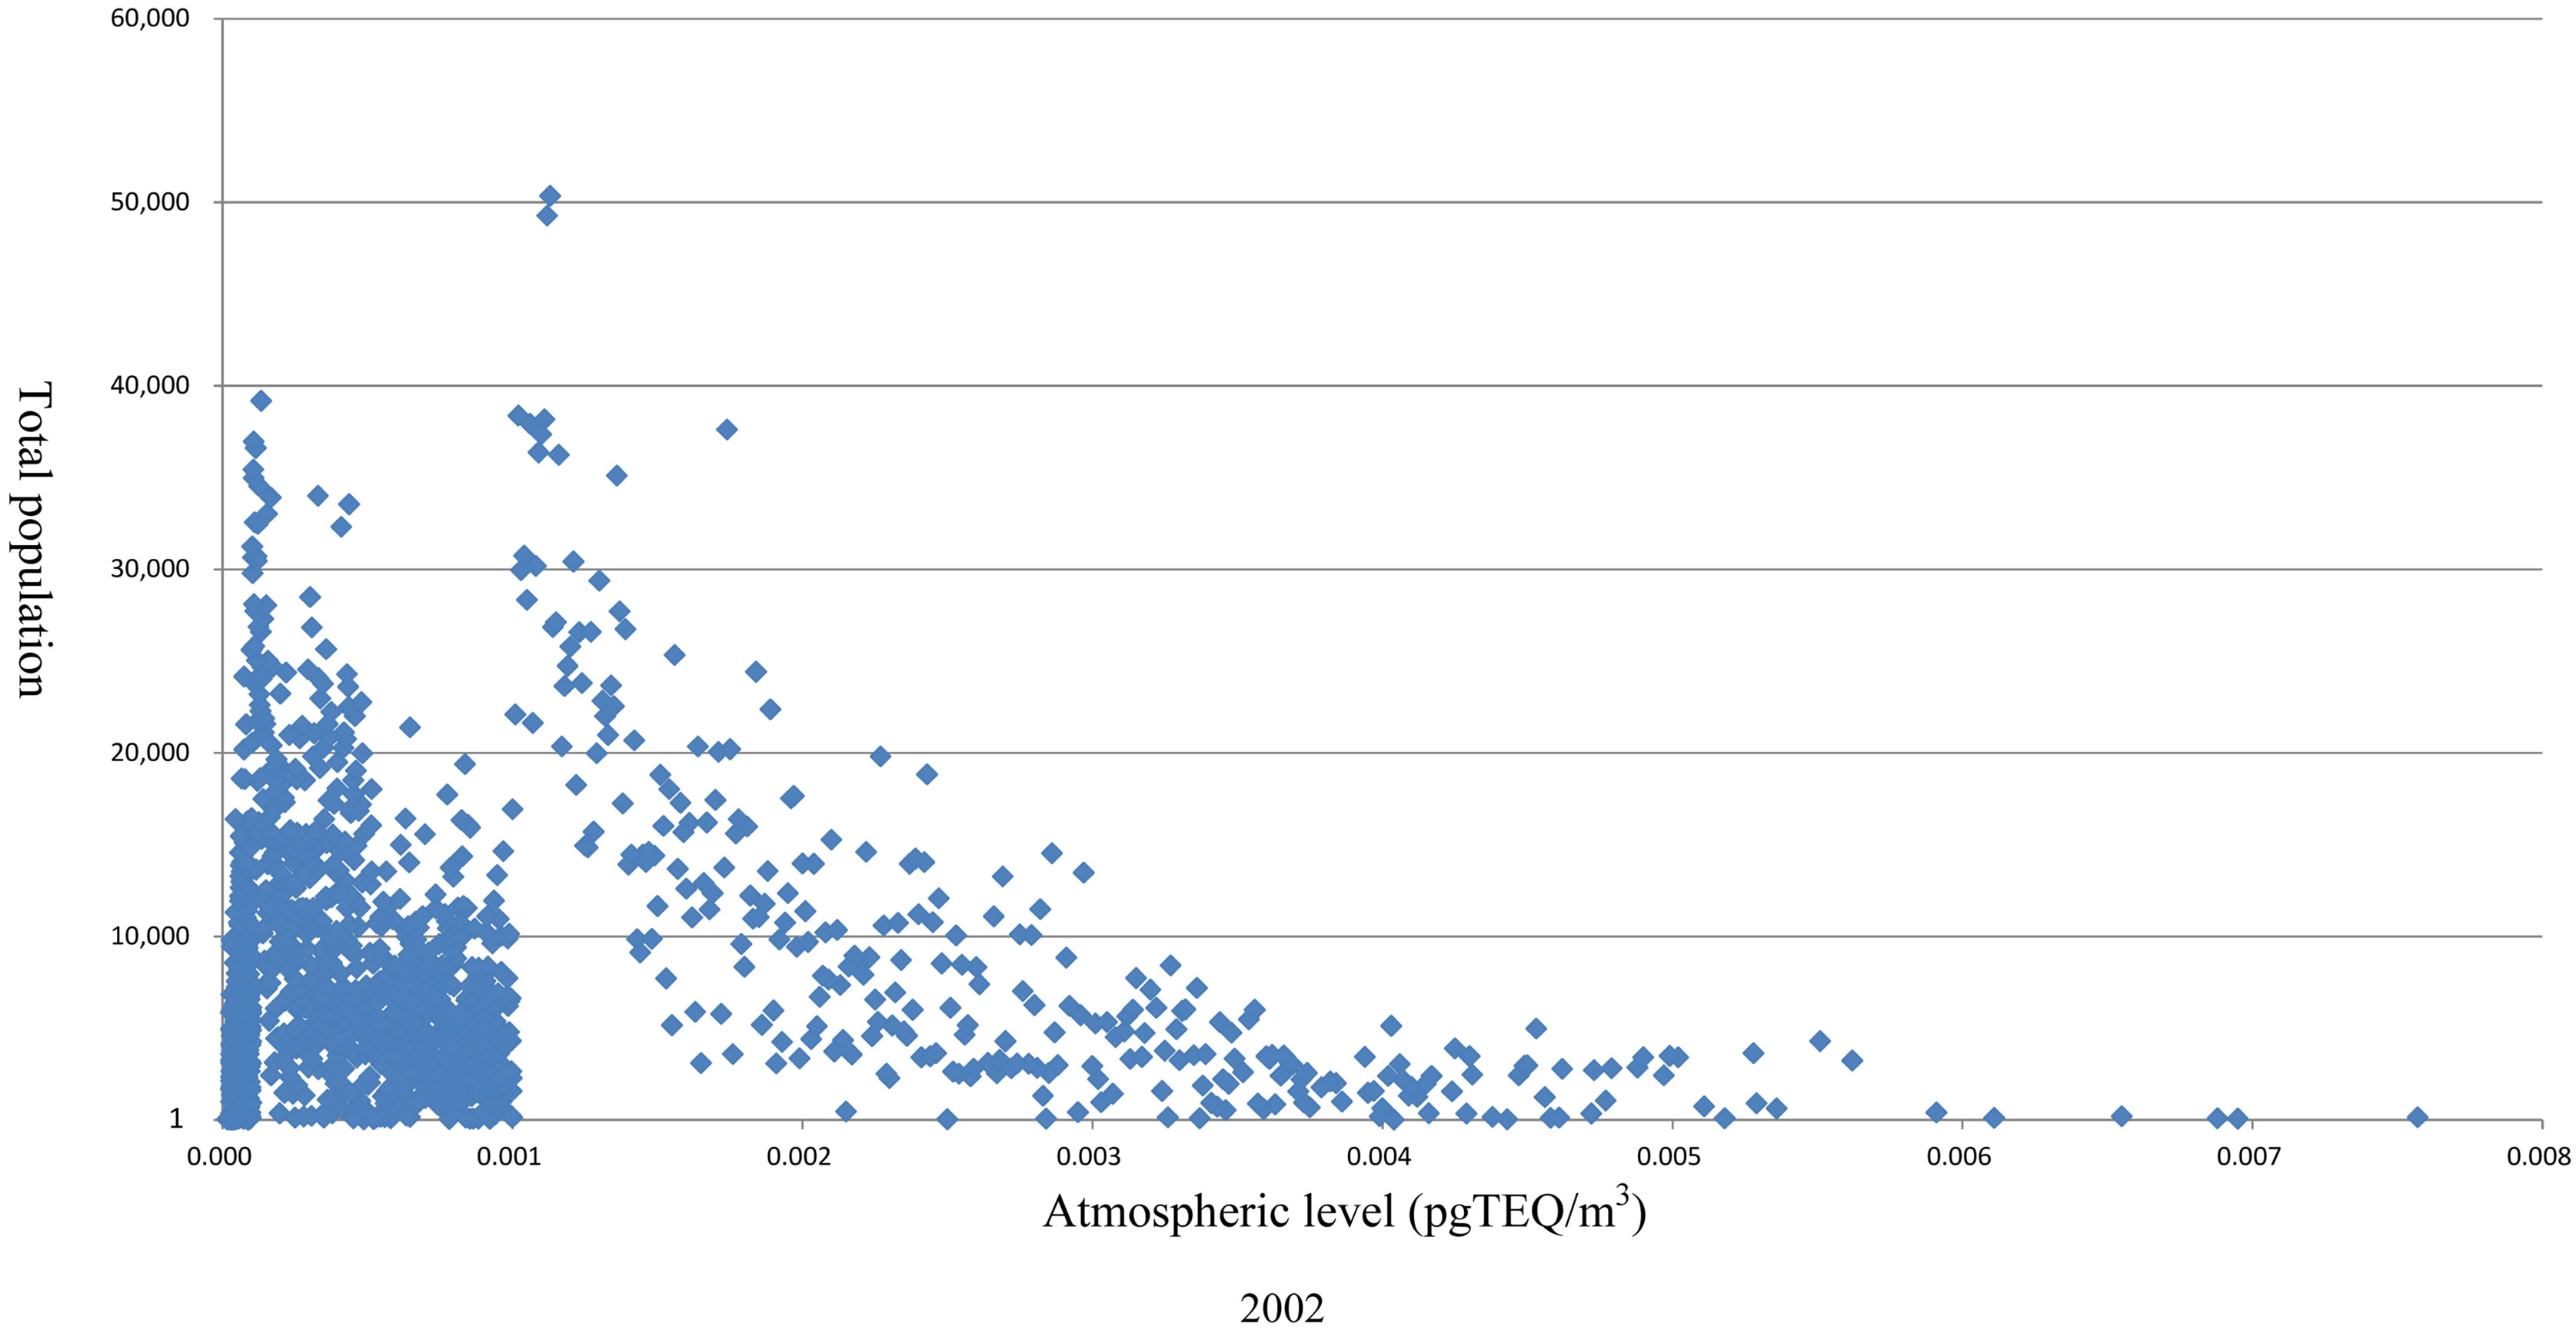
Figure 4. Total population figures per atmospheric level for the period 2000 to 2002.
tion were the aggregate amounts for the deposition amounts which accumulated during the nine-year evaluation period. Here, because dioxins have a long half-life in the environment, the fact that once a dioxin has deposited, it exists in the environment for a long time was taken into consideration, and rather than performing superimposition of deposition amounts for each year, superimposition was performed with the aggregate amounts which accumulated over the nine years. Concerning land use subdivision mesh data, land-use environment data from 2006, the year closest to the evaluation period, was used.
Table 3 shows the accumulated amounts of dioxins in each land environment. Using the GIS, deposition amounts (pgTEQ/m2) in 100m mesh units and area (m2) were calculated; these were multiplied to find the accumulated amounts (gTEQ), and accumulated amounts of dioxins were aggregated according to land use. As shown in Table 3, no land environment had an accumulated amount of dioxins equal to or greater than the Japanese environmental standard for dioxins in soil, which is 0.51 gTEQ per hectare [33]; therefore it can be determined that risk to the environment is not a problem. However, it was found that the land environment with the highest accumulation of dioxins in the entire Tokyo Metropolis was land for buildings. This is because the Tokyo Metropolis is a region containing a large-scale urban area, so land for buildings occupies about half of its area. Concerning forest and land for other uses (sports grounds, parks, airports, racecourses and so on), between which there is a fourfold difference in total area, a similar amount of accumulated dioxins was found. These results show that in the Tokyo Metropolis there is a tendency for dioxins to accumulate more easily in land environments such as land for buildings, sports grounds, parks and so on than in forests. Further, in the Tokyo Metropolis, forests are mostly concentrated in the western part; therefore, it can be said that dioxins released from general waste incinerators in this region have a small impact on land environments. Accumulation of dioxins was also found in rice fields (paddy fields which are moist all year due to improper irrigation, dry rice fields and so on), other farming land (wheat fields, orchards and so on), riverland, lakes and marshes (watercourses and natural lakes), which can be pathways of dioxin ingestion for humans. However, the accumulated amounts were not as great as those for land for buildings, forests and land for other uses.
6. Evaluation of the Vicinity of Sources
6.1. Evaluation Targets
The evaluation targets of this section were incinerators with a fire bed area of 0.5 m2 or greater, or an incineration capacity of more than 50 kg/h or greater which are required by the Law Concerning Special Measures against Dioxins to conduct independent measurements once a year or more. In addition to the general waste incinerators which were evaluation targets in the previous section, large-scale sludge incinerators with an incinera-
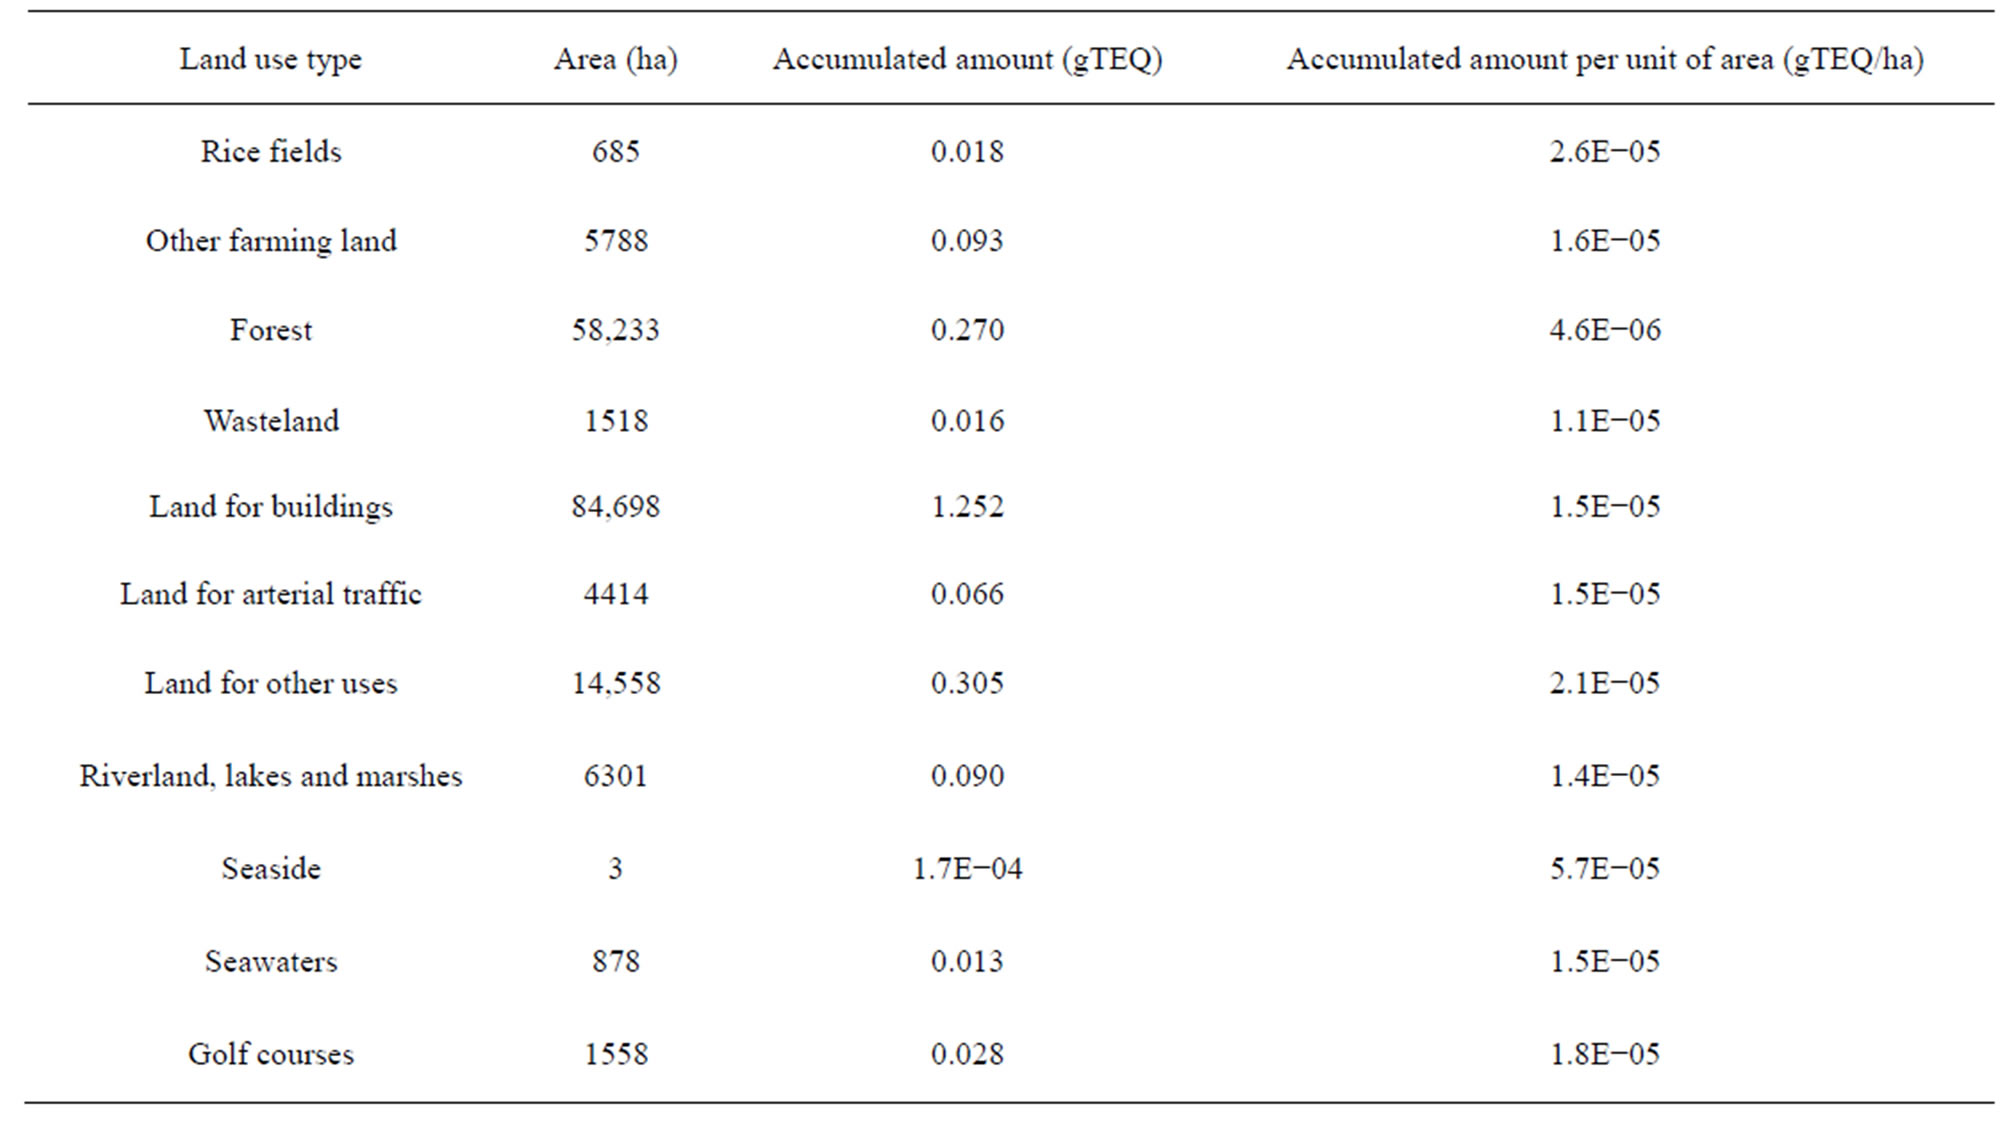
Table 3. Accumulated amounts of dioxins in each land environment.
tion capacity of more than 4000 kg/h managed by the Tokyo Metropolitan Government Bureau of Sewerage, and medium-sized and small incinerators with an incineration capacity of less than 4000 kg/h were also targets of evaluation. The METI-LIS analysis covers limited ranges which are the vicinity of sources, and it can evaluate environmental risk focusing on all incinerators, including incinerators that do not operate continuously throughout the year, small incinerators with low stacks and so on. Figure 5" target="_self"> Figure 5 shows distribution maps of incinerators that are targets of evaluation in this section for the years 2000 and 2001, which were years of high dioxin contamination levels, according to the analysis results of the previous section.
Similarly, METI-LIS was used to conduct level distribution analysis which mainly focused on the vicinity of general waste incinerators in the three areas of the northern part of Hino City, the northeastern part of Ota Ward and the southwestern part of Setagaya Ward, for which the analysis results of the previous section showed particularly high contamination levels. Concerning the evaluation target range, a range of calculation of 6 km east-west and 6 km north-south was set such that general waste incinerators of the areas concerned would be included, and level distribution was output using a 100 m mesh unit. Because METI-LIS output results are output using point data (a level for each grid point), the GIS was used to store and display the output results in polygon data with a 100 m mesh unit. In order to make the position of buildings and rivers within the range of calculation easy to identify, structure perimeter lines of buildings and water edge lines from map basis information for digital map data were displayed.
The evaluation target period was set as the years 2000 and 2001, years for which the rate of contamination by dioxins was high, according to the analysis results of the previous section. For the year 2000, the northern part of Hino City, the northeastern part of Ota Ward and the southwestern part of Setagaya Ward were evaluated. For the year 2001, the northeastern part of Ota Ward and the southwestern part of Setagaya Ward were evaluated. In 2001, the atmospheric levels greatly decreased in the
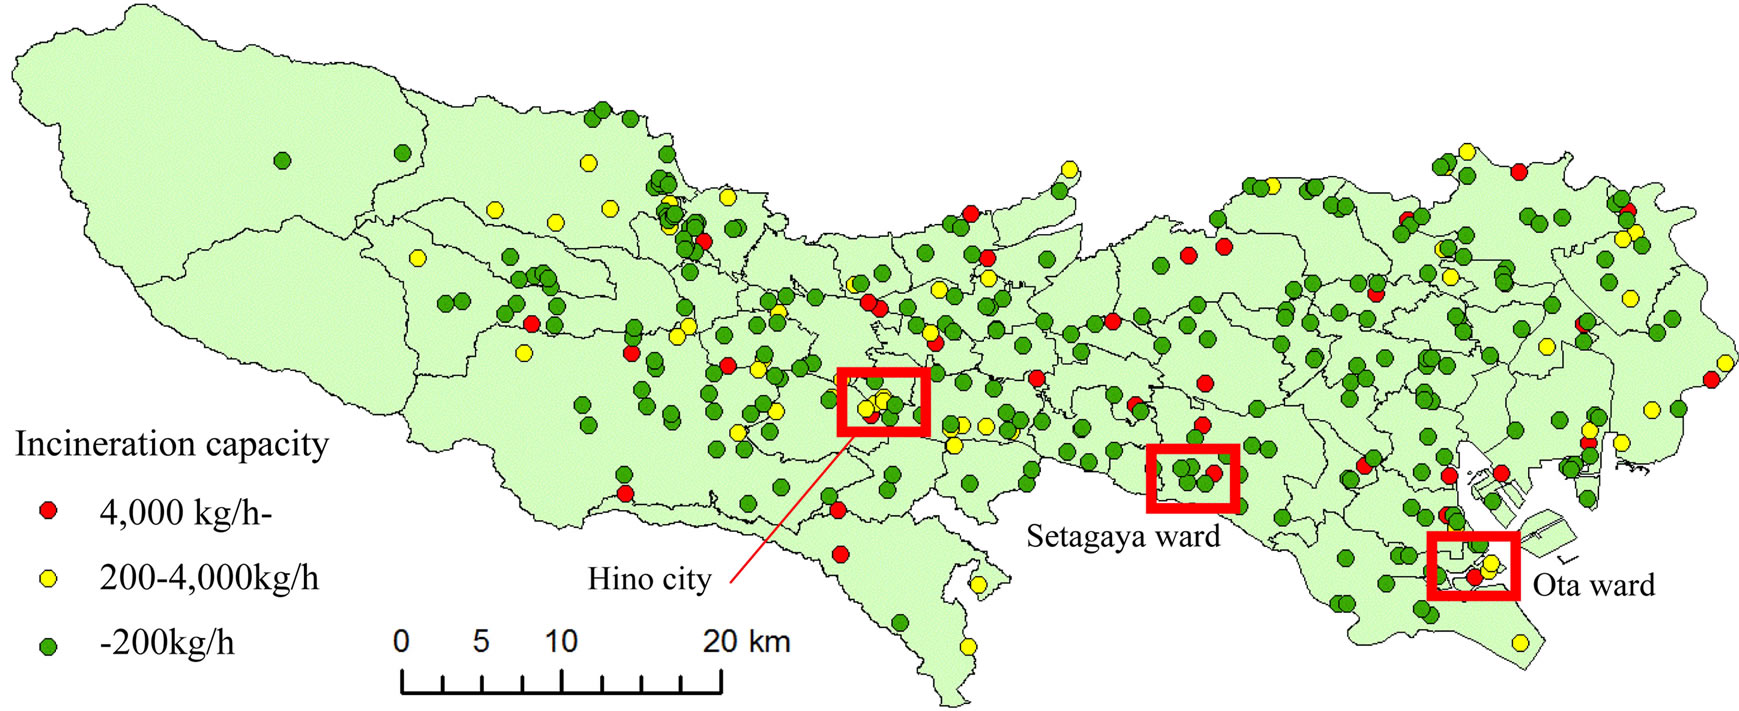 2000
2000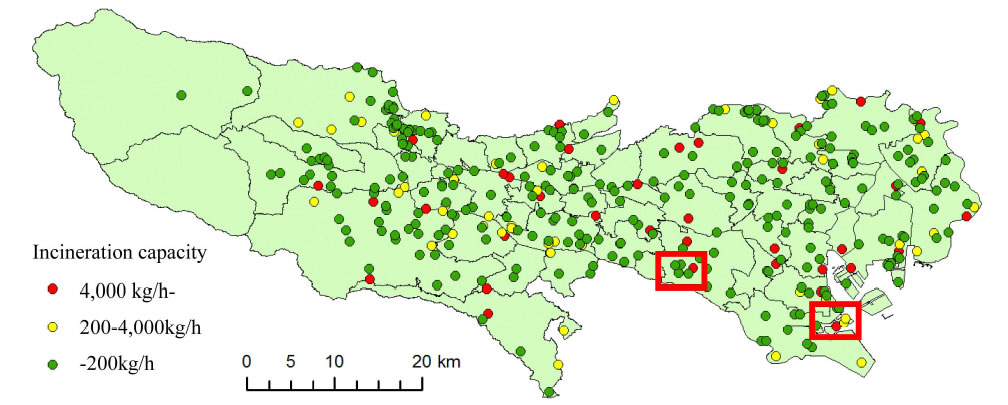 2001
2001northern part of Hino City; therefore, evaluation of this area was not conducted for the year 2001.
6.2. Calculation Conditions
1) Source data and chemical substance parameters In order to use METI-LIS to conduct analysis of level distribution, data concerning sources, chemical substance parameters and data concerning buildings in the calculation range (refer to Section 6.2 3)) are necessary. Source data is source location (longitude and latitude), annual emissions and emissions elevation; chemical substance parameters are the molecular weight and form of the chemical substance. Concerning the dioxin parameters, referring to the related research previously mentioned [1, 4,5,7-23] and the Ministry of the Environment (2004) [3], the molecular weight of a dioxin was assumed to be 388, the molecular weight for PeCDF, which occurs in the greatest percentage at incineration plant exhaust gas dioxin levels, and the form of a dioxin was entered into METI-LIS as a particulate spherical shape.
2) Details of source data Concerning the incinerators for evaluation, incinerators with an incineration capacity of less than 200 kg/h were considered small; those with an incineration capacity of 200 kg/h to 4000 kg/h were considered mediumsized; and those with an incineration capacity of more than 4000 kg/h were considered large. Calculations were performed assuming large-scale incinerators to be total continuous type incinerators which operated 24 hours a day, and medium-sized and small incinerators to be incinerators with a daily combustion time of eight hours (the normal daily incineration time for incinerators of such scales, according to Miyoshi (2004) [34]). As stack heights of each incinerator, for incinerators whose stack height was publicly available (mainly general waste incinerators), the published stack heights were entered. In the case of all the incinerators whose stack height was not publicly available (mainly small-scale incinerators managed by business establishments), Miyoshi (2004) was referred to, and the average value for the stack height of small-scale incinerators, 10 m, was input. Further, emissions calculations and operating conditions settings were performed assuming that an incinerator which went into disuse during a year of the evaluation period operated up till the day before the date that it went into disuse.
3) Building data In analysis using METI-LIS, apart from data for sources of evaluation targets, it is also necessary to input data concerning the width and height of buildings which affect dispersion. Because practically speaking it was impossible to input all data for buildings within the calculation range, reference was made to Japan Environmental Management Association for Industry (2012) [35], and buildings for which it was possible that the effects of downwash, which is a consequence of disturbance of air current due to a building, may appear (mainly buildings with a height of 20 m or more) were identified in the surroundings of incinerators, and the height of those buildings was input.
6.3. Results and Consideration
1) Results of the analysis using the atmospheric dispersion model (METI-LIS) and consideration Results of analysis of atmospheric levels and deposition amounts calculated using METI-LIS are shown in Figures 6 to 8. Because METI-LIS output results are shown using point data, setting was performed such that each piece of point data was displayed in the center of gravity of 100 m mesh unit data (in this section, land use subdivision mesh data); and using GIS, the METI-LIS analysis results were stored in the 100 m mesh unit data. Therefore, the analysis results are shown using a 100 m mesh unit level distribution. Through carrying out these steps, 100 m mesh unit atmospheric level and deposition amount level distributions were grasped for areas estimated to have a high risk of contamination by the ADMER evaluation results of the previous section, and it was possible for the impact on population and land environments to be considered in more detail for these areas.
Values of more than 0.6 pgTEQ/m3, which is the Japanese environmental standard for dioxin atmospheric levels, were estimated for the northeastern part of Ota Ward. An example of a cause for why levels exceeding the environmental standard were estimated is the impact of buildings near large-scale incinerators. The height of the stack of the large-scale incinerator emitting the most dioxins into the atmosphere in this area is 41 m. However, because buildings in the vicinity of this incinerator are about 30 m high, a downwash, which is a disturbance in air current caused by a building, occurs, and dioxins which should be dispersed into the atmosphere accumulate in the surroundings of the stack of the incinerator; thus, very high dioxin levels which exceeded the environmental standard were estimated in places.
In the evaluation using METI-LIS described in this section, besides general waste incinerators, large-scale sludge incinerators managed by the Tokyo Metropolitan Government Bureau of Sewerage, and medium-sized and small incinerators were also evaluation targets; however, the region with the highest levels in Figures 6 to 8 is in the neighborhood of a general waste incinerator shown in Figure 2; therefore, it was found that atmospheric levels are greatly dependent on general waste incinerators. However, according to the Tokyo Metropolitan source data shown in Table 1, no incinerator included in the evaluation target range of this section had a level of dioxins in exhaust gases which exceeded the environmental

Figure 6. Dioxin atmospheric level distribution (pgTEQ/m3, left) and deposition amount distribution (pgTEQ/m2, right) in the northern part of Hino city for the year 2000.

Figure 7. Dioxin atmospheric level distribution (pgTEQ/m3, left) and deposition amount distribution (pgTEQ/m2, right) in the northeastern part of Ota ward for the years 2000 and 2001.
standard.
2) Environmental risk evaluation results and consideration a) Risk to humans By superimposing the atmospheric levels estimated using METI-LIS and the population data using GIS, dioxin exposure levels were grasped, and the risk to humans was evaluated. In the national census, there is no 100m mesh unit data; therefore, in this section, as population data, subregion unit (district unit) data is used, rather than 500 m mesh unit data. In three regions (the northern part of Hino City, the northeastern part of Ota
\
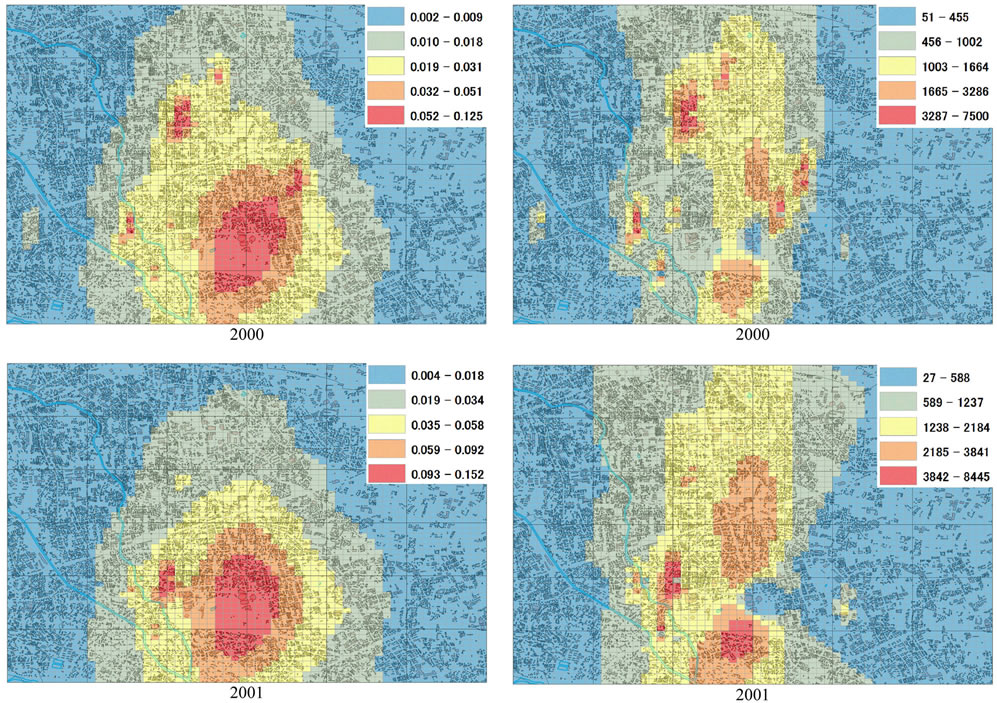
Figure 8. Dioxin atmospheric level distribution (pgTEQ/m3, left) and deposition amount distribution (pgTEQ/m2, right) in the southwestern part of Setagaya ward for the years 2000 and 2001.
Ward and the southwestern part of Setagaya Ward), subregions within the calculation range of METI-LIS described in Section 6.1 were selected. The combined total of atmospheric levels was found for these regional units, and the amount of exposure with respect to the total population was found. Concerning the population data, considering the evaluation target period, data for the year 2000 was used.
From the above-mentioned three regions, subregions in which the maximum atmospheric level exceeded 0.1 pgTEQ/m3 were selected, and these are shown in Figure 9. Looking at Figure 9, it can be seen that in regions which have no residents or an extremely small population, the atmospheric levels are high. A result which was an exception is that in the northeastern part of Ota Ward, maximum atmospheric levels exceeded 0.6 pgTEQ/m3, the environmental standard value for atmospheric levels, in five districts in the year 2000 and three districts in the year 2001. However, these subregions are industrial districts, so they do not have residents. Therefore, it can be confirmed that consideration is being given such that incinerators which emit many dioxins are not set up in residential areas and the like, and people are not exposed to high levels of dioxins.
However, Ochikawa of Hino City is unique in that although it is a subregion with a population of over 5000, it was found that the people there were exposed to high atmospheric levels in the year 2000. For this region, an estimation of a maximum level of 0.56 pgTEQ/m3 was obtained, and because this is close to 0.6 pgTEQ/m3, the Japanese environmental standard for dioxin atmospheric levels, the risk to the environment from dioxins caused by incinerators is high. This result is consistent with the fact that in the results of investigation of dioxins in the environment for the year 2000 for the Tokyo Metropolis [36] and in the results of [5], it was shown that Ochikawa in Hino City was a region with a very high level of dioxins, and that among those dioxins there was a high proportion of PCDD which originates from incinerators.
b) Risk to the environment The deposition amounts estimated using METI-LIS and the land use data were superimposed using the GIS, and thereby, accumulation levels in each land environment were grasped, and the risk to the environment was evaluated. As land use data, land use subdivision mesh data from 1997, the year closest to the evaluation target
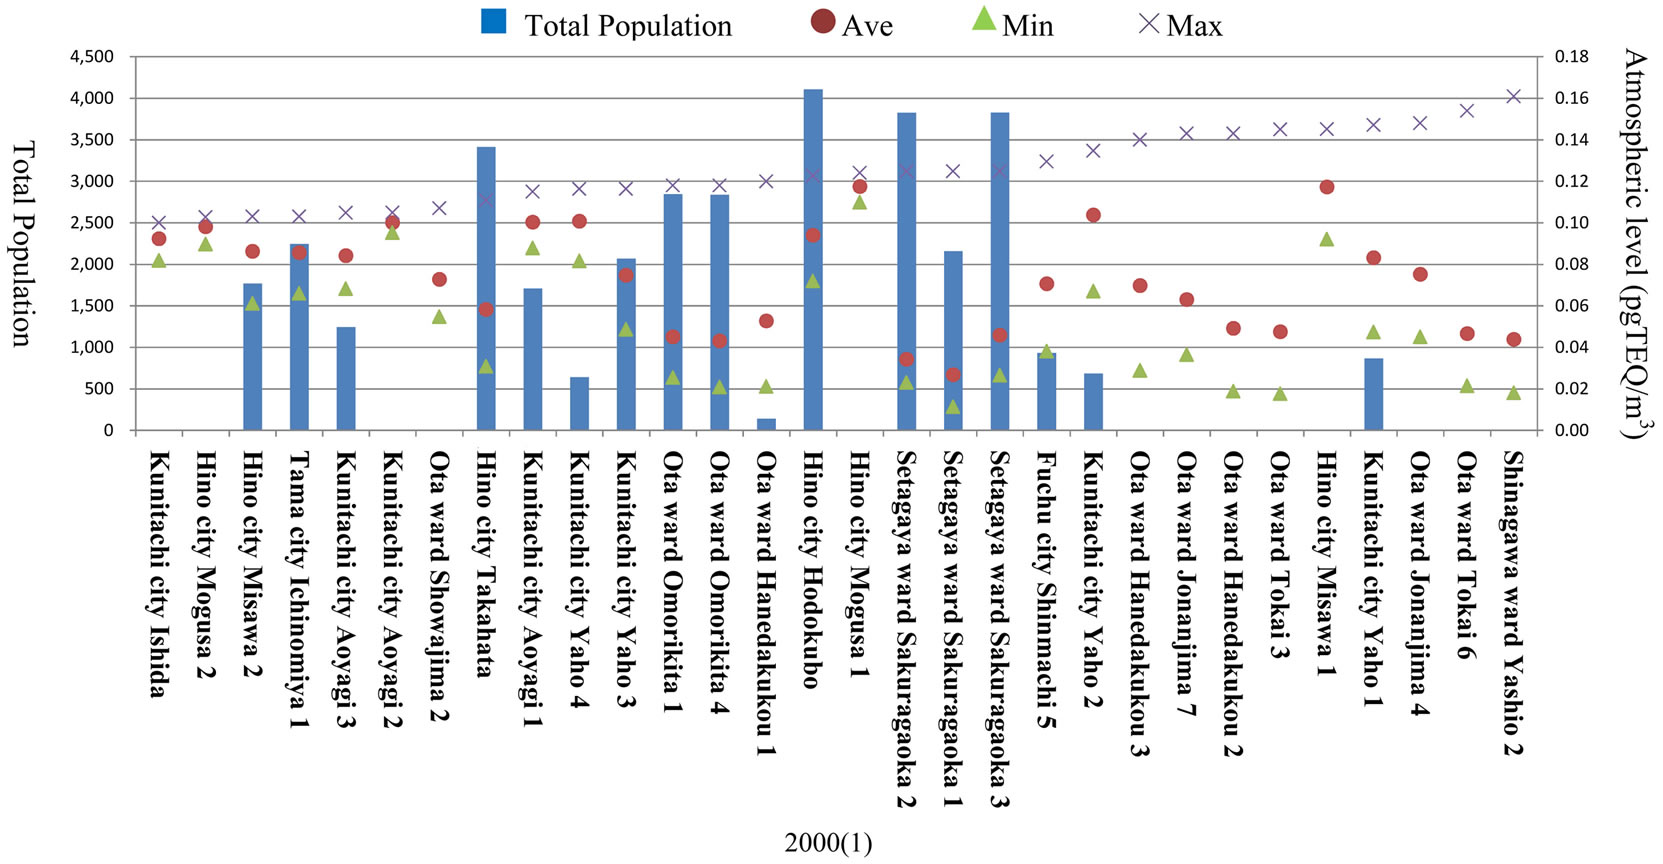
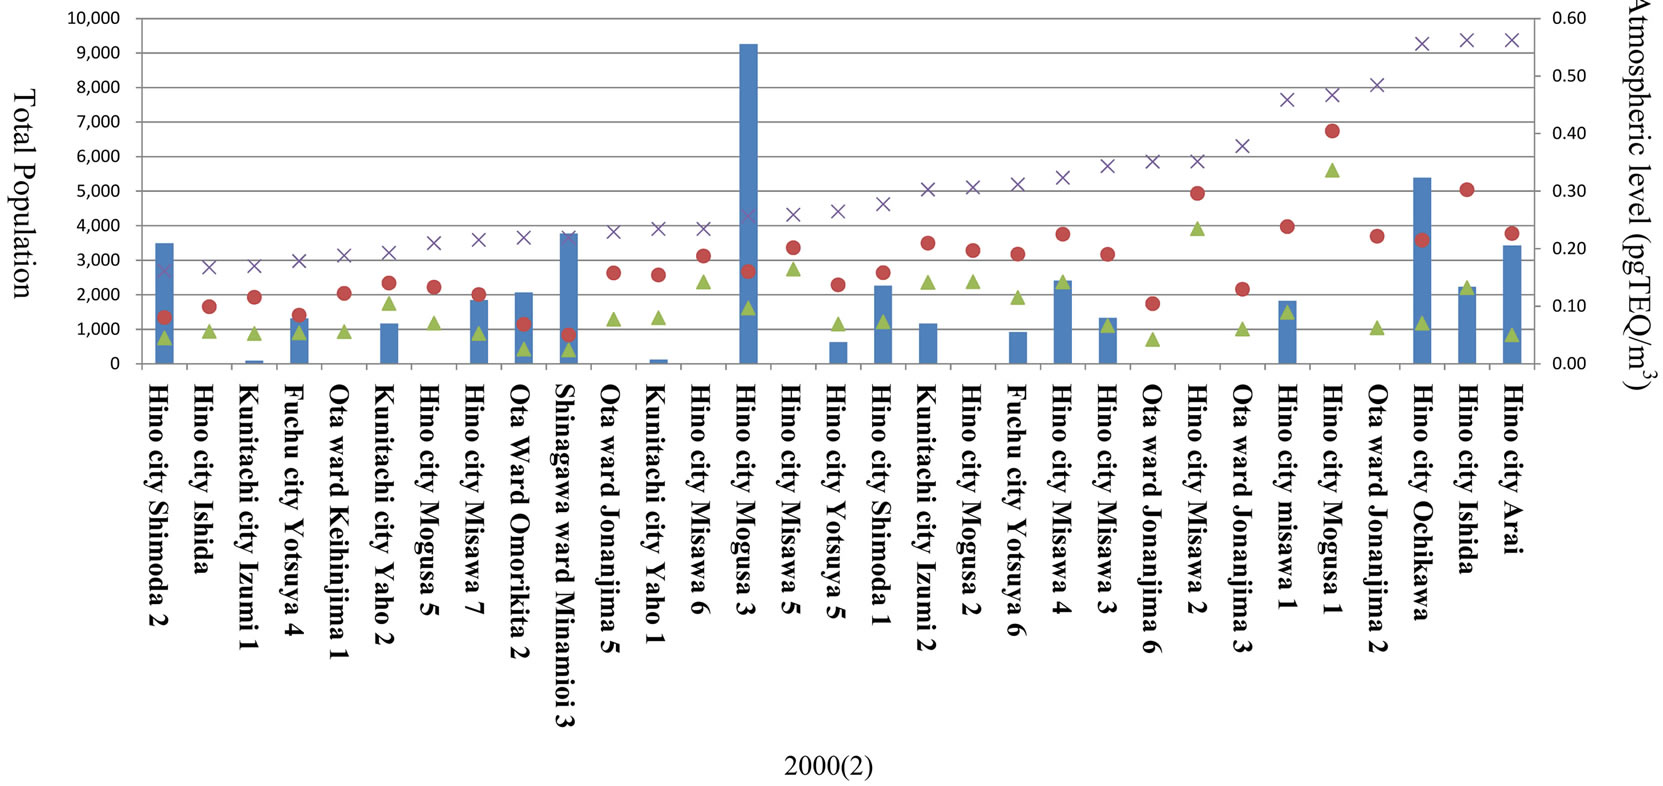
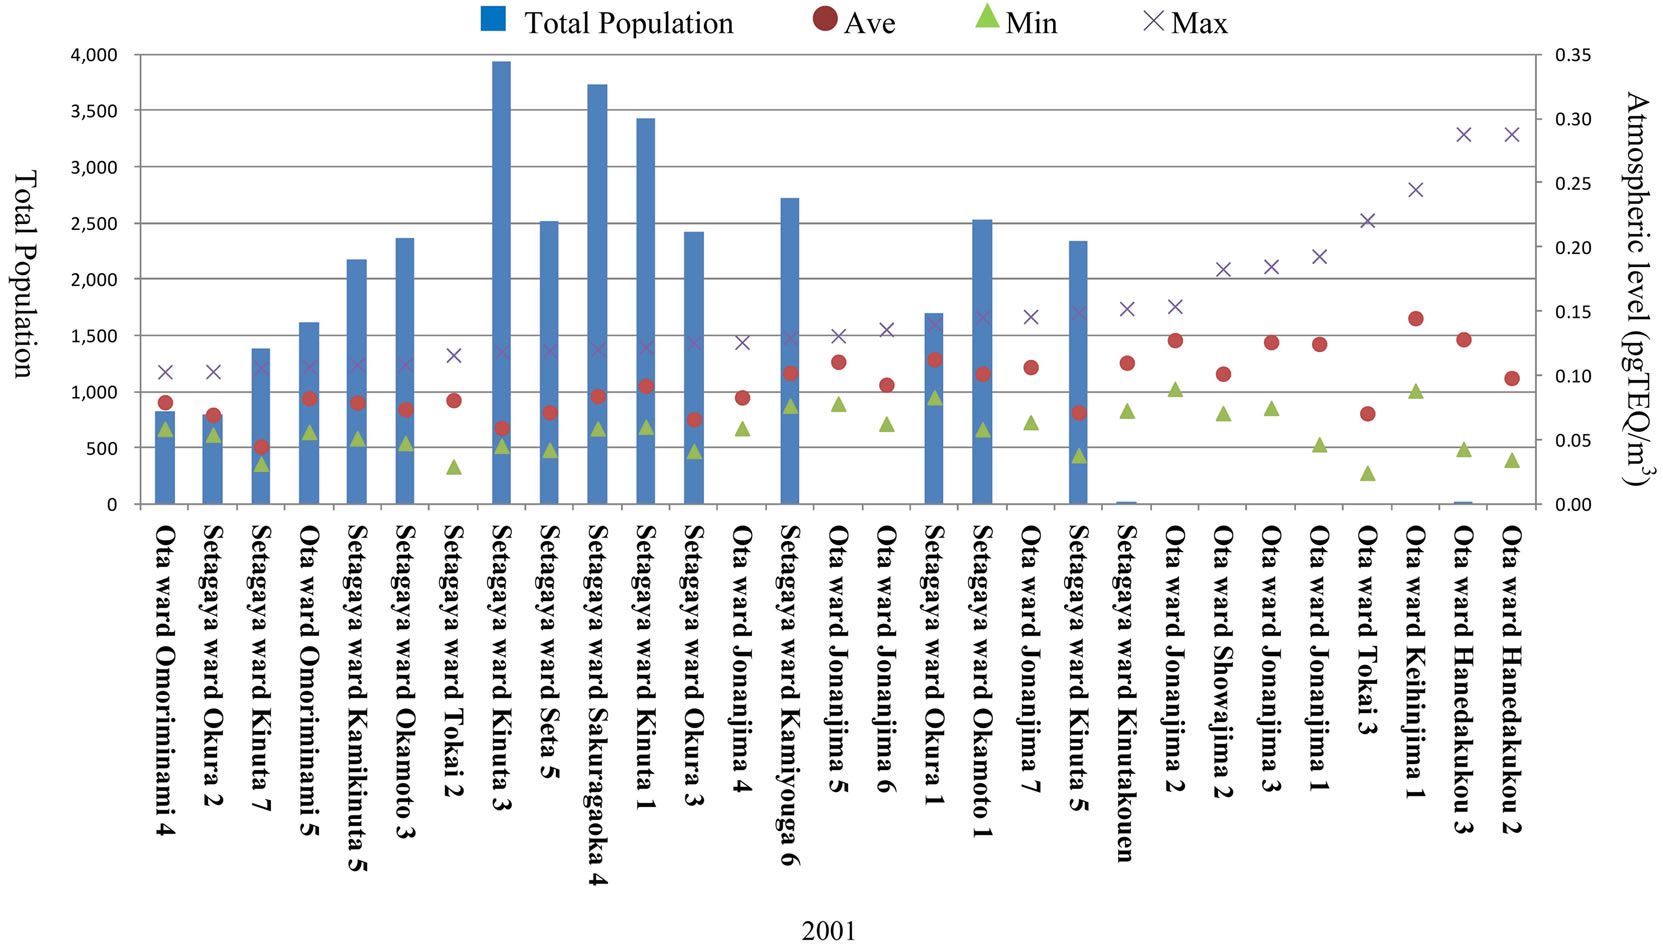
Figure 9. Subregions with a maximum atmospheric level of 0.1 pgTEQ/m3 or more.
period, was used. For the northeastern part of Ota Ward and the southwestern part of Setagaya Ward, the evaluation target period was 2000 to 2001; therefore, the deposition amount was the total amount that accumulated in these two years. Deposition amount was aggregated according to land use for each region, and using a similar calculation method to that of the previous section, the accumulated amounts of dioxin in each land environment of each region were grasped. Table 4 shows the accumulated amounts in each land environment of the three regions. None of the three regions had a land environment with an accumulated dioxin amount which exceeded the Japanese environmental standard for dioxins in soil, which is 0.51 g TEQ per hectare, so it can be determined that there is no risk to the environment.
However, in land environments where dioxins accumulate, different characteristics were observed for each of the three regions. In the northern part of Hino City, land for buildings occupies the majority of the area; however, because the area of “Rice fields”, “Other farming land” and “Riverland, lakes and marshes” in Hino City is large compared with the other two regions, the accumulation amounts for these land uses were also large. These are land environments which must be focused on as routes of ingestion to the human body, and it is possible that in rice fields and other farming land, dioxins will be absorbed from roots via soil and accumulate in agricultural products. Further, in riverland, lakes and marshes, dioxins may move long distances with the flow of water and contaminate environments of other regions, and there is a risk that organisms which inhabit water bodies will take dioxins in the water and in bottom material into their bodies, and these dioxins will be biomagnified in large fish via the food chain.
Although land for buildings occupies the largest area in the northeastern part of Ota Ward, the amounts of dioxin accumulation in industrial areas (“Land for other uses” in Table 4) and bodies of seawater are higher relative to area. The surroundings of the large-scale incinerator within the industrial area which showed a maximum dioxin level which exceeded the environmental standard for atmospheric levels mentioned above is close to Tokyo Bay; therefore, there is a strong possibility that the dioxins released from it have also accumulated in the bottom material of Tokyo Bay. However the air flow in the atmosphere flows towards Tokyo Bay; therefore the impact of dioxins on land for buildings (mainly residential areas) in this area is low. Therefore, in this area, there is a stronger necessity to conduct a more detailed survey involving actual measurements in the industrial areas, rather than the residential areas.
In the southwestern part of Setagaya Ward, a large amount of dioxins has accumulated in land for buildings. This is because approximately 80% of the land in this area that is in the range of calculation is classified as land for buildings. In the estimation results of this section, it was determined that risk to the environment is not a problem; however, it is possible that people could ingest dioxins orally from soil in gardens, parks and so on in the neighborhood of residential areas in land for buildings. In particular, since children spend more time enjoying themselves outdoors than adults do, it is necessary to take into consideration the risk that they may ingest a larger amount of dioxins.
7. Conclusion and Future Research Topic
The conclusion of this study can be summarized into the
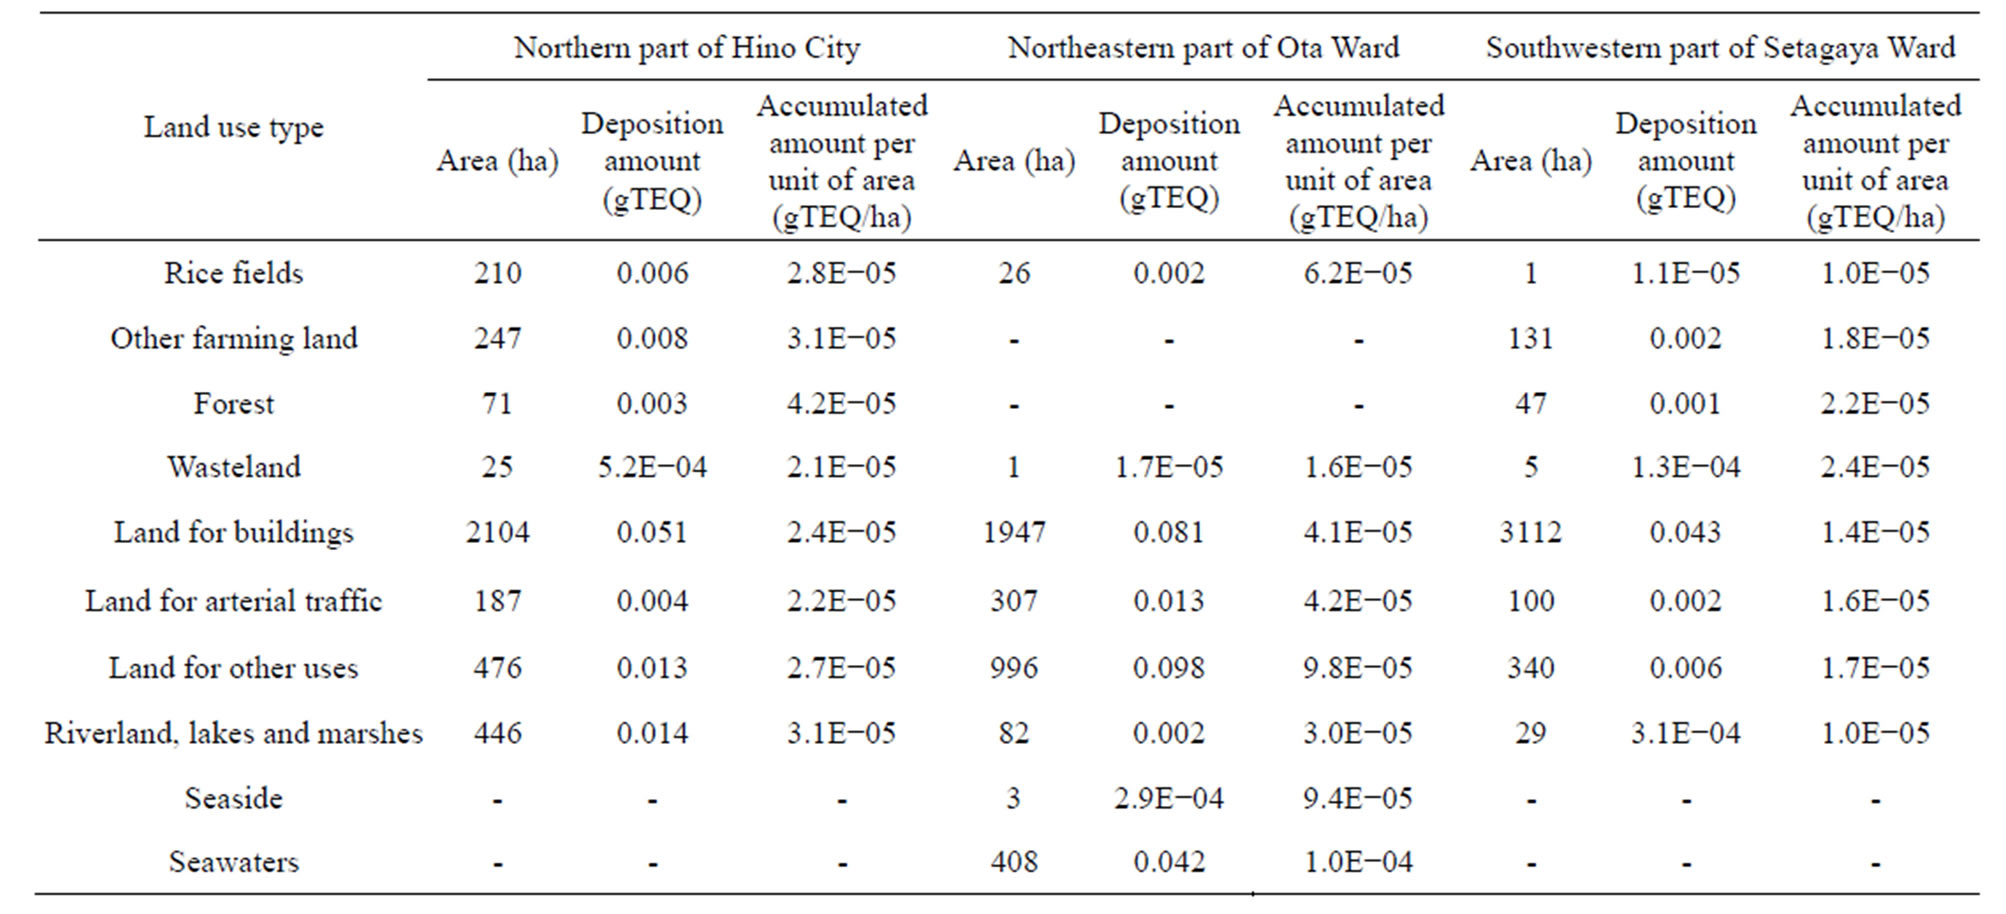
Table 4. Amounts of accumulated dioxins in land environments in each of the three regions.
following three points:
1) A method of evaluating environmental risk in two stages was developed. In the method, two atmospheric dispersion models and GIS were used to create source data, which were used in the two stages of evaluation. In the first stage of evaluation, ADMER was used to conduct a wide-area evaluation which covered the entire area of the evaluation target region. In the second stage, METI-LIS was used to conduct a detailed limited-area evaluation which targeted the vicinity of sources.
2) In this study, incinerators were selected as sources and dioxins were selected as harmful chemical substances. The area selected for evaluation was the Tokyo Metropolis in Japan. The evaluation method proposed in this study was used to evaluate environmental risk. Through the use of atmospheric dispersion models and GIS, the behavior of dioxins emitted into the atmosphere from incinerators was estimated. By superimposing atmospheric levels and population data, the amounts of dioxins that humans exposed to were found. By superimposing deposition amounts and land use data, the amounts of dioxins accumulated in each land environment were found. Conducting these steps enabled the impact of dioxins on humans and the environment to be grasped quantitatively and visually, and the risk that dioxins emitted from incinerators pose to the environment to be evaluated.
3) In the evaluation method developed in this study, through the creation of data concerning sources, a wide area which consists of the entire area of an evaluation target region can be evaluated, and limited areas which consist of the vicinity of sources in areas with high contamination risks can be evaluated in detail. Therefore, if data concerning sources is available, the evaluation method can also be applied to harmful chemical substances other than dioxins. In particular, through using the evaluation method of this study, areas with high levels of harmful chemical substances which should be subjected to surveys involving actual measurements can be identified based on evaluation of impact on land environments, and risk communication between local residents and business people can be stimulated based on evaluation of impact on humans; therefore, the evaluation method can effectively support harmful chemical substance countermeasures and measures to improve the environment.
Future research topic is to verify the usefulness of the evaluation method developed in this study by using the method in evaluations concerning harmful chemical substances which have other sources.
REFERENCES
- M. Kawashima, T. Tobe, A. Kaga, A. Kondo, Y. Inoue, D. Matsumoto and Y. Dong, “A Multimedia Model for the Evaluation of Environmental Behavior of Dioxins,” Annual Report of FY2004, the Core University Program between Japan Society for the Promotion of Science and Vietnamese Academy of Science and Technology, 2005, pp. 59-64.
- Ministry of the Environment, “Dioxin Behavior Model Handbook,” Ministry of the Environment, Tokyo, 2004.
- J. Nakanishi, S. Hanai and Y. Yoshida, “Entrance and exit Scenario and Criteria,” Maruzen Co., Ltd., Tokyo, 2008.
- H. Sasaki, F. Iimura, T. Tsukui, H. Yoshioka, Y. Sasaki, H. Ando and N. Kashiwagi, “Study on the Composition of Dioxins of Environment in Tokyo,” FY2004 Annual Report of the Tokyo Metropolitan Research Institute for Environmental Protection, 2004, pp.117-123.
- K. Higashino, T. Abe, T. Yamamoto, S. Hashimoto, N. Kashiwagi and Y. Sasaki, “Study of Estimating of Dioxin Source Contribution Using Chemical Mass Balance Method,” FY2007 Annual report of the Tokyo Metropolitan Research Institute for Environmental Protection, 2007, pp. 63-68.
- Ministry of the Environment, “Measures Concerning Dioxins,” 2012. http://www.env.go.jp/chemi/dioxin/index.html
- K. Sato, Y. Shimizu, T. Suzuki, S. Kim, N. Masafumi and K. Hattori, “Spatial Distribution of Dioxins from Incineration Sources and Its Estimation Using Atmospheric Dispersion Model,” Journal of Environmental Instrumentation, Control and Automation, Vol. 9, No. 2, 2004, pp. 273-276.
- K. Sato, “Estimation of Stockpile, Origin and Outflow Behavior of Dioxins in the Basin,” Ph.D. Dissertation, Kyoto University, Kyoto, 2006.
- T. Teshima, S. Shibakawa, Y. Fujita, A. Matsumoto, N. Takeda and M. Takaoka, “Reduction of Dioxin Emissions by Retrofitting a Municipal Solid Waste Incinerator,” Journal of the Japan Society Waste Management Experts, Vol. 17, No. 4, 2006, pp. 281-292. http://dx.doi.org/10.3985/jswme.17.281
- H. T. Trinh, “Spatial Distribution of Dioxin Plumes in the Vicinity of an Incinerator Using Air Dispersion Coupled Geostatistical Model,” Ph.D. Dissertation, University of Michigan, Michigan, 2009.
- G. Ripamonti, G. Lonati, P. Baraldi, F. Cadini and E. Zio, “Uncertainty Propagation in a Model for the Estimation of the Ground Level Concentration of Dioxin/Furans Emitted from a Waste Gasification Plant,” Reliability Engineering and System Safety, Vol. 111, No. 120, 2013. pp. 98-105. http://dx.doi.org/10.1016/j.ress.2013.05.012
- D. C. Ashworth, G. W. Fuller, M. B. Toledano, A. Font, P. Elliott, A. L. Hansell and K. Hoogh, “Comparative Assessment of Particulate Air Pollution Exposure from Municipal Solid Waste Incinerator Emission,” Journal of Environmental and Public Health, Vol. 2013, 2013, Article ID: 560342.
- J. A. Maantay, J. Tu and A. R. Marokoa, “Loose-Coupling an Air Dispersion Model and a Geographic Information System (GIS) for Studying Air Pollution and Asthma in the Bronx, New York City,” International Journal of Environmental Health Research, Vol. 19, No. 1, 2009, pp. 59-79. http://dx.doi.org/10.1080/09603120802392868
- Q. Chen, J. Sun and J. Liu, “Toxicity Prediction of Dioxins and Dioxin-Like Compounds Based on the Molecular Fragments Variable Connectivity Index,” Environmental Contamination and Toxicology, Vol. 87, No. 2, 2011, pp. 134-137. http://dx.doi.org/10.1007/s00128-011-0316-x
- M. Onofrio, R. Spataro and S. Botta, “The Role of a Steel Plant in North-West Italy to the Local Air Concentrations of PCDD/FS,” Chemosphere, Vol. 82, No. 5, 2011, pp. 708-717. http://dx.doi.org/10.1016/j.chemosphere.2010.10.095
- X. Ma, X. Jiang, Y. Jin, H. Liu, X. Li, T. Chen and J. Yan, “Dispersion Modeling and Health Risk Assessment of Dioxin Emissions from a Municipal Solid Waste Incinerator in Hangzhou, China,” Journal of Zhejiang University—SCIENCE A (Applied Physics & Engineering), Vol. 13, No. 1, 2012, pp. 69-78.
- B. Zhang, F. Meng, C. Shi, F. Yang, D. Wen, J. Aronsson, P. K. Gbor and J. J. Sloan, “Modeling the Atmospheric Transport and Deposition of Polychlorinated Dibenzop-Dioxins and Dibenzofurans in North America,” Atmospheric Environment, Vol. 43, No. 13, 2009, pp. 2204- 2212. http://dx.doi.org/10.1016/j.atmosenv.2009.01.004
- J. F. Viel, “GIS and Atmospheric Diffusion Modeling for Assessment of Individual Exposure to Dioxins Emitted from a Municipal Solid Waste Incinerator,” In: J. A. Maantay and S. McLafferty, Eds., Geospatial Analysis of Environmental Health, Springer Verlag, Berlin, 2011, pp. 443-456. http://dx.doi.org/10.1007/978-94-007-0329-2_22
- S. Bunsan, W. Chen, H. Chen, Y. H. Chuang and N. Grisdanurak, “Modeling the Dioxin Emission of a Municipal Waste Incinerator Using Neural Networks,” Chemosphere, Vol. 92, No. 3, 2013, pp. 258-264. http://dx.doi.org/10.1016/j.chemosphere.2013.01.083
- X. Zeng, X. Zhang and Y. Wang, “QSPR Modeling of nOctanol/Air Partition Coefficients and Liquid Vapor Pressures of Polychlorinated Dibenzo-p-Dioxins,” Chemosphere, Vol. 91, No. 2, 2013, pp. 229-232. http://dx.doi.org/10.1016/j.chemosphere.2012.12.060
- J. M. Armitage, M. S. McLachlan, K. Wiberg and P. Jonsson, “A Model Assessment of Polychlorinated Dibenzop-Dioxin and Dibenzofuran Sources and Fate in the Baltic Sea,” Science of the Total Environment, Vol. 407, No. 12, 2009, pp. 3784-3792. http://dx.doi.org/10.1016/j.scitotenv.2009.03.001
- C. K. Huang and J. Liang, “Effects of Basin Topography and Monsoon Conditions on Transport and Occurrence of Atmospheric PCDD/FS in the Taichung Basin,” Environmental Science and Pollution Research, Vol. 18, No. 8, 2011, pp. 1305-1315. http://dx.doi.org/10.1007/s11356-011-0464-x
- H. S. Rifai, D. Lakshmanan and M. P. Suarez, “Mass Balance Modeling to Elucidate History and Continuing Sources of Dioxin into an Urban Estuary,” Chemosphere, Vol. 93, No. 2, 2013, pp. 480-486. http://dx.doi.org/10.1016/j.chemosphere.2013.06.016
- National Institute of Advanced Industrial Science and Technology, “ADMER,” 2012. http://www.aist-riss.jp/software/admer/ja/index_ja.html
- National Institute of Advanced Industrial Science and Technology, “ADMER ver.2.5 Instruction Manual,” 2009.
- National Institute of Advanced Industrial Science and Technology, “Detailed Risk Assessment Technical Guidance—Detailed Edition—No. 2. ADMER—Exposure/Risk Assessment Atmospheric Dispersion Model,” 2005.
- Ministry of Economy, Trade and Industry, “Ministry of Economy, Trade and Industry—Low-Rise Industrial Source Dispersion Model—METI-LIS Model ver.3.02—Instruction Manual,” 2012.
- Ministry of Economy, Trade and Industry, “Manual for Method of Estimating Environmental Impact in the Vicinity of Sources Relating to Hazardous Air Pollutants (Ministry of Economy, Trade and Industry—Low Rise Industrial Source Dispersion Model: METI-LIS) ver.3.02,” 2009.
- Ministry of Economy, Trade and Industry, “Detailed Risk Assessment Technical Guidance—Detailed Edition—No. 3. Low-Rise Industrial Source Dispersion Atmospheric Level Estimation System (METI-LIS),” 2006.
- Committee to Investigate Measures for the Reduction of Dioxins Related to Waste Treatment, “Guidelines for the Prevention of the Occurrence of Dioxins Relating to waste Treatment, etc.: Dioxin Reduction Program,” 1997.
- Ministry of the Environment, “Inventory of Dioxin Emissions (Emissions Inventory),” 2001.
- Central Environment Council, “Report of the Advisory Committee for Environmental Standards for Dioxins Relating to Atmospheric Pollution,” 1999.
- Ministry of the Environment, “Manual for Soil Survey Measurements Relating to Dioxins,” 2009.
- M. Yasuhiko, “Small-Scale Incinerators,” Environmental Communications, Tokyo, 2004.
- Japan Environmental Management Association for Industry, “Explanation of METI-LIS Model Program,” 2001. http://www.jemai.or.jp/tech/meti-lis/analysis.html
- Bureau of Environment, Tokyo Metropolitan Government, “Results of the Survey on Dioxins in the Tokyo Metropolitan Environment,” 2012. http://www.kankyo.metro.tokyo.jp/chemical/chemical/dioxin/result/report_2000.html
NOTES
*Corresponding author.