Journal of Environmental Protection
Vol.4 No.11(2013), Article ID:39881,6 pages DOI:10.4236/jep.2013.411144
Heavy Metals Nickel and Chromiumin Sediments in the Juru River, Penang, Malaysia
![]()
School of Environmental and Natural Resources Sciences, University of Kebangsaan Malaysia, Bangi, Malaysia.
Email: idriss_73@yahoo.com
Copyright © 2013 A. A. Idriss, A. K. Ahmad. This is an open access article distributed under the Creative Commons Attribution License, which permits unrestricted use, distribution, and reproduction in any medium, provided the original work is properly cited.
Received September 3rd, 2013; revised October 2nd, 2013; accepted October 29th, 2013
Keywords: Heavy Metals; Sediments; Sequential Extraction; ICP-MS
ABSTRACT
Study was conducted to determine the concentrations of (Ni) and (Cr) in sediment and to investigate the effect pH and organic matters on concentrations of nickel and chromium in sediment at Juru River, Penang, Malaysia. The sequential extraction procedure was used based on defined fractions: exchangeable, acid reduction, oxidation and residual. The concentrations of Ni and Cr in residual fraction were higher than the other fractions. In non-residual fractions, the concentration of heavy metals in organic matter fraction was much higher than other fractions (6.63 ± 3.90 µg/g−1 dry weight ) for nickel and (6.44 ± 2.10 µg/g−1 dry weight) for chromium. The pH of the sediment in all sites was acidic. The mean of total concentrations of Ni and Cr was 38.21 and 24.92 µg/g−1 dry weight, respectively. Results of organic matter analysis showed that the percentage of organic matter present in sediment samples varied throughout the river and all sites of sediments were ranged from 7.10% to 16.20%. Comparison between sampling sites using one-way analysis of variance showed that there were significant differences for Ni (P < 0.05) while there was no significant differences for Cr (P > 0.05) in changeable fraction. At acid reduction, oxidation and residual fractions, there were significant differences for the two metals (P < 0.05). For anthropogenic metals, Ni was varied significantly (P < 0.05) whereas Cr was not found significantly (P > 0.05). Analysis of pH and percentage of organic matter present in sediment conclude that Ni and Cr were not strongly correlated at oxidation fraction.
1. Introduction
The pollution of the surface sediments especially rivers with Toxic metals has been attracting considerable public attention over the past few decades. Heavy metals added to an aquatic system by natural or by anthropogenic sources. One of the major sources of heavy metals in river is the industrial effluent. The tremendous use of heavy metals over the past few decades has resulted in an increased concentration of metals in the aquatic systems. Heavy metals released to aquatic system are generally bound to particulate matter, which eventually settles down and becomes incorporated into sediments. River water has been used as drinking water and irrigation water for agriculture and for fish culture. Also, rivers are important in soil fertility maintenance, transportation, forest resources development and wildlife conservations.
The rapid industrialization has the potential to help achieve a variety of social objectives such as employment, poverty eradication, gender equality, labor standardsand greater access. But such indiscriminate growth had created several mammoth environmental issues: changing climate, biodiversity depletion, natural resources destruction, environmental pollution, extinction of species, etc.
Sediments are important sinks for various pollutants like pesticides and heavy metals and also play a significant role in the remobilization of contaminants in aquatic systems under favourable conditions [1]. Sediments play an important role in the transport of nutrients, metals, and other contaminants through river systems to the world’s oceans and seas. Sediments also act as metal reservoirs, with the primary exchange modes being adsorption or precipitation, and can also provide a reasonably accurate history of pollution in the river [2-4]. The objectives for this study are to determine the concentrations of nickel and chromium in sediment and to investigate the effect sediment pH and sediment organic matter on concentrations of nickel and chromium in sediment at oxidation fraction from the Juru River.
2. Material and Methods
The date for each sampling site is illustrated in (Table 1). Juru River originates from Bukit Mertajan hills located at 05˚22'N latitude and 100˚28'E longitude, Penang, northeastern of Malaysia (Figure 1) and drains approximately 7.95 km long. The Jururiver receives water from several small tributaries that flow through urban settings that grossly polluted with industrial, agriculture and domestic wastes that are discharged directly into these rivers. Besides high levels of organic loadings, these wastes are also contaminated with heavy metals [5].
Sediment samples were collected 2 times (December 2009 and August 2010) using grab sampler from 20 sites in the river. The wet sediments were air-dried in clean air cabinets, grounded using clean mortar and pestle, sieved through less than 63 µm mesh for heavy metal determinations, homogenized and later stored in previously acidsoaked sample bottles. Analysis of metal concentration to less than 63 µm sediment fraction is recommended because these particles are the most important sources of bioavailable metals in sediments [6,7] and sieving does not affect the metal concentration [7].
In this study, sequential extraction procedure was used and conducted with modification by adopting the method of Badri and Aston [8]. This procedure consists of four stages. The extraction steps employed in this study are described as follows: Extraction 1—Easily and Freely Leachable and Exchangeable fraction: 50 ml 1 M NH4CH3COOH at pH 7 was added to the weighted sample into bottle and the sample was shaken for 1 h at a speed of 3000 rpm at room temperature. Extraction 2— Acid Reduction Fraction: 50 ml 0.25 M CH2OH∙HCl at pH 2 (adjusted using HNO3) was added to the residue from Fraction 1, and the sample was shaken under the same settings described in fraction 1. Extraction 3—Organic Oxidation Fraction: 15 ml H2O2 30% was added to the residue from fraction 2 and the sample was placed in water bath until dry. Then, 50 ml 1 M NH4CH3COOH at pH 3.5 (adjusted using HCL) was added to it, and the sample was shaken under the same settings described infraction 1. Extraction 4—Resistance Fraction: residue from fraction 3 was used for final fraction. The sample was placed in a PTFE beaker and added 5:2 HNO3/HClO4 ratios (v/v). The sample was placed on a hot plate and heated until the solution became clear. At the end of each fraction the samples were centrifuged for 30 min at 1500
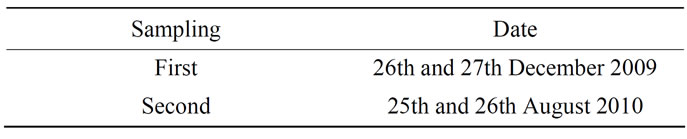
Table 1. The date for sampling of sediment.
rpm to separate the sediment. The sediment was washed in 50 ml of deionized distilled water and again centrifuged. The washed water was discarded. Before analysis, the samples were filtered through 0.45 µm Millipore filters using vacuum pump. The determination of copper, nickel and chromium in sediment were conducted by inductively couple plasma (ICP) model Perkin Elmer/Elan 9000. All samples were analyzed in three replicates.
2.1. Sediment pH
Sediment pH was measured following Duddridge and Wainwright [9]. 20 g of dried sediment was added to 40 ml of distilled water and mixed. pH was measured using a W-500 Witeg Digital pH meter.
2.2. Organic Content
The organic content in sediment was determined following Walkley and Black [10]. 0.25 g of dried sediment was added into flask containing 0.17 M potassium dichromate followed by 20 ml of sulfuric acid. The mixture was then heated on the hot plate for 30 minutes. 200 ml of deionised water was then added into the mixture followed by 10 ml of concentrated phosphoric acid. Diphenylamine was used as indicator and titration was done using ferrous ammonium sulphate 0.4 N (FAS). All titration including the blank was carried out and the percentage of organic content was calculated as below;
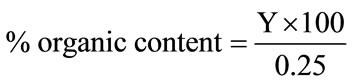
where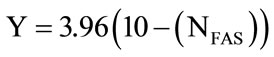 .
.
2.3. Sediment Grain Size
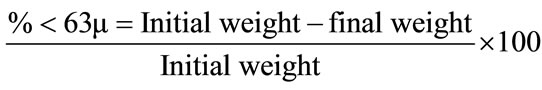
Sediment grain size was measured according to Badri [11]. About 10 gram of dried sediment was sieved through using anti rust laboratory test sieve model BS 410 (63 μm mesh size). Sediment that retained in the sieve was dried repeatedly in oven and final weight was used to calculate the percentage of sediment (<63 μm) using formula as below:
2.4. Quality Control
A quality control samples were routinely run through during the period of metals analysis. Certified Reference Material (CRM) National Institute of Standard and Technology, Buffalo River Sediment, USA) was determined as a precision check. Percentage of recoveries (n = 5 for each metal) for certified and measured concentration of those metals was satisfactory, with the recoveries being 86.4 for nickel and 94.2 for chromium.
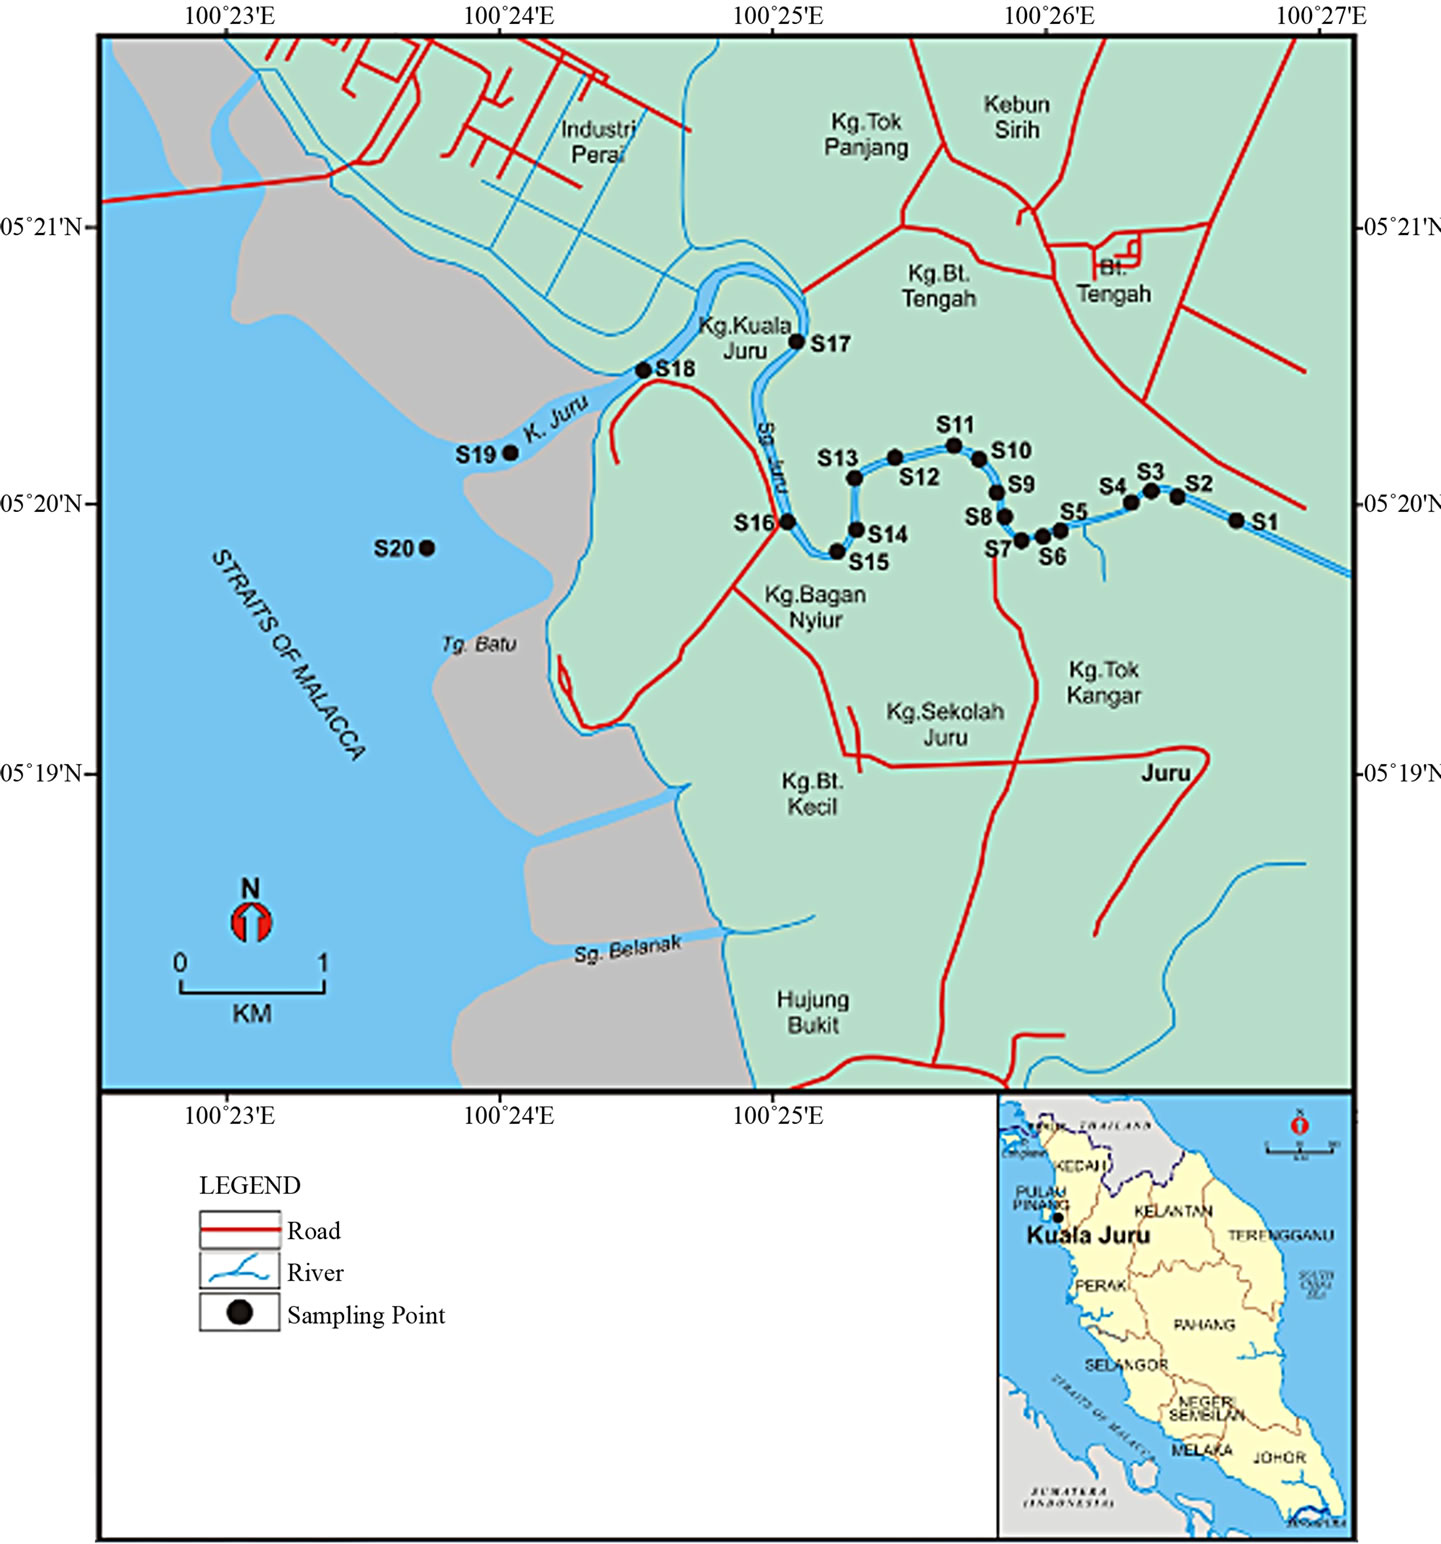
Figure 1. Map of the Juru River and sampling stations.
3. Result and Discussion
3.1. Sediment Characteristics
The mean pH of Juru river sediment samples during 2 sampling occasions (pH range: 3.96 - 6.59) were slightly acidic or towards to alkaline conditions; indicating the slight acidic nature of the sediments in most sampling sites. The pH fluctuates within upstream and downstream sites but it was noticeably higher at sites 1, 2 and 3 (downstream sites) relative to other sites with a mean value of 6.06 ± 0.88 (Figure 2).
The organic matter in the sediments ranged from 7.10% to 16.20% with a mean of 11.17% ± 0.93%. Results of organic matter analysis show that the levels of organic matter present in sediment samples varied throughout the river and downstream sites were relatively higher in organic matter compared to upstream sites. Organic matter detected in this study is similar to those reported from
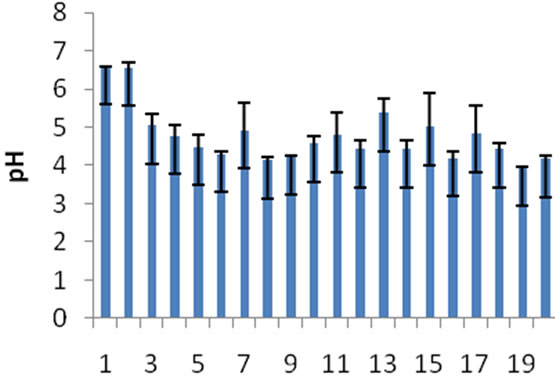
Figure 2. Mean pH values of sediment from 2 sampling occasions.
Klang River in Malaysia (no study was found involving organic matter from the Juru River) at 13.34% [12] and the minimum level of organic matter from our study (8.25%) was somewhat in agreement with the maximum level (8.30%) recorded from Kelantan River by Ahmad et al [13]. It is assumed that such differences were related to variations in the quantity and sources of organic matter present at each site and the ability of organic matter to move in the sediments (Figure 3).
Approximately 49.67% of sediment from Jururiver has grain size less than 63 µm diameter and majority were located close to the estuary. The mean grain size range in this study was 33.88 to 70.77. The estuarine area is recognized as a sink for sedimentation which includes suspended particles [14]. The very fine particles that drifted from upstream finally will precipitate within the estuary area (Figure 4).
3.2. Heavy Metal Concentrations in Sediment
3.2.1. Easily and Freely Leachable and Exchangeable Fraction (EFLE)
This fraction presents a high bioavailability of the associated metals because metal adsorption is related to changes in the ionic composition of the water, which may affect the processes of adsorption-desorption and the mobility of metals on the ground [15] and it has great adverse effect on the aquatic environment in comparison to other fractions. The highest concentration of nickel was found in site 2 with mean value (0.79 ± 0.23 µg/g) whereas the lowest concentration of it was recorded in site 19 at (0.18 ± 0.11 µg/g). There were no much differences between the concentrations of chromium in all sites but chromium was on the top in site 19 (0.56 ± 0.22 µg/g).Comparison between sampling sites using one-way analysis of variance showed that there was significant differences for Ni (P < 0.05) while there was no significant differences for Cr (P > 0.05). Present result for Ni is in disagreement with the finding of previous study conducted in the same river and slightly higher than the results obtained from Kuantan river, Malaysia [16].
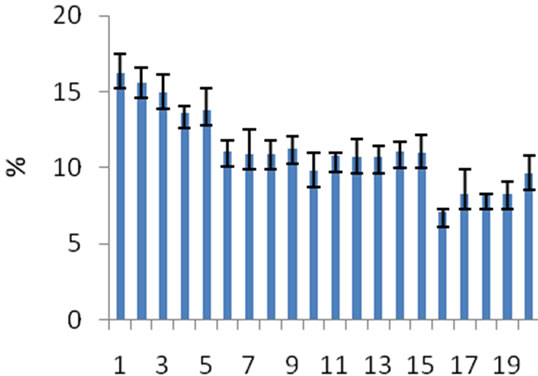
Figure 3. Mean Percentage of organic matter from 2 sampling occasions.
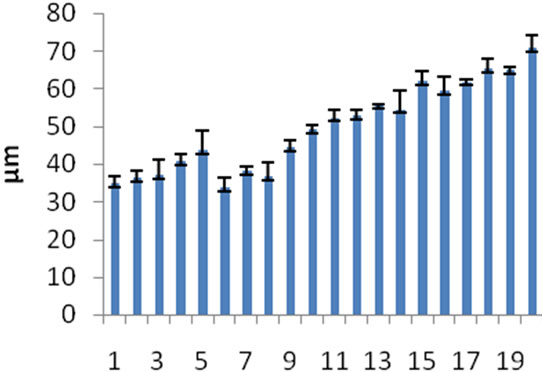
Figure 4. Mean Grain size of sediment from 2 sampling occasions.
3.2.2. Acid Reduction Fraction (AR)
The acid-reducible fraction includes metals associated with manganese and iron oxides and hydroxides and possibly also with carbonates. Iron and manganese-oxides bind the trace metals since they have high scavenging efficiencies for trace metals [17]. The major portion of nickel was in site 5 at 4.93 ± 0.55 µg/g whereas the minor portion of it was found in site 9 at 1.15 ± 0.43 µg/g. The highest concentration of chromium was noted in site 18 at 1.45 ± 0.29; the minimum chromium was recorded in site 17 (0.32 ± 0.08 µg/g). One way ANOVA showed that there were significant differences for the two metals (P < 0.05). The Ni value ranged from 1.15 to 4.93 µg/g, whereas Yap and Tan reported values of 1.23, 1.98 and 2.46 in different areas within the Juru River and a value of 0.37 µg/g in Kuantan River, Malaysia [16].
3.2.3. Organic Oxidation Fraction (OO)
Organic oxidation fraction showed highest composition of nickel and chromium in the non-resistant fraction followed by the ELFE and AR fraction. The pH was found to play a major role in metal absorption in organic oxidation fraction. Results from this fraction indicate that sediment pH was from 3.96 to 6.59, which provides an excellent condition for metal absorption. The presence of humic and fulvic acid in organic materials in reduction condition creates more efficient metal adsorption [18].
The highest concentration of nickel, 13.05 ± 2.22 µg/g, was recorded in site 3 while the lowest concentration of it was found in site 4 with mean value (2.57 ± 0.59 µg/g). Nickel associated largely in the sedimentary matrix and may be less available for remobilization into the water column except under harsh conditions. The maximum level of chromium was observed in site 7 (10.62 ± 2.60 µg/g) whereas the minimum level was found in site 15 at (2.59 ± 0.64 µg/g). Chromium removal required strong acid condition hence their poor association with the carbonate and exchangeable phases. One way ANOVA showed that there were significant differences for the two metals (P < 0.05). Analysis of pH and percentage of organic matter present in sediment conclude that Ni and Cr were not strongly correlated at oxidation fraction. The Ni value varied from 2.57 to 13.05 µg/g, while Yap and Tan reported values of 30.92, 24.42 and 42.35 in different areas within the Juru River and a value of 3.45 µg/g in Kuantanriver, Malaysia [16].
3.2.4. Anthropogenic Metals
The mathematical summation of EFLE, acid-reducible and oxidisable organic fractions constitute the nonresistant fraction (non-lithogenous) [8]. The non-resistant fraction includes the first three fractions (EFLE, AR and OO), which represent anthropogenic metals. Among the nonresidual fractions, the organic matter fraction was much higher than other fractions. The major portion of nickel was found in site 16 at 16.82 ± 6.27 µg/g whereas the minor portion of it was noted in site 12 with mean value (5.42 ± 1.84 µg/g). The concentration of chromium was on the top in site 7 at (11.92 ± 5.76 µg/g) while the lowest chromium was found in site 9 (4.29 ± 1.75 µg/g). Ni was varied significantly (P < 0.05) whereas Cr was not varied significantly (P > 0.05). The mean percentage of anthropogenic metals (ELFE, acid-reducible and oxidisable organic fractions) was recorded (25.56%) for nickel and (30.54%) for chromium. About 84.62% of the nickel in sediment was associated with the oxidation, acid reduction and exchangeable. This result support by Yap and Tan [16] who reported that nickel in non-residual was high in the three areas within the Juru River at (28.07, 32.52 and 46.35 µg/g, respectively) but in contrast to another area in the same study.
3.2.5. Resistant Fraction (R)
The residual phase represents metals largely embedded in the crystal lattice of the sediment fraction and should not be available for remobilization except under very harsh condition [1]. Concentrations in earth crust for baseline concentration for heavy metals except for Pb as described by [19]. Heavy metals concentration in the crust has been widely used to compare the natural concentration in sediment. These values could be used to evaluate the load of anthropogenic metals from its surrounding [19]. In general, this indicates no major anthropogenic metalsload into the river. The residual forms are not expected to be released under normal conditions in nature [20] and could be considered as an inert phase [21]. The highest concentration of nickel, 43 ± 8 µg/g, was recorded in site 17 while the lowest concentration of it was found in site 1 with mean value (16.07 ± 1.40 µg/g). The maximum level of chromium was observed in site 5 (25.49 ± 2.50 µg/g) whereas the minimum level was found in site 19 at (8.35 ± 1.23 µg/g). One way ANOVA showed that there were significant differences for the two metals (P < 0.05). The highest concentration of residual for nickel of all metals in this study higher than previous studies conducted in Kuantan river and some different areas in the Juru River [16]. In this study, the results show that Ni and Cr are mainly found in residual fraction, representing 74.44% and 69.46% respectively. The Cr in this study is slightly lower than results reported by Keivan et al. [22] and Orkun [23] indicating that Cr was mostly retained in the residual fraction.
4. Conclusion
Results indicated that approximately 49.67% of sediment from Juru River had grain size less than 63 µm diameter and majority were located close to the estuary. The spatial distribution of organic materials along the sampling stations shows the significant impact among sites. The organic matter in sediment from Juru River exceeds 10% at all sampling sites. The total mean pH values of sediment were acidic and ranged from 3.96 to 5.01; indicating the slight acidic nature of the sediments in the river. The concentrations of Ni and Cr in residual fraction were higher than the other fractions. Among the non-residual fractions, the concentration of heavy metals in organic matter fraction was much higher than other fractions collected from all sampling sites. According to Merian [19], there were no major anthropogenic metals—load into the river since nickel found to be slightly polluted to the river and Cr was not polluted element. Analysis of pH and percentage of organic matter present in sediment concluded that Ni and Cr were not strongly correlated at oxidation fraction.
5. Acknowledgements
We would like to acknowledge Faculty of Science and Technology, National University of Malaysia and the ministry of high education in Libya for financial support and also the laboratory assistants for sampling and analysing the sediment samples.
REFERENCES
- A. Ikem, N. O. Egiebor and K. Nyavor, “Trace Elements in Water, Fish and Sediment from Tuskegee Lake, SouthEastern USA,” Water, Air and Soil Pollution, Vol. 149, 2003, pp. 51-75. http://dx.doi.org/10.1023/A:1025694315763
- R. J. Gibbs, “Transport Phases of Transition Metals in the Amazon and Yukon Rivers,” The Geological Society of America, Vol. 88, 1977, pp. 829-843. http://dx.doi.org/10.1130/0016-7606(1977)88<829:TPOTMI>2.0.CO;2
- C. K. Jain and C. K. Sharma, “Distribution of Trace Metals in the Hindon River System, India,” Water Resources, Vol. 38, 2001, pp. 81-90.
- A. V. Filgueiras, I. Lavialla and C. Bendicho, “Chemical Sequential Extraction for Metal Partitioning in Environmental Solid Samples,” Journal of Environmental Monitoring, Vol. 4, 2002, pp. 823-857. http://dx.doi.org/10.1039/b207574c
- P. E. Lim and M. Y. Kiu, “Determination and Speciation of Heavy Metals in Sediments of the Juru River, Penang, Malaysia,” Environmental Monitoring and Assessment, Vol. 35, 1995 pp. 85-95. http://dx.doi.org/10.1007/BF00633708
- L. Bat and D. Raffaelli, “Effects of Gut Sediment Contents on Heavy Metal Levels in the Amphipod Corophiumvolutator (Pallas),” Turkish Journal of Zoology, Vol. 23, 1999, pp. 67-71.
- J. A. Villaescusa-Celaya, E. A. Gutierrez-Galindo and G. Flores-Munoz, “Heavy Metals in the Fine Fraction of Coastal Sediments from Baja California (Mexico) and California (USA),” Environmental Pollution, Vol. 108, 2000, pp. 453-462. http://dx.doi.org/10.1016/S0269-7491(99)00222-5
- M. A. Badri and S. R. Aston, “Observation on Heavy Metal Geochemical Association in Polluted and Non-Polluted Estuarine Sediments,” Environmental Pollution, Series B, Vol. 6, 1983, pp. 181-183. http://dx.doi.org/10.1016/0143-148X(83)90033-2
- J. E. Duddridge and M. Wianwright, “Heavy Metals in River Sediment-Calculation of Metals Absorption Maximum Using Langmuir and Freundhch Isotherms,” Environmental Pollution, Vol. 2, 1981, pp. 131-136.
- A. Walkley and I. A. Black, “An Examination of the Degtjareff Method for Determining Organic Carbon in Soils: Effect of Variations in Digestion Conditions and of Inorganic Soil Constituents,” Soil Science, Vol. 63, 1934, pp. 251-263. http://dx.doi.org/10.1097/00010694-194704000-00001
- M. A. Badri, “A Study of Comparative Behavior of Selected Heavy Metals in Polluted and Unpolluted Estuarine and Coastal Sediments, Ph.D. Thesis, University of Lancaster, 1983.
- A. Naji, A. Ismail and A. R. Ismail, “Chemical Speciation and Contamination Assessment of Zn and Cd by Sequential Extraction in Surface Sediment of Klang River, Malaysia,” Microchemical Journal, Vol. 95, 2010, pp. 285- 292. http://dx.doi.org/10.1016/j.microc.2009.12.015
- A. K. Ahmad, I. Mushrifah and M. Shuhaimi-Othman, “Water Quality and Heavy Metal Concentrations in Sediment of Sungai Kelantan, Kelantan, Malaysia: A Baseline Study,” Sains Malaysiana, Vol. 38, No. 4, 2009, pp. 435-442.
- E. Olausson and I. Cato, “Chemistry and Biogeochemistry of Estuaries,” John Wiley and Son, New York, 1980.
- A. Fuentes, M. Lloréns, J. Sáez, M. I. Aguilar, J. F. Ortuño and V. F. Meseguer, “Comparative Study of Six Different Sludges by Sequential Speciation of Heavy Metals,” Bioresource Technology, Vol. 99, 2008, pp. 517-525. http://dx.doi.org/10.1016/j.biortech.2007.01.025
- C. K. Yap and S. G. Tan, “Heavy Metal Pollution in the Juru River Basin Receiving Industrial Effluents: The Need for Biochemical and Molecular Studies in the Edible Cockles Anadaragranosa. Malays,” Applied Biology, Vol. 37, No. 2, 2008, pp. 63-68.
- B. Perez-Cid, L. Lavilla and C. Bendicho, “Analytical Assessment of Two Sequential Extraction Schemes for Partitioning in Sewage Sludges,” Analyst, Vol. 121, 1996, pp. 1479-1484. http://dx.doi.org/10.1039/an9962101479
- G. P. S. Ritchie and A. M, “The Effect of pH and Metals Binding on the Transport Properties,” Journal of Soil Science, Vol. 33, 1992, pp. 233-247. http://dx.doi.org/10.1111/j.1365-2389.1982.tb01762.x
- E. Merian, “Environmental Analysis Chemistry,” Trend in Analytical Chemistry, Vol. 10, No. 8, 1991, pp. 229- 231. http://dx.doi.org/10.1016/0165-9936(91)85126-C
- J. R. Dean, “Methods for Environmental Trace Analysis,” Wiley, New York, 2002.
- L. Xiangdong, S. Zhenguo, W. H. W. Onyx and L. YokSheung, “Chemical Partitioning of Heavy Metal Contaminants in Sediments of the Pearl River Estuary,” Chemical Speciation and Bioavailability, Vol. 12, 2000, pp. 17-25. http://dx.doi.org/10.3184/095422900782775607
- K. Nemati, N. K. A. Bakar, M. R. Abas and E. Sobhanzadeh, “Speciation of Heavy Metals by Modified BCR Sequential Extraction Procedure in Different Depths of Sediments from Sungai Buloh, Selangor, Malaysia,” Journal of Hazardous Materials, Vol. 192, 2011, pp. 402-410.
- I. Orkun, D. G. Seckin, B. E. Cagatayhan, T. Yilmaz and B. Sari, “Heavy Metal Content and Distribution in Surface Sediments of the Seyhan River, Turkey,” Journal of Environmental Management, Vol. 92, 2011, pp. 2250-2259. http://dx.doi.org/10.1016/j.jenvman.2011.04.013