Journal of Environmental Protection
Vol.4 No.10(2013), Article ID:37560,11 pages DOI:10.4236/jep.2013.410125
Mapping Highly Cost-Effective Carbon Capture and Storage Opportunities in India
![]()
1Department of Geography, University of Cincinnati, Cincinnati, USA; 2International Center for Water Resources Research, Central State University, Wilberforce, USA; 3Lawrence Livermore National Laboratory, Livermore, USA.
Email: richard.beck@uc.edu
Copyright © 2013 Richard A. Beck et al. This is an open access article distributed under the Creative Commons Attribution License, which permits unrestricted use, distribution, and reproduction in any medium, provided the original work is properly cited.
Received July 26th, 2013; revised August 27th, 2013; accepted September 22nd, 2013
Keywords: Global Warming; Carbon Dioxide; CO2; Carbon Capture and Storage; CCS; Geologic Carbon Sequestration; GCS; India; Source-Sink Matching
ABSTRACT
Carbon dioxide (CO2) is the primary anthropogenic greenhouse gas (GHG). India’s CO2 emissions are expected to increase 70% by 2025. Geologic carbon storage (GCS) offers a way to reduce CO2 emissions. Here we present the results of a search for the most cost-effective GCS opportunities in India. Source-Sink matching for large and concentrated CO2 sources near geological storage in India indicates one very high priority target, a fertilizer plant in the city of Narmadanagar in Bharuch District of Gujarat Province, India that is <20 km from old oil and gas fields in the Cambay Basin. Two pure CO2 sources are <20 km from deep saline aquifers and one is <20 km from a coal field.
1. Introduction
1.1. Global Context of Geologic Carbon Sequestration
Fossil-fuels are crucial to our global economy and standard of living and will remain so for several more decades. Until recently, nearly all fossil-fuel consumption emitted carbon dioxide to the atmosphere. Carbon dioxide (CO2) is the primary anthropogenic greenhouse gas (GHG) [1]. The rate of CO2 emissions has steadily increased with global industrialization. Global CO2 concentrations in the atmosphere have increased 25% since 1850 and 15% since 1956. By 2011, global CO2 emissions totaled a record 34 billion metric tons [2]. These emissions were expected to grow 1.9% per year until at least 2025 [3] with the developing world’s emissions exceeding those of the current industrial nations in approximately 2020. The concentration of carbon dioxide in the atmosphere is expected to double by mid-century if the current emissions trend continues.
The biosphere and hydrosphere absorb approximately 1/3 of CO2 emissions [4] on time scales of hundreds to thousands of years. The remaining 2/3 are currently vented to the atmosphere. Nearly all scientists expect this increasing carbon dioxide concentration in the atmosphere to enhance mean global temperatures via the greenhouse effect. This steady, observed increase in the concentration of CO2 in the atmosphere coupled with the well established greenhouse effect presents a risk of excessive warming [5].
Recent globally averaged temperature measurements suggest that this risk is significant. Nine of the ten warmest years since 1850 have occurred between 1995 and 2004 [6,7]. Globally, 2012 was the ninth warmest year since 1979 but 11 of the warmest years since 1979 have occurred since 2001. The warmest year on record since 1901 was 2005. The second warmest was 2010 [8,9]. The earth is now nearly 0.5 degrees C warmer than it was in the period between 1961 and 1990 [7]. As one would expect, the influence of the observed temperature increase is greatest and most easily observed in the Arctic and Antarctic [10-12]. There is increasing evidence that warming is beginning to influence climate at mid-latitudes as well [13,14]. Regardless of one’s interpretation of observed increases in atmospheric CO2 and temperature, it would seem prudent to seek ways to mitigate the risk of excessive warming of the Earth by diverting the 2/3 of the carbon dioxide emissions not absorbed by the biosphere back into the Earth’s crust or the oceans [15].
Given scientific uncertainties, observed acidification and political questions associated with deep ocean storage of carbon dioxide, this and many other studies are focused on finding the best ways and places to store carbon dioxide underground [15]. Not surprisingly, most of the technology and fundamental data necessary to capture, transport and store carbon dioxide underground (Geological Carbon Storage or GCS) appears to be available in the hydrocarbon and coal industries. Indeed, GCS began in 1972 in the Permian Basin of West Texas. There are now more than 75 GCS projects that inject more than 40 million tons of CO2 per year worldwide [16]. This study seeks to find the most economical places to sequester carbon from the largest and most concentrated sources of carbon dioxide in the subsurface of South Asia. Given India’s overwhelming predominance in the population and economy [17] and total and per capita CO2 emissions of South Asia [17,18], its political stability, rapid economic development, and high level of technical expertise, this study focuses on India.
1.2. Carbon Dioxide Capture and Storage as a Means of Mitigating the Risk of Excessive Warming
Carbon dioxide capture and storage (CCS) has emerged as a critical technology pathway towards the stabilization and reduction of greenhouse gas emissions [1,19,20]. A necessary step to deployment of CCS/GCS at large scale is the accurate assessment of regional CO2 storage potential [21,22]. Towards that end, private and governmental assessment of CO2 storage potential in Australia and the Alberta basin [21,22] have served as the basis for research, planning, and policy. To help enable CCS/GCS technology deployment, the International Energy Agency (IEA) Greenhouse Gas R&D Programme has sponsored assessment for North America [23] and Europe [24]. These have provided data of sufficient accuracy, richness, and detail to enable calculations of CO2 storage cost curves to further help decision makers in planning CCS deployment.
Against this backdrop, many workers have noted that successful global reduction in greenhouse gas emissions will require CCS in developing countries, most notably China and India [25-30]. India presents a particularly interesting case for CCS/GCS deployment, due to the strength of existing legal and regulatory frameworks, the rapid, imminent expansion of coal power as part of India’s electrification strategy, and the geographic distribution of potential sinks. While large portions of the subcontinent are not well suited to storage, there is a surprisingly good overall match. Finally, there may be opportunities for India to deploy CCS/GCS in the context of the Kyoto clean development mechanism (CDM), the Asian-Pacific Partnership (APP), through direct Industrial sponsorship, and through novel development of resources (e.g., underground coal gasification).
1.3. Carbon Dioxide Emissions of India
India has the world’s second largest population of more than 1.2 billion people that is growing at a rate of 1.5% per year [30,31] and currently consumes energy at a per capita rate of 1/5 the global average. India’s GNP is growing at 5% - 7% per year and commercial energy consumption is increasing at 5.5% per year and is expected to accelerate [32,33]. Indeed, India’s per capita carbon emissions doubled between 1990 and 2011 from 0.8 to 1.6 metric tons per person. In 2011, India emitted approximately 1.97 million metric tons of carbon and is now the world’s fourth largest fossil-fuel CO2-emitting country [21,33-35].
Approximately 70% of India’s fossil-fuel CO2-emissions are from coal, 22% from oil and 4% from natural gas [33]. India has proven coal/lignite reserves of 118 billion tons, recoverable oil reserves are estimated at 640 million tons (10 year supply) and natural gas reserves are estimated at 850 billion cubic meters (30 year supply) with large potential for gas hydrate exploitation [31]. The energy mix for the year 2100 is predicted to be coal 50%, natural gas 25%, nuclear and renewables 25%. Therefore the critical technologies for India’s energy future are expected to be clean coal, natural gas including hydrates, thorium-based nuclear and renewables [31]. It is clear that India’s carbon dioxide emissions will increase substantially by 2100 in order to support an estimated 1.65 billion people [31]. India’s CO2 emissions are currently increasing at 3% - 6% per year [2] and are expected to increase 70% by 2025 [36]. Approximately 82% of CO2 emissions in South Asia are from India [23,24] making India the focus of this study. India’s CO2 emissions have risen from 1113 million metric tons in 2004 [37] to 1586 million metric tons in 2009 [18]. Of these emissions approximately 51% were from large (>0.1 million metric tons/year) stationary sources [18,23,24]. Given sufficiently cost-effective capture and transport technologies, there is clearly enormous scope for CO2 sequestration from stationary sources in India.
1.4. Second Order Geological Carbon Capture and Storage Assessment for India
First order assessments of the CCS/GCS potential of the Indian Subcontinent have been published [19,23,26-28, 38,39] that began the search for CCS sites in India. This paper builds on these studies and the IEA GHG database to begin a second order assessment of the region’s CCS/ GCS potential and attempts to identify the “very lowest hanging fruit” [38] in terms of maximum impact on CO2 emissions and lowest cost in preparation for CCS/GCS pilot projects in India.
According to Damodaran [40] CCS and GCS in particular have yet to be implemented on a large scale due to risks of leakage, access to technology, additional costs and financing difficulties. He also noted that CCS “can be economically feasible under specific conditions. This may be the case, for example, if CO2 is captured from low-cost sources, such as gas processing or ammonia plants, and used towards a productive end, such as enhancing oil recovery at a nearby oil field”. In particular, he noted that “high CO2 flue gas concentration enhances efficiency of capture and enables low unit costs”. Furthermore, Damodaran noted that “The costs of transport and storage are less onerous in comparison, and can be minimized by achieving economies of scale and/or by siting emitting plants close to potential storage sites such as oil and gas reservoirs”. Indeed, a 2012 CCS/GCS scoping study by the Global CCS Institute [41] revealed that safety, energy penalties and cost issues remain prohibitive in the minds of most CCS/GCS stakeholders in India. This study seeks to identify those large (>0.1 million tons CO2/yr) and concentrated (>30%) CO2 flue gas sources most amenable to cost-effective CO2 capture and storage that are very near probable storage reservoirs to identify the most cost-effective GCS opportunities in India.
2. Method
We used Internet searches to find missing locations for about one third of the International Energy Agency’s (IEA) major CO2 sources for India. Our study then used a Geographic Information System (GIS) to answer two questions. 1) Where are the major CO2 sources, sinks and risks in India? 2) Where should near-term geologic CO2 sequestration efforts be focused in India? We then used the Internet to locate 126 new CO2 sources and added them to the IEA GHG CO2 source database for India. We then captured and in most cases digitized two dozen cultural and physical map layers including sources, sinks and risks for geologic CO2 sequestration in India. These layers were then used to find which major (relatively) pure CO2 sources (>0.1 million tons CO2/yr) are within 20 km of high volume sequestration sites including old oil and gas fields, deep saline aquifers and coal fields to focus our storage capacity assessment.
3. Results
3.1. Large Stationary Carbon Dioxide Sources in India
Van Bergen et al. [38] and Damen et al. [26] restricted their search for early carbon sequestration opportunities to CO2 enhanced oil recovery (CO2-EOR) and CO2 enhanced coal bed methane (CO2-ECBM) sites due to their additional revenue potential. We expanded our search to include saline aquifers and depleted gas and oil reservoirs given that economic incentives are more likely ten years after their initial study. We began with the IEA GHG/Ecofys Carbon Source database. The IEA GHG database includes stationary sources greater than 0.1 million tons of CO2 per year with considerable detail regarding industrial sector, ownership, CO2 gas concentration etc. Given our focus on India we filtered both IEA and LLNL CO2 source databases for those greater than 0.1 million tons of CO2 per year within India. The IEA GHG database for South Asia lacked geographic locations for approximately one third of major CO2 sources. A major part of this effort to refine source-sink matching for South Asia involved Internet searches by company name, sector and other industrial details to find the names of the nearest populated place in order to obtain an approximate geographic location (latitude and longitude).
We then used a detailed map of India to make sure that the geographic location was reasonable and matched the district, province listed. In some cases the maps were not detailed enough so we were limited to providing a District level location. The average size of a district in India is 4300 km. Clearly those candidates which appear to be good candidates for CCS will require site visits and GPS locations to verify their exact locations and suitability. We were able to find geographic locations for 126 major CO2 sources and added them to the IEA GHG CO2 source database for India. We then engaged in some quality control work based on past field work in India (1983-2009) that included correcting obvious location errors. The refined IEA GHG database for South Asia indicated that approximately 82% of the CO2 emissions were from India. We continued to focus our efforts on India accordingly (Figure 1). CCS including GCS is most efficient when the CO2 streams are relatively concentrated. In order to find the most cost-effective candidates for CCS/GCS, we then filtered the IEA and LLNL CO2 sources for South Asia for by industrial sector in order to isolate those CO2 sources that usually have high purity CO2 flue gas (ammonia, ethylene oxide, hydrogen, liquefied natural gas (LNG) and cement) (Figure 2).
3.2. Geological Carbon Dioxide Sinks in India
We collected geographic locations for three types of geologic carbon sequestration opportunities in India, oil and gas reservoirs, coal fields and saline aquifers. We did not include mineral trapping of CO2 in flood basalts such as the Deccan Traps in this study simply because this is a relatively new field of study [42].
Oil and Gas Fields—Oil and gas fields are attractive because they have demonstrably contained oil and gas at high pressures for millions of years. They have demonstrable porosity, permeability and seal characteristics for which there is often direct data in the form of well logs and seismic data and a pool of labor with technical ex-
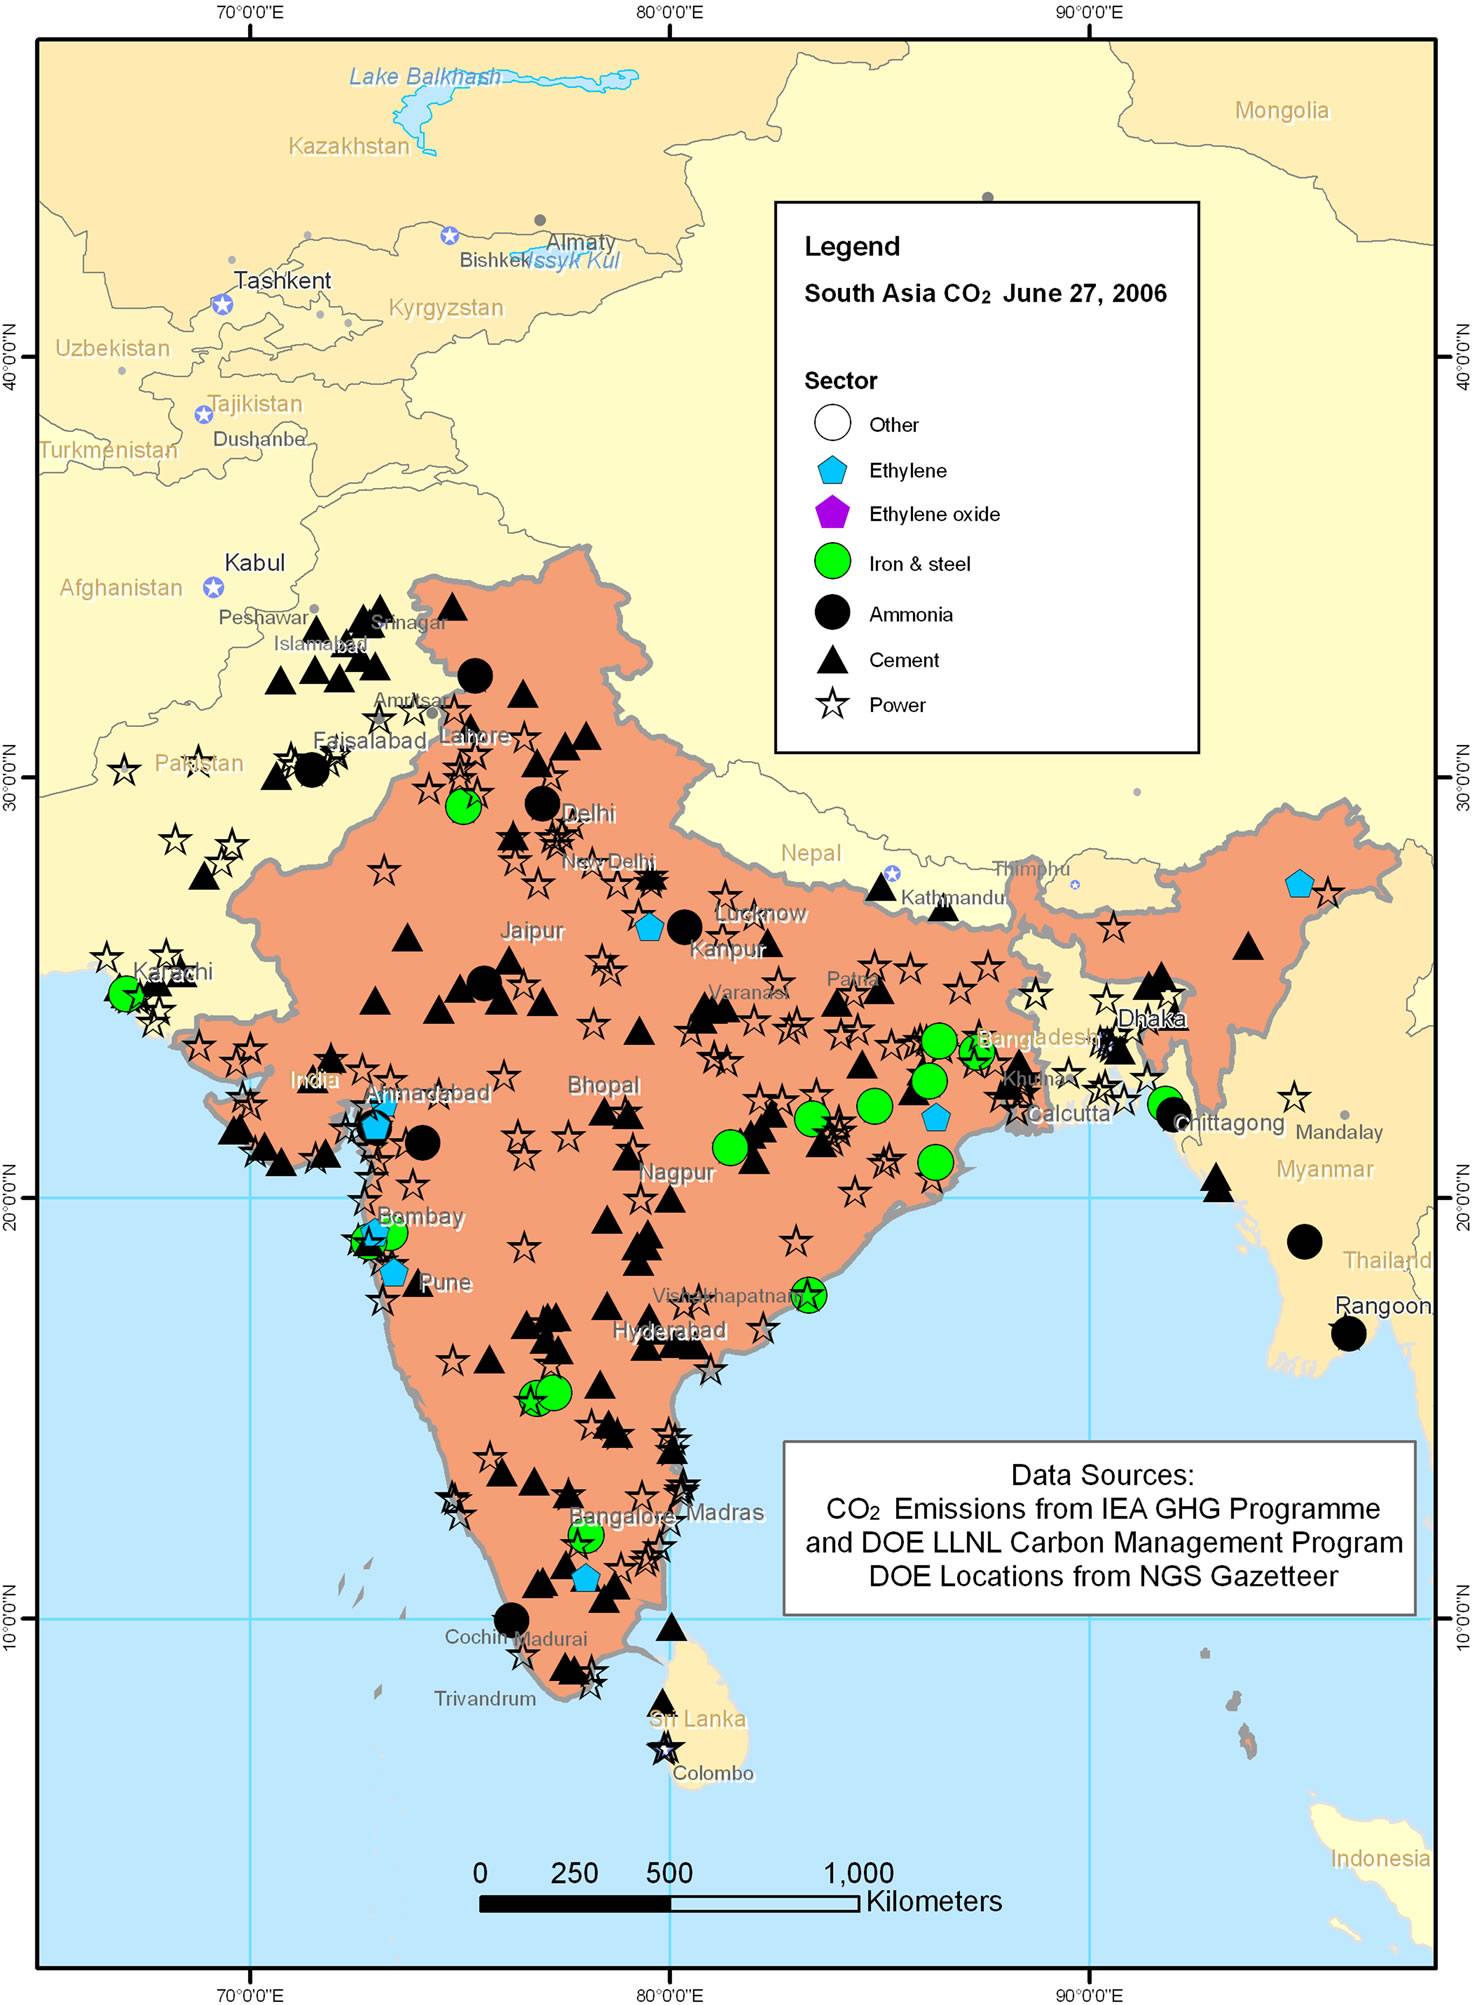
Figure 1. Map of South Asian IEA and LLNL GHG major stationary CO2 sources with LLNL additions.
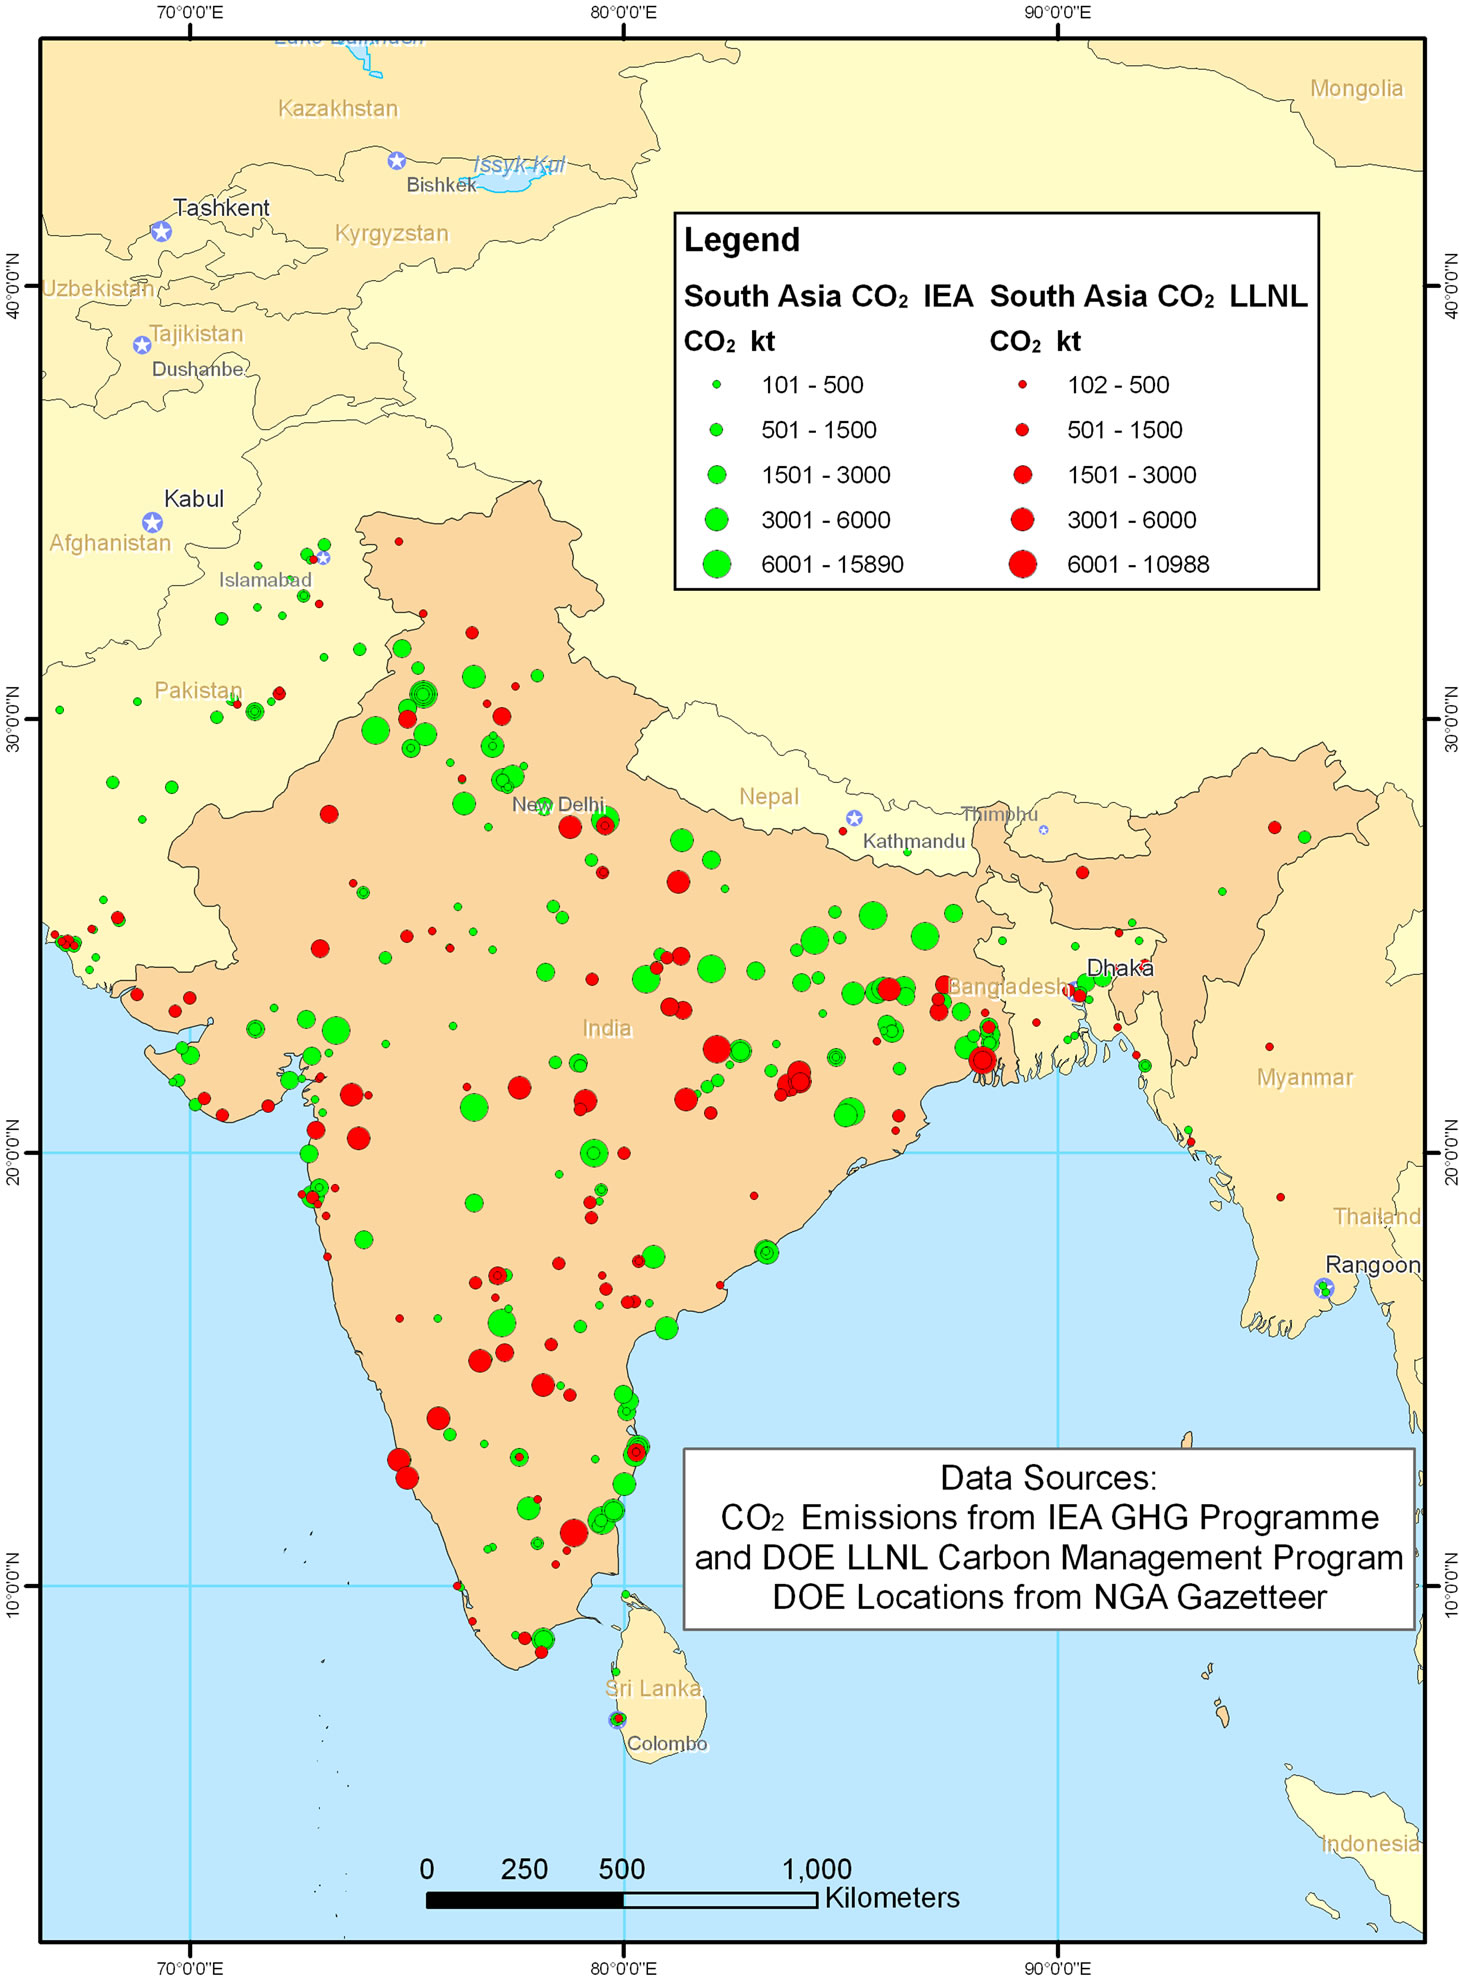
Figure 2. Map of large South Asia CO2 source types (>0.1 million tons CO2/yr) from IEA and LLNL stationary CO2 sources by industrial sector and by implication, effluent CO2 concentration in South Asia.
perience with these same fields. Moreover, the oil and gas industry has more than thirty years of experience with CO2 injection into oil and gas reservoirs for CO2- enhanced oil recovery (EOR) and much of the infrastructure in terms of pipelines, compressors and wells already exists or is readily available [43].
Van Bergen et al. [38] and Damen et al. [26] began their identification of early opportunities for CO2 sequestration with the USGS World Oil and Gas Assessment database [44] in order to find sites for CO2-EOR. As they noted, these assessment units and total petroleum systems are several hundred kilometers wide and not detailed enough for even first-order source sink matching. The USGS assessments do provide a guide as to where to begin looking for geologic carbon sequestration opportunities and contain a wealth of subsurface data for some sites.
We scanned, georeferenced, and vectorized maps of individual known oil and gas fields from maps within these assessment units [45-49]. We augmented this database with maps of oil and gas fields from the Directorate General of Hydrocarbons (India) and the Oil and Gas Regulatory Authority (Pakistan), BP-Amoco and ExxonMobil in a manner similar to that of Holloway et al. [28].
Deep Saline Aquifers—We are only beginning our assessment of deep saline aquifers in India. For our initial search we focused on large, very deep (>2 km) aquifers capable of providing confining pressures sufficient to hold CO2 in a supercritical phase and that are on-shore for the sake of cost [50-52]. We began with the Gangetic Siwalik aquifer because it is deep, large and not likely to be of interest for hydrocarbon exploration (with risk of depressurizing the deep saline aquifer). Raster images from a synthesis of Gangetic foreland basin strata [53] were geo-referenced and vectorized to obtain isopachs (similar to structure contours in this case) of this sand rich alluvial system.
Coal Fields—The sequestration and re-use of CO2 as part of enhancing coal bed methane (ECBM) production has been proposed by Stanton et al. [54] and van Berggen et al. [38]. In this process injected CO2 displaces the methane that is adsorbed to the surface of the coal along fractures. This makes ECBM both environmentally and economically attractive [55]. A raster image of coal fields in India was vectorized to provide the extent of coal fields in India. The map corresponded well with maps of individual coal fields [56].
3.3. Second-Order Source-Sink Matching for India
Geological carbon sequestration is most cost effective for large stationary sources [18,23,24]. Ideally such sources are near GCS sinks in order to reduce transport costs [40]. Therefore our next step was to filter the geo-referenced database for large CO2 sources (>0.1 million tons CO2/yr) that are less than 20 km from high volume geological carbon sequestration sites including old oil and gas fields, deep saline aquifers and coal fields to focus our search for highly cost-effective GCS opportunities in India (Figure 3 and Table 1).
Approximately 5.6 million tons/yr of CO2 are generated within 20 km of well understood old oil and gas fields. Approximately 40.6 million tons/yr of CO2 are generated within 20 km of saline aquifers. Both old oil and gas fields and saline aquifers are likely to have significant long-term storage capacity (under evaluation by our team). In addition, about 94.8 million tons/yr of CO2 are generated within 20 km of coal fields which may also have significant capacity for GCS.
Approximately 30 sources that generate more than 0.1 million tons of CO2 are within 20 km of well understood oil and gas fields and major saline aquifers and emit almost 50 million tons of CO2 per year. This represents nearly one fifth of India’s total CO2 emissions. An additional 47 sources are within 20 km of coal fields and emit nearly 100 million tons of CO2 per year and represent an additional two fifths of India’s CO2 emissions. These results will focus our evaluation of CO2 storage capacity, porosity and permeability and risk in India. Our general source sink matching results are summarized in Table 1.
As noted by Damodaran [40], one of the objections of Indian stake holders to GCS is the additional financial and energy cost of concentrating CO2 flue gases. Concentration is necessary to increase the efficiency and decrease the additional costs of transport, injection and sequestration capacity utilization and to enable some desirable geochemical changes once the CO2 has been injected into the subsurface such as supercriticality. Therefore, once the large (>0.1 million tons CO2/yr) stationary sources of CO2 emissions from the IEA and LLNL databases had been located, mapped and filtered by proximity

Table 1. India’s CO2 emissions by storage reservoir type and distance to large stationary CO2 sources (kilotons).
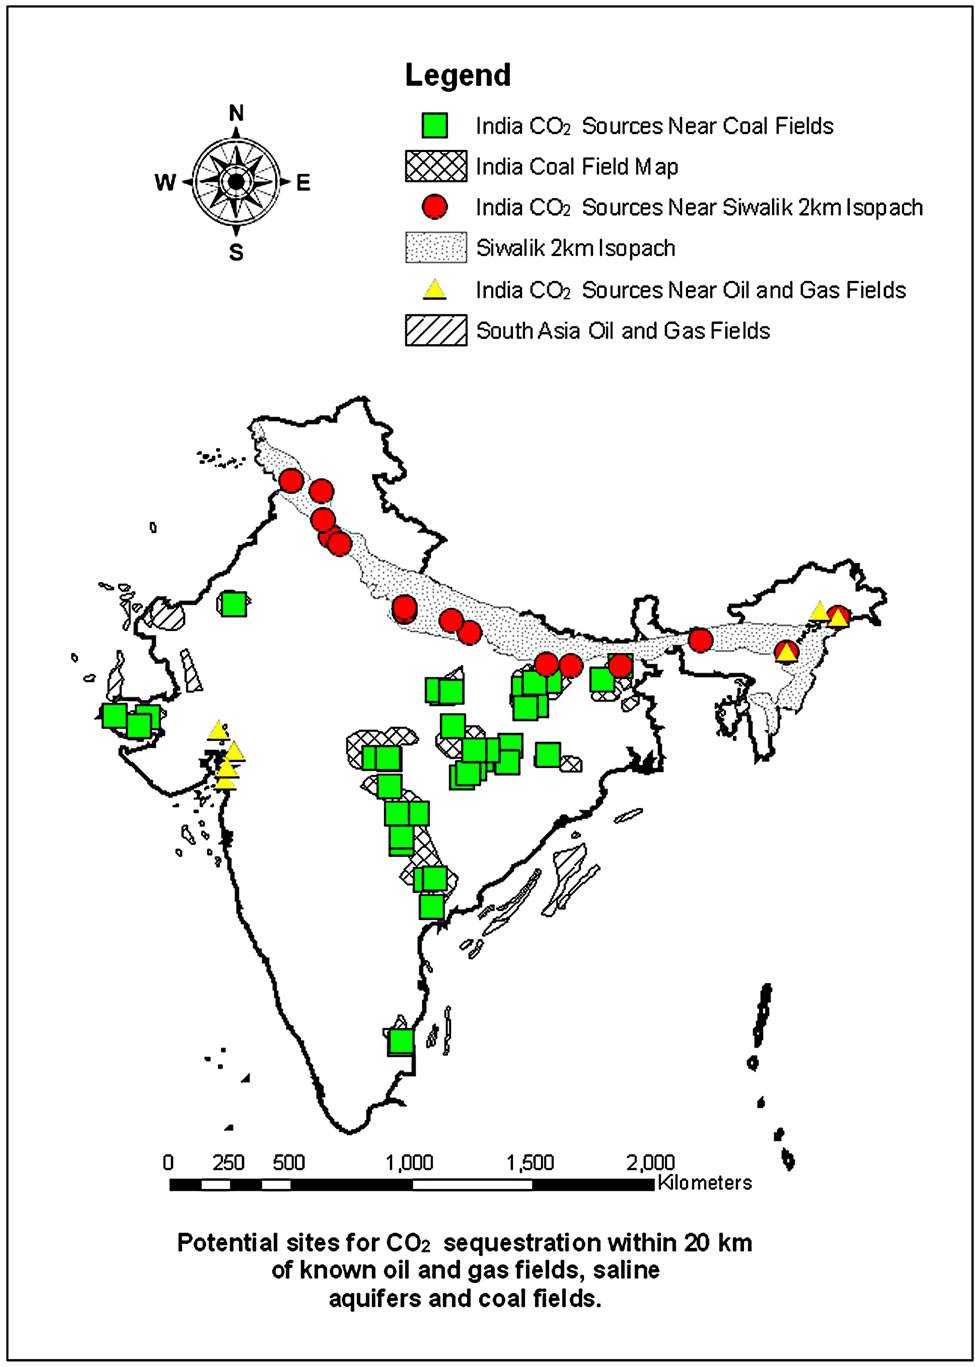
Figure 3. Map of major India (>0.1 million tons CO2/yr) CO2 sources <20 km from sinks classified by adjacent geological sink type in India.
(<20 km) to potential geological carbon storage sinks, we then filtered them by industrial sector type to isolate those with typically high (>30%) CO2 flue gas concentrations.
We then filtered those large and concentrated stationary CO2 sources by proximity to each type of GCS opportunity considered in this study (oil and gas fields, deep saline aquifers, and coal beds) (Tables 2-5).
We then mapped (Figures 4-7) a short list of what are likely to be some of the most cost-effective carbon sequestration opportunities in India by GCS opportunity type. The next step is for local Indian stake holders to evaluate each of these candidates in detail so that future proposals for GCS in India meet local requirements and budgets.
4. Conclusions
Our analysis indicates that approximately 5.6 million tons/yr of CO2 are generated within 20 km of well understood old oil and gas fields in India. Approximately 40.6 million tons/yr of CO2 are generated within 20 km of saline aquifers in India. Both old oil and gas fields and saline aquifers are likely to have significant long-term storage capacity. In addition, about 94.8 million tons/yr of CO2 are generated within 20 km of coal fields which may also have significant capacity for geologic CCS.
Approximately 30 sources that generate more than 0.1 million tons of CO2 are within 20 km of well understood oil and gas fields and major saline aquifers and emit almost 50 million tons of CO2 per year. This represents

Table 2. India’s large (>0.1 million tons CO2/yr) and concentrated (>30% by volume) CO2 sources by sector).

Table 3. India’s large (>0.1 million tons CO2/yr) and concentrated (>30% by volume) CO2 sources <20 km from oil and gas fields).

Table 4. India’s large (>0.1 million tons CO2/yr) and concentrated (>30% by volume) CO2 sources <20 km from deep saline aquifers in the Siwaliks.

Table 5. India’s large (>0.1 million tons CO2/yr) and concentrated (>30% by volume) CO2 sources <20 km from coal fields.
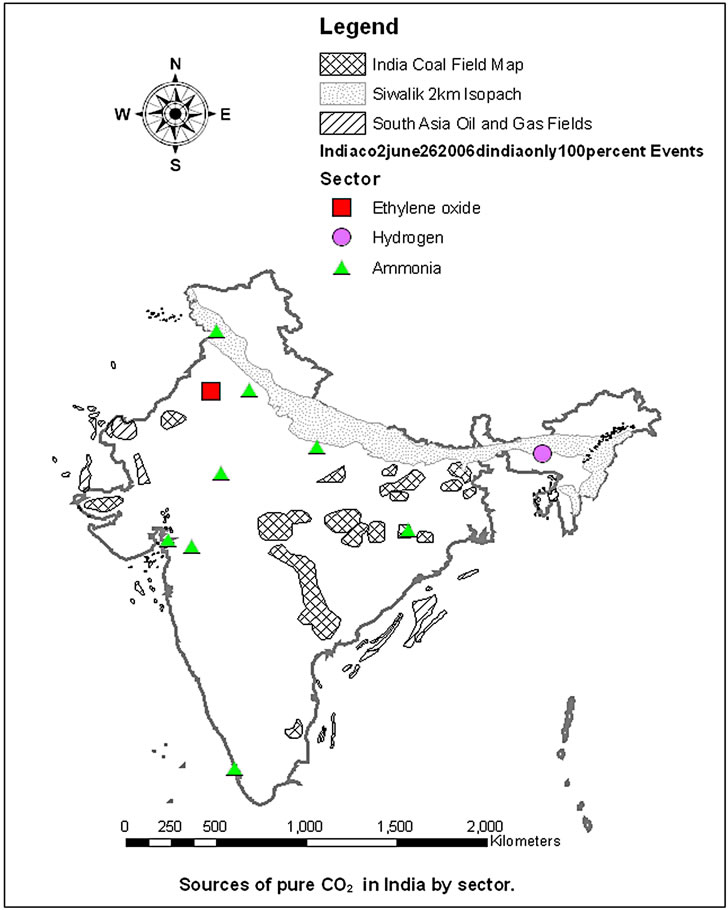
Figure 4. Map of large (>0.1 million tons CO2/yr) and concentrated (>30% by volume) CO2 sources by sector in India.
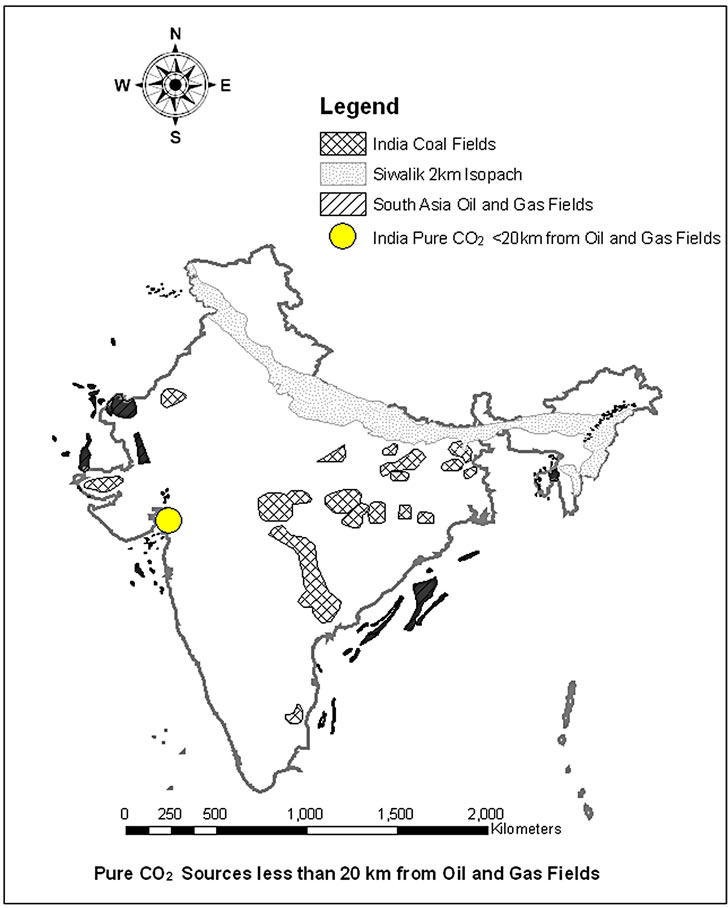
Figure 5. Map of large (>0.1 million tons CO2/yr) and concentrated (>30%) CO2 sources <20 km from oil and gas fields in India.
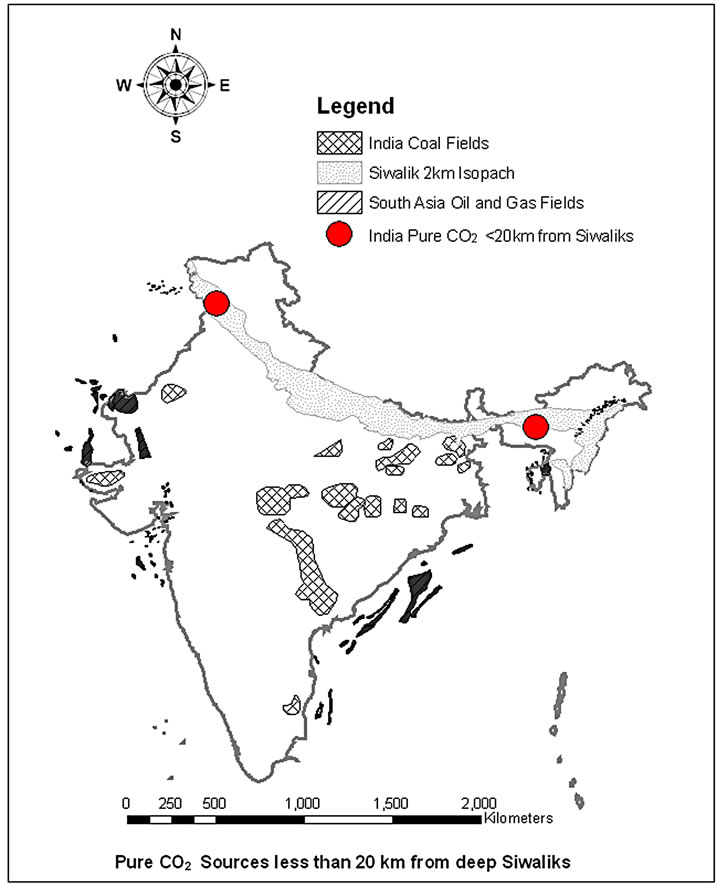
Figure 6. Map of large (>0.1 million tons CO2/yr) and concentrated (>30% by volume) CO2 sources <20 km from deep saline aquifers in the Siwalik Formations of the Gangetic Foreland Basin of India.

Figure 7. Map of large (>0.1 million tons CO2/yr) and concentrated (>30% by volume) CO2 sources <20 km from coal fields in India.
nearly one fifth of India’s total CO2 emissions. An additional 47 sources are within 20 km of coal fields and emit nearly 100 million tons of CO2 per year and represent an additional two fifths of India’s CO2 emissions.
Source-Sink matching for large concentrated CO2 sources in India indicates one very high priority target, a fertilizer plant in the city of Narmadanagar, Bharuch District, Gujarat Province, India, that is <20 km from old oil and gas fields in the Cambay Basin. Two pure CO2 sources are <20 km from deep saline aquifers and one is <20 km from a coal field.
5. Acknowledgements
We thank Lawrence Livermore National Laboratory for financial support, office space and much of the data used in this analysis. Additional CO2 source and sink data sets were contributed by the International Energy Agency and the United States Geological Survey.
REFERENCES
- Intergovernmental Panel on Climate Change, “IPCC Special Report on Carbon dioxide Capture and Storage,” Interlachen, 2005. http://www.ipcc.ch/
- J. G. J. Olivier, G. Janssens-Maenhout and J. A. H. W. Peters, “Trends in Global CO2 Emissions,” PBL (Netherlands Environmental Assessment Agency), 2012, 40 p. http://edgar.jrc.ec.europa.eu/CO2REPORT2012.pdf
- Energy Information Administration, “Greenhouse Gases, Climate Change and Energy,” 2006. http://www.eia.doe.gov/oiaf/1605/ggccebro/chapter1.html
- NASA, “The Biosphere,” 1998. http://www.gsfc.nasa.gov/gsfc/service/gallery/fact_sheets/earthsci/eos/biosphere.pdf
- E. Mills, “The Coming Storm: Global Warming and Risk Management,” Risk Management Magazine, Vol. 45, No. 5, 1998, pp. 20-27.
- P. D. Jones, M. New, D. E. Parker, S. Martin and I. G. Rigor, “Surface Air Temperature and Its Changes over the Past 150 Years,” Reviews of Geophysics, Vol. 37, No. 2, 1999, pp. 173-199. http://dx.doi.org/10.1029/1999RG900002
- P. D. Jones and A. Moberg, “Hemispheric and LargeScale Surface Air Temperature Variations: An Extensive Revision and an Update to 2001,” Journal of Climate, Vol. 16, No. 2, 2003, pp. 206-223. http://dx.doi.org/10.1175/1520-0442(2003)016<0206:HALSSA>2.0.CO;2
- T. M. Smith, et al., “Improvements to NOAA’s Historical Merged Land-Ocean Surface Temperature Analysis (1880- 2006),” Journal of Climate, Vol. 21, No. 10, 2008, pp. 2283-2293. http://dx.doi.org/10.1175/2007JCLI2100.1
- NOAA, “NCDC: Global Surface Temperature Anomalies: Global Mean Temperature Estimates,” 2013. http://www.ncdc.noaa.gov/cmb-faq/anomalies.php#mean
- M. C. Serreze, J. E. Walsh, F. S. Chapin III, T. Osterkamp, M. Dyurgerov, V. Romanovsky, W. C. Oechel, J. Morison, T. Zhang and R. G. Barry, “Observational Evidence of Recent Change in the Northern High Latitude Environment,” Climatic Change, Vol. 46, No. 1-2, 2000, pp. 159-207. http://dx.doi.org/10.1023/A:1005504031923
- J. T. Houghton, Y. Ding, D. J. Griggs, M. Noguer, P. J. van der Linden, X. Dai, K. Maskell and C. A. Johnson, “Climate Change (2001)—The Scientific Basis,” Geneva —Intergovernmental Panel on Climate Change (IPCC), 2001.
- C. D. Keeling and T. P. Whorf, “Atmospheric CO2 Records from Sites in the SIO Air Sampling Network,” In: Trends: A Compendium of Data on Global Change, Carbon Dioxide Information Analysis Center, Oak Ridge National Laboratory, US Department of Energy, Oak Ridge, 2004. http://cdiac.esd.ornl.gov/trends/co2/sio-mlo.htm
- Q. Fu, C. M. Johanson, J. M. Wallace and T. Reichler, “Enhanced Mid-Latitude Tropospheric Warming in Satellite Measurements,” Science, Vol. 312, No. 5777, 2006, p. 1179. http://dx.doi.org/10.1126/science.1125566
- J. A. Francis and S. J. Vavrus, “Evidence Linking Arctic Amplification to Extreme Weather in Mid-Latitudes,” Geophysical Research Letters, Vol. 39, 2012, Article ID: L06801. http://dx.doi.org/10.1029/2012GL051000
- S. M. Benson, “Carbon Dioxide Capture and Storage in Underground Geologic Formations, The 10 - 50 Solution: Technologies and Policies for a Low-Carbon Future,” The Pew Center on Global Climate Change and the National Commission on Energy Policy, 2004. http://www.pewclimate.org/docUploads/10%2D50%5FBenson%2Epdf
- GCCSI, “Projects,” Global CCS Institute, 2013. http://www.globalccsinstitute.com/projects/browse
- World Bank, “Regional Data at a Glance,” 1999. http://www.worldbank.org/html/extdr/spring99/regionaldata.pdf
- IEA—International Energy Agency, “CO2 Capture and Storage: A Key Carbon Abatement Option,” OECD/IEA, 2008.
- J. Gale, “Overview of CO2 Emission Sources, Potential, Transport and Geographical Distribution of Storage Possibilities,” 2002. http://arch.rivm.nl/env/int/ipcc/docs/css2002/ccs02-01.pdfs
- S. Pacala and R. Socolow, “Stabilization Wedges: Solving the Climate Problem for the Next 50 Years Using Current Technologies,” Science, Vol. 305, No. 5686, 2004, pp. 986-972. http://dx.doi.org/10.1126/science.1100103
- J. Bradshaw, G. Allison, B. E. Bradshaw, V. Nguyen, A. J. Rigg, L. Spencer and P. Wilson, “Australia’s CO2 Geological Storage Potential and Matching of Emission Sources to Potential Sinks,” In: Greenhouse Gas Control Technologies, Proceedings of the 6th International Conference on Greenhouse Gas Control Technologies, Kyoto, 1-4 October 2002, p. 2003.
- S. J. Friedmann, J. J. Dooley, H. Held and O. Edenhofer, “The Low Cost of Geological Assessment for Underground CO2 Storage: Policy and Economic Implications,” Energy Conversion Management, Vol. 47, No. 13-14, 2006, pp. 1894-1901. http://dx.doi.org/10.1016/j.enconman.2005.09.006
- IEA—International Energy Agency Greenhouse R&D Programme, “Building the Cost Curves for CO2 Storage: North America,” Technical Report 2005/03, 2005.
- IEA—International Energy Agency Greenhouse R&D Programme, “Building the Cost Curves for CO2 Storage: European Sector,” Technical Report 2005/02, 2005.
- J. J. Dooley and S. J. Friedmann, “A Regionally Disaggregated Global Accounting of CO2 Storage Capacity: Data and Assumptions,” Pacific Northwest National Laboratory, Report PNWD-3431, 2004.
- K. Damen, A. Faaij, F. van Bergen, J. Gale and E. Lysen, “Indentification of Early Opportunities for CO2 Sequestration—Worldwide Screening for CO2-EOR and CO2- ECBM Projects,” Energy, Vol. 30, No. 10, 2005, pp. 91931-1952. http://dx.doi.org/10.1016/j.energy.2004.10.002
- A. K. Singh, V. A. Mendhe and A. Garg, “CO2 Storage Potential of Geologic Formations in India,” 8th Greenhouse Gas Technology Conference, Trondheim, 19-22 June 2006, pp. Session A1-A2.
- S. Holloway, A. Garg, M. Kapsche, A. S. Pracha, S. R. Khan, M. A. Mahood, T. N. Singh, K. L. Kirk, L. R. Applequist, A. Deshpande, D. J. Evans, Y. Garg, C. J. Vincent and J. D. O. Williams, “A Regional Assessment of the Potential for CO2 Storage in the Indian Subcontinent,” British Geological Survey, 2007, 201 p.
- R. V. Kapila and R. S. Haszeldine, “Opportunities in India for Carbon Capture and Storage as a Form of Climate Change Mitigation,” Energy Prodedia, GHGT-9 Volume, 2008, 8 p.
- R. V. Kapila, H. Chalmers and M. Leach, “Investigating the Prospects for Carbon Capture and Storage Technology in India,” Report for Christian Aid, 2009, 137 p.
- P. K. Kaw, “Short Report on the Energy Situation in India,” Report on Research and Development of Energy Technologies, IUPAP Working Group on Energy, International Union of Pure and Applied Physics, 2004. http://www.iupap.org/wg/energy/annexb.pdf
- G. Marland, T. A. Boden and R. J. Andres, “Global, Regional, and National CO2 Emissions,” In: Trends: A Compendium of Data on Global Change. Carbon Dioxide Information Analysis Center, Oak Ridge National Laboratory, US Department of Energy, Oak Ridge, 2000.
- G. Marland, T. A. Boden and R. J. Andres, “Global, Regional, and National CO2 Emissions,” In: Trends: A Compendium of Data on Global Change. Carbon Dioxide Information Analysis Center, Oak Ridge National Laboratory, US Department of Energy, Oak Ridge, 2008.
- C. Le Quéré, et al., “The Global Carbon Budget 1959- 2011,” Earth System Science Data Discussions, Vol. 5, No. 2, 2012, pp. 1107-1157. http://dx.doi.org/10.5194/essdd-5-1107-2012
- G. P. Peters, R. M. Andrew, T. Boden, J. G. Canadell, P. Ciais, C. Le Quéré, G. Marland, M. R. Raupach and C. Wilson, “The Challenge to Keep Global Warming below 2˚C,” Nature Climate Change, Vol. 3, 2012, pp. 4-6. http://dx.doi.org/10.1038/nclimate1783
- B. Walsh, “The Impact of Asia’s Giants, How China and India Could Save the Planet—Or Destroy It,” 2006. http://www.time.com/
- Energy Information Administration, “Annual Energy Review,” 2004. http://www.eia.gov/totalenergy/data/annual/archive/038404.pdf
- F. van Bergen, J. Gale, K. J. Damen and A. F. B. Wildenborg, “Worldwide Selection of Early Opportunities for CO2-Enhanced Oil Recovery and CO2-Enhanced Coal bed Methane Production,” Energy, Vol. 29, No. 9-10, 2004, pp. 1611-1621. http://dx.doi.org/10.1016/j.energy.2004.03.063
- P. Bumb and R. Vasant, “Carbon Capture and Storage (CCS) in Geological Formations as Clean Development Mechanism (CDM) Projects Activities (SBSTA),” 2009, 10 p. http://cdm.unfccc.int/about/ccs/docs/CCS_geo.pdf
- A. Damodaran, “Carbon Capture and Storage: India’s Concerns, Carbon Sequestration,” Leadership Forum, New Delhi, 2008. http://www.cslforum.org/publications/documents/IndiaPresentationFITFMeetingNewDelhi1208.pdf
- A. Gibson, “CCS Too Much for India Now?” Global Carbon Capture and Storage Institute, 2012. http://www.globalccsinstitute.com/insights/authors/alicegibson/2012/02/16/ccs-too-much-india-now
- S. Plasynski, A. McNemar and P. McGrail, “CO2 Sequestration in Basalt Formations,” US DOE, National Energy Technology Laboratory, 2008. http://www.netl.doe.gov/publications/factsheets/project/Proj277.pdf
- S. H. Stevens, V. A. Kuuskraa and J. Gale, “Sequestration of CO2 in Depleted Oil & Gas Fields: Global Capacity, Costs and Barriers,” Proceedings of GHGT-5, Cairns, 13- 16 August 2000, pp. 278-283.
- USGS World Energy Assessment Team, “U.S. Geological Survey World Petroleum Assessment 2000—Description of Results,” USGS Digital Data Series DDS-60 Multi Disc Set Version 1.0, 2000 (CD-ROMs).
- C. J. Wandrey and B. E. Law, “Map Showing Geology, Oil and Gas Fields, and Geologic Provinces of South Asia,” Version 2.0, Open File Report 97-470C, 1999, Version 2 (CD-ROM).
- C. J. Wandrey, “Region 8 Assessment Summary—South Asia,” In: C. J. Wandrey, R. Milici and B. E. Law, Eds., U.S. Geological Survey Digital Data Series 60, 2000, 39 p.
- C. J. Wandrey, “Patala-Nammal Composite Total Petroleum System, Kohat-Potwar Geologic Province, Pakistan,” Petroleum Systems and Related Geologic Studies in Region 8, South Asia, U.S. Geological Survey Bulletin 2208-B, 2000 (CD-ROM).
- C. J. Wandrey, “Sembar Goru/Ghazij Composite Total Petroleum System, Indus and Sulaiman-Kirthar Geologic Provinces, Pakistan and India,” Petroleum Systems and Related Geologic Studies in Region 8, South Asia, U.S. Geological Survey Bulletin 2208-C, 2000 (CD-ROM).
- C. J. Wandrey, “Sylhet-Kopili/Barail-Tipam Composite Total Petroleum System, Assam Geologic Province, India, Petroleum Systems and Related Geologic Studies in Region 8, South Asia,” U.S. Geological Survey Bulletin 2208-D, 2000 (CD-ROM).
- S. T. McCoy, “The Economics of CO2 Transport by Pipeline and Storage in Saline Aquifers and Oil Reservoirs,” “Department of Engineering and Public Policy” Paper 1, 2009. http://repository.cmu.edu/epp/1
- J. K. Eccles, L. Pratson, N. G. Newell and R. B. Jackson, “Physical and Economic Potential of Geological CO2 Sequestration in Saline Aquifers,” Environmental Science Technology, Vol. 43, No. 6, 2009, pp. 1962-1969. http://pubs.acs.org/doi/abs/10.1021/es801572e
- S. Sharma, K. Michael, G. Allinson, M. Arnot, P. Cook, J. Ennis-King and V. Shulakova, “CO2 Storage in Saline Aquifers: Review of Recent Scientific Progress and Remaining Issues,” IFP, Rueil-Malmaison, 27-29 May 2009. www.ifp.com/content/download/67989/1473855/file/33_Michael.pdf
- D. W. Burbank, R. A. Beck and T. Mulder, “The Himalayan Foreland,” In: Y. An and M. Harrison, Eds., Asian Tectonics, Cambridge University Press, Cambridge, 1996, pp. 149-188.
- R. Stanton, R. Flores, P. D. Warwick, H. Gluskoter and G. D. Stricker, “Coal Bed Sequestration of Carbon Dioxide,” U.S. Department of Energy, 2001. http://www.netl.doe.gov/publications/proceedings/01/carbon_seq/3a3.pdf
- S. Wong, W. D. Gunter, D. H.-S. Law and M. J. Mavor, “Economics of Flue Gas Injection and CO2 Sequestration in Coalbed Methane Reservoirs,” In: D. Williams, B. Durie, P. McMullan, C. Paulson and A. Smith, Eds., Proceedings of the 5th International Conference on GHG Control Technologies, CSIRO Publishing, Cairns, 2001, pp. 543-548.
- M. S. Krishnan, “Geology of India and Burma,” 6th Edition, Satish Kumar Jain for CBS Publishers and Distributors, Delhi, 1982, 536 p.